1455 Sawin Ct NE · Palm Bay, FL
Flood risk 1/10 · Minimal
- FEMA flood zone
- X (unshaded)
- Chance of flooding over 30 yrs
- 0.0%
- Est. flood insurance / yr
- $507 – $1,088
Fire risk 3/10 · Minor
- Est. fire insurance / yr
- $947 – $1,759
Heat risk 10/10 · Severe
- Hot days now (above 106°F)
- 7 days/yr
- Hot days in 30 yrs
- 22 days/yr
Wind risk 10/10 · Severe
- Chance of severe wind over 30 yrs
- 99.0%
Air-quality risk 1/10 · Minimal
- Unhealthy air days now
- 0 days/yr
- Unhealthy air days in 30 yrs
- 0 days/yr
Risk factors via First Street. Map © Google.
Why this score? — see what drove the C- grade
The composite is a weighted blend of 9 inputs, each scored 0–100. Each bar is that input's sub-score; the figure is the points it added to the 100-point composite (weight × sub-score).
- Cash flow +16.8/30.0
- ARV discount +7.5/15.0
- 1% rule +5.5/10.0
- DSCR +5.2/10.0
- Schools +4.7/10.0
- Livability +3.6/5.0
- Condition / age +2.5/5.0
- Rent growth +2.4/5.0
- Appreciation +2.2/10.0
$189,900
🖨 Deal sheet 📄 Offer letter ✓ Due diligence
Listing remarks MLS
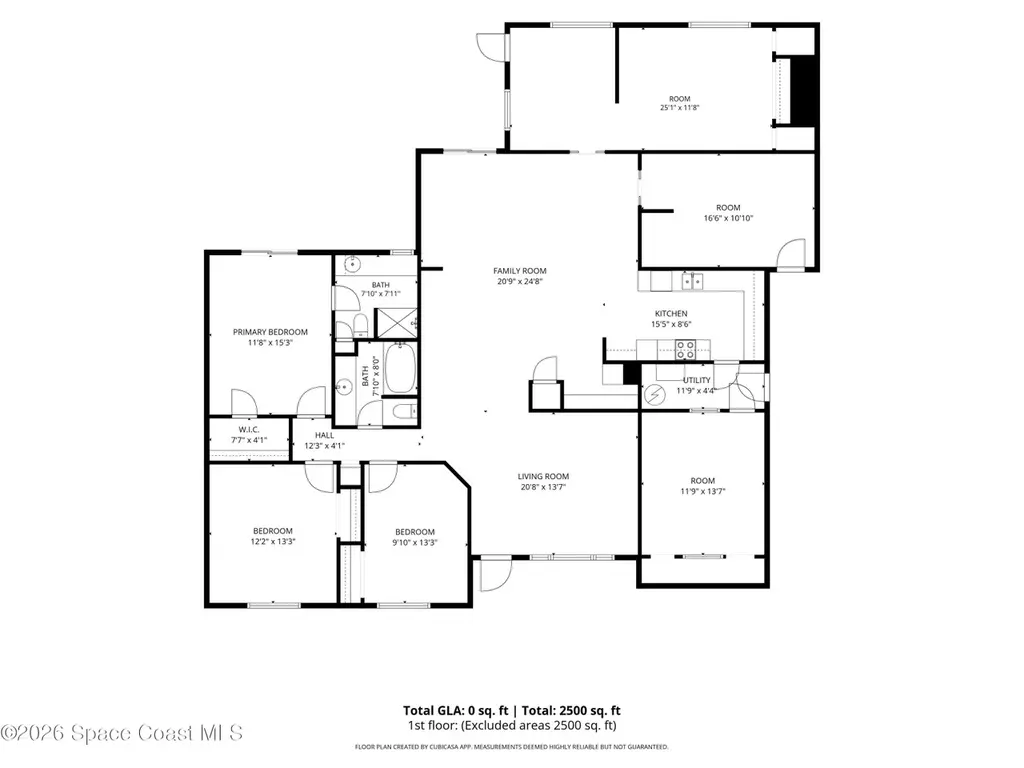
Blank Canvas Opportunity! Spacious 1,689 sq. ft. home offering endless potential for customization and value creation. This versatile property features a converted enclosed garage and an enclosed patio, providing additional living space that can be tailored to fit your needs--whether it's a home office, hobby room, fitness area, guest space, or expanded entertaining area. The functional floor plan offers a solid foundation for renovation and personal touches. Conveniently located with easy access to shopping, dining, schools, and major roadways. Bring your vision and transform this property into the home you've always wanted or a great investment opportunity. DIY --create the space that fits your lifestyle!
Key facts
- Enclosed patio
- 0.47 acre lot
- Garage
Tags
Property features AI
Finance
- Other: No land lease; Pets allowed with no restrictions
Exterior
- Parking: Driveway with two open parking spaces (total 2)
- Utilities: Public water; Public sewer; Electricity connected; Water connected
- Home design: Single-family residence; One story; Resale property; Faces south
- Construction: Frame construction; Shingle roof; Slab foundation; Built area approximately 1,953 total; living area approximately 1,689
- Exterior features: Screened patio and additional patio; Fenced yard; City street and county road frontage; Asphalt road access; Not waterfront
Interior
- Bedrooms: Three bedrooms on the main level
- Flooring: Concrete flooring; Tile flooring
- Bathrooms: Two full bathrooms on the main level
- Heating & cooling: Electric central heating; Central air conditioning
- Interior features: Split bedroom layout
Neighborhood map
What this means for you Summary
Snapshot
- This is a 3-bed/2.0-bath single-family listed at $190k.
Deal economics
- At list price, monthly cash flow is $122 ($1k/yr) — positive.
- The deal already cash-flows at list — no discount required.
- Meets the 1% rule at list price ($2k rent vs $190k).
Location & tenants
- Location reads 72/100 on livability (#366 in FL) — a middle-class / working-renter tenant base. Strengths: cost of living A+, housing A+; Watch: schools C-, employment D+, amenities F.
- Brevard (suburban): math 53% / reading 57% proficiency, ranked #19 of 73 in FL (top 26%) — acceptable for families but not a draw, mixed tenant base, ~2y average lease.
- Market conditions: Rents soft (-0.5%/yr); 321 active listings in the ZIP; 40 comparable units currently listed for rent nearby; rentals at typical pace (median 24d on market — plan ~3-4 weeks tenant-placement turnaround); 4,602 units permitted in Brevard County in 2024 (702 in 5+ unit buildings).
- This rent runs 42% of the median local income ($56k/yr) — at the standard rent-burdened threshold; future hikes will face affordability resistance.
Forward outlook
- Local home prices are declining (-3.0%/yr); year-one equity from $1k of loan paydown is wiped out by about $6k of value loss. Plan a longer hold.
- Brevard County population projected at +15% by 2050 — modest demand growth; plan on rents tracking national, not racing it.
Negotiation context
- Only 10 days on market — expect competitive offers; lowballing is unlikely to land.
- 5 sale attempts since 20y ago with the ask held roughly flat each time — persistent listings suggest the price (not the market) is what's stuck; bring a comps-based counter.
Risks & watch-outs
- Climate carrying-cost: severe wind risk, 99% chance of damaging wind over 30y; extreme-heat days projected 7→22/yr by 2055 (HVAC capex compounding) — expect insurance premiums to compound above CPI over the hold.
Questions for the listing agent
- Built in 1979 — when were the roof, HVAC, electrical panel, plumbing, and water heater last replaced?
- Is there a deadline driving the sale (1031 exchange, divorce, estate, relocation)? That informs how much negotiation room exists.
- What's the average days-on-market for RENTAL listings here right now (not sales)? A rising rental-DOM trend means longer vacancies and softer asking-rent achievability than the comps imply.
- What's the recent tenant-quality profile in this submarket — average credit score on applications, eviction rate, late-payment / NSF rate, and stable-employment percentage? A property-management company in the area should have these aggregated.
- How much new for-sale + rental construction is in the pipeline within 1–3 miles? Heavy new supply typically softens prices + rents 12–24 months out; constrained supply supports both.
Investment metrics
- 1% rule
- 1.05% ✓
- Cap rate
- 7.06%
- Cash-on-cash
- 2.75%
- DSCR
- 1.12
- GRM
- 8.0
CMA / ARV
No comps found within radius.
Projected returns pro-forma
-3.0% appreciation · 0.0% rent growth · sell at horizon
- IRR
- -15.7%
- Equity multiple
- 0.46×
- Total profit
- $-28,716
- Equity at exit
- $28,315
- IRR
- -14.2%
- Equity multiple
- 0.30×
- Total profit
- $-37,066
- Equity at exit
- $16,419
Cash invested: $53,172 (down + closing). Projections, not guarantees.
Landlord ↔ Tenant lean methodology
- Overall (STATE)
- 87 Strongly Landlord-Friendly
- State Florida
- 87 Strongly Landlord-Friendly · R+3
- County
- — inherits STATE
- City
- — inherits STATE
ZIP-level market 32905
- Home prices YoY
- -1.8%
- Rents YoY
- -0.5%
- Active inventory
- 321
- Price-to-rent
- 8.0×
Monthly cashflow live
- Estimated rent
- $1,990 high interval (Pro) →
- Mortgage (P&I)
- −$996
- Tax from tax record
- −$375 /mo · $4,499/yr
- Insurance
- −$79
- HOA
- −$0
- Vacancy / Maint / Mgmt
- −$418
- Net cashflow
- $122
Break-even live
UW: 25.0% down · 7.5% · 30yr · 1.5% tax · 5.0% vac · 8.0% maint · 8.0% mgmt
Financing live
Cash to close
- Down payment
- $47,475
- Closing costs
- $5,697
- Reserves months
- —
- Total cash needed
- —
Loan-product check · same deal, 3 products live
Conventional
25% down · 7.5% · 30yr
- Down + closing
- —
- Monthly P&I
- —
- Monthly cashflow
- —
- DSCR
- —
- Eligible?
- —
Personal DTI + credit; lowest rate.
DSCR
20% down · 8.5% · 30yr
- Down + closing
- —
- Monthly P&I
- —
- Monthly cashflow
- —
- DSCR
- —
- Eligible?
- —
No personal income docs; deal must DSCR.
Hard money
10% down · 12.0% · 12mo
- Down + closing
- —
- Monthly P&I
- —
- Monthly cashflow
- —
- DSCR
- —
- Eligible?
- —
Short-term bridge; refi at stabilization.
Rent comps 40 comps
| Address | Beds | Baths | Sqft | Rent | $/sqft | DOM | Units | Dist |
|---|---|---|---|---|---|---|---|---|
| 1497 Krin Ct NE Palm Bay, FL | 3.0 | 2.0 | 1712 | $2,400 | $1.40 | 21d | 1 | 0.24mi |
| 3513 Tree Ridge Ln NE Palm Bay, FL | 2.0 | 2.5 | 1170 | $2,000 | $1.71 | 23d | 1 | 0.25mi |
| 3814 Tree Ridge Ln NE Palm Bay, FL | 2.0 | 2.5 | 1170 | $1,500 | $1.28 | 23d | 1 | 0.30mi |
| 917 Castleford Ave NE Palm Bay, FL | 3.0 | 2.0 | 1604 | $2,150 | $1.34 | 23d | 1 | 0.32mi |
| 1701 Forest Knoll Dr NE Palm Bay, FL | 2.0–3.0 | 2.0 | 1200 | $2,050 | $1.71 | 14d | 5 | 0.33mi |
| 1608 Sunny Brook Ln Palm Bay, FL | 1.0–3.0 | 1.0–2.0 | 1040 | $1,600 | $1.54 | 23d | 6 | 0.34mi |
| 1327 Cherry Hills Rd NE Palm Bay, FL | 3.0 | 2.0 | 1706 | $2,800 | $1.64 | 14d | 1 | 0.36mi |
| 1625 Par St NE Unit 1206 Palm Bay, FL | 3.0 | 2.0 | 1208 | $2,050 | $1.70 | 23d | 1 | 0.37mi |
| 1625 Par St NE Unit 1207 Palm Bay, FL | 3.0 | 2.0 | 1208 | $2,025 | $1.68 | 23d | 1 | 0.37mi |
| 2130 Forest Knoll Dr NE #202 Palm Bay, FL | 2.0 | 2.0 | 1069 | $1,450 | $1.36 | 23d | 1 | 0.38mi |
| 2100 Forest Knoll Dr NE #202 Palm Bay, FL | 2.0 | 2.0 | 1069 | $1,600 | $1.50 | 14d | 1 | 0.39mi |
| 1605 Par St NE Unit 3202 Palm Bay, FL | 3.0 | 2.0 | 1208 | $2,300 | $1.90 | 23d | 1 | 0.39mi |
| 1605 Par St NE Unit 3204 Palm Bay, FL | 3.0 | 2.0 | 1208 | $2,000 | $1.66 | 23d | 1 | 0.39mi |
| 1625 Par St NE Unit 1203 Palm Bay, FL | 3.0 | 2.0 | 1208 | $2,075 | $1.72 | 23d | 1 | 0.40mi |
| 1625 Par St NE Unit 1205 Palm Bay, FL | 3.0 | 2.0 | 1208 | $2,300 | $1.90 | 23d | 1 | 0.40mi |
| 1635 Par St NE Unit 2203 Palm Bay, FL | 3.0 | 2.0 | 1208 | $2,300 | $1.90 | 23d | 1 | 0.41mi |
| 2160 Forest Knoll Dr NE Unit 60-102 Palm Bay, FL | 2.0 | 2.0 | 1069 | $1,350 | $1.26 | 23d | 1 | 0.42mi |
| 1264 Dawn St NE Palm Bay, FL | 3.0 | 2.0 | 1176 | $1,950 | $1.66 | 14d | 1 | 0.42mi |
| 2190 Forest Knoll Dr NE Unit 90-202 Palm Bay, FL | 2.0 | 2.0 | 1069 | $1,400 | $1.31 | 23d | 1 | 0.43mi |
| 1265 Ethel Cir NE Palm Bay, FL | 3.0 | 2.0 | 1346 | $1,750 | $1.30 | 14d | 1 | 0.51mi |
| 1231 Mariposa Dr NE Palm Bay, FL | 4.0 | 2.0 | 1650 | $2,150 | $1.30 | 23d | 1 | 0.67mi |
| 997 Mariposa Dr NE Palm Bay, FL | 2.0 | 2.0 | 1722 | $1,800 | $1.05 | 23d | 1 | 0.68mi |
| 1000 Palm Place Dr NE Palm Bay, FL | 1.0–2.0 | 1.0–2.0 | 884 | $2,185 | $2.47 | 21d | 8 | 0.72mi |
| 1030 Abada Ct NE #110 Palm Bay, FL | 3.0 | 2.0 | 1163 | $1,800 | $1.55 | 23d | 1 | 0.76mi |
| 1411 Sheafe Ave NE #102 Palm Bay, FL | 2.0 | 1.0 | 1156 | $1,550 | $1.34 | 23d | 1 | 0.76mi |
| 1099 Dania Cir NE Palm Bay, FL | 3.0 | 2.0 | 1314 | $2,300 | $1.75 | 23d | 1 | 0.77mi |
| 1431 Sheafe Ave NE #104 Palm Bay, FL | 3.0 | 2.0 | 1163 | $1,500 | $1.29 | 23d | 1 | 0.79mi |
| 1471 Sheafe Ave NE #102 Palm Bay, FL | 3.0 | 2.0 | 1180 | $1,800 | $1.53 | 23d | 1 | 0.83mi |
| 1501 Harvard Cir Melbourne, FL | 1.0–3.0 | 1.0–2.0 | 1075 | $2,000 | $1.86 | 23d | 3 | 0.87mi |
| 1460 Sheafe Ave NE #105 Palm Bay, FL | 3.0 | 2.0 | 1156 | $1,725 | $1.49 | 23d | 1 | 0.88mi |
| 1555 Omega St NE Palm Bay, FL | 2.0 | 2.0 | 1176 | $1,795 | $1.53 | 23d | 1 | 0.89mi |
| 787 Seymour Rd NE Palm Bay, FL | 3.0 | 2.0 | 2020 | $2,250 | $1.11 | 14d | 1 | 0.92mi |
| 4881 Dairy Rd Melbourne, FL | 1.0–2.0 | 1.0–2.0 | 954 | $2,491 | $2.61 | 14d | 12 | 0.92mi |
| 4775 Lake Waterford Way W Unit 2-113 Melbourne, FL | 2.0 | 3.0 | 1915 | $1,850 | $0.97 | 23d | 1 | 0.98mi |
| 1907 Cleveland St NE Palm Bay, FL | 3.0 | 2.0 | 1320 | $1,985 | $1.50 | 23d | 1 | 0.98mi |
| 1495 Malibu Cir NE #102 Palm Bay, FL | 3.0 | 2.0 | 1180 | $1,600 | $1.36 | 14d | 1 | 1.00mi |
| 1425 Malibu Cir NE #111 Palm Bay, FL | 3.0 | 2.0 | 1180 | $1,650 | $1.40 | 23d | 1 | 1.00mi |
| 890 Luminary Cir #103 Melbourne, FL | 3.0 | 2.0 | 1277 | $1,800 | $1.41 | 14d | 1 | 1.02mi |
| 188 Hidden Woods Pl Melbourne, FL | 3.0 | 2.5 | 1648 | $2,100 | $1.27 | 23d | 1 | 1.04mi |
| 100 Larch Cir NE Palm Bay, FL | 1.0–2.0 | 1.0–2.0 | 1013 | $1,775 | $1.75 | 14d | 16 | 1.05mi |
Listing history 8 events
-
2026-06-18days on market $189,900 Active 10 DOM
-
2026-06-17days on market $189,900 Active 9 DOM
-
2026-06-16days on market $189,900 Active 8 DOM
-
2026-06-15days on market $189,900 Active 7 DOM
-
2026-06-14days on market $189,900 Active 5 DOM
-
2026-06-10days on market $189,900 Active 2 DOM
-
2026-06-09remarks 699-char remark
-
2026-06-09$189,900 Active 1 DOM
ⓘ Source: listings_history table (triggers on properties + properties_extension) + one-shot
backfill from property_details.listing_events for pre-trigger history.
Tax reassessment forecast FL · Resets to sale price
- Current annual tax
- $4,499 · $375/mo
- Projected year-2 tax
- $4,499 · $375/mo
- Expected delta
- $0/yr ($0/mo · 0.0%)
ⓘ Screening estimate from a state-policy table — verify with the county assessor before closing.
Climate risk First Street
- Flood 1/10 Low FEMA zone X (unshaded) · 0% chance over 30 yrs
- Wildfire 3/10 Moderate
- Heat 10/10 Extreme 7 d/yr ≥106°F today · 22 d/yr by 30 yrs out
- Wind 10/10 Extreme 99% chance of damaging wind over 30 yrs
- Air quality 1/10 Low 0 unhealthy d/yr today · 0 by 30 yrs out
Nearby sold comps map
Loading sold comps map…
Walkable amenities ~0.75 mi
Loading nearby amenities…
Taxation est. · year 1
- Rental income
- $23,877
- − Mortgage interest
- −$10,637
- − Property taxes
- −$4,499
- − Insurance
- −$950
- − Repairs & maintenance
- −$1,910
- − Management
- −$1,910
- − Depreciation
- −$5,524
- Taxable loss
- −$1,553
- Est. tax savings @ 24.0%
- +$373
- After-tax cash flow
- $1,837/yr
For passive investors: Depreciation is non-cash, so a rental often shows a tax loss while cash-flowing — sheltering income. Rental losses are passive: they offset passive income freely, and up to $25,000/yr can offset ordinary (W-2) income if you actively participate and your MAGI is under $100k (phasing out to $0 by $150k); unused losses carry forward. On sale, claimed depreciation is recaptured at up to 25%, and gains may owe capital-gains tax (a 1031 exchange can defer both). Figures are a year-1 estimate at your 24.0% rate — not tax advice; consult a CPA.
Schools (NCES district)
- District
- Brevard
- NCES district ID
- 1200150
- Math proficiency
- 53% ▼ -9.00%
- Reading proficiency
- 57% ▼ -4.00%
- Median HH income
- $49,426
- Composite
- 46.86/100
- National rank
- #2370
- State rank
- #19 of 73 in FL
Livability — Palm Bay
- Score
- 72/100
- State rank
- #366
- US rank
- #6458
Category grades
Schools grade is shown separately in the Schools card above.
Census & demographics
- Census place
- Palm Bay, FL
- County
- Brevard County · 602,871 people
- City population
- 132,211
- Metro
- Palm Bay-Melbourne-Titusville, FL
- Population (ZIP)
- 24,792
- Household income
- $56,411
- Rent vs Own
- Severe rent burden
- 1962.0
Population outlook (Brevard County) Hauer SSP2
- Today (2025)
- 623,254 people
- By 2030
- 648,420 · +4.0%
- By 2040
- 690,009 · +10.7%
- By 2050
- 715,669 · +14.8%
- By 2075
- 775,744 · +24.5%
- By 2100
- 776,687 · +24.6%
Race, ethnicity, and origin ACS 2023
- Neighborhood character
- Diverse neighborhood (Simpson 0.57)
- Race & ethnicity
- White 61% Hispanic / Latino 16% Black 16% Two or more races 11% Asian 2%
- Hispanic origin (detail)
- Mexican 1% Puerto Rican 4% Cuban 4%
- Common ancestry
- Romanian 2% Hispanic 2% Slovak 2%
- Foreign-born
- 13% · Canada, Jamaica
- Languages at home
- 83% English-only · Spanish 12% French/Haitian/Cajun 2% Other Indo-European 2%
Political lean MEDSL · Brevard
- 2024 margin
- Strong R (+20.8) · D 39.1% · R 59.9% · Other 1.0%
- 2008→2024 swing
- -10.4pp toward R · 2008: -10.4pp · 2024: -20.8pp
- All cycles
- 2024: R+20.8 2020: R+16.4 2016: R+19.8 2012: R+12.7 2008: R+10.4
Not yet ingested
- Civics
- —
Market trends
- HPI YoY
- ▼ -5.59%
- Current HPI
- 309.8748
- Rent YoY
- ▼ -0.52%
- Metro
- Palm Bay-Melbourne-Titusville, FL
- State GDP YoY
- ▲ 3.28%
- F500 in state
- 36
Industry mix (Fortune 500 HQ in FL)
| Industry | F500 HQs | Revenue |
|---|---|---|
| Industrial Technology | 2 | $29B |
|
||
| Insurance | 2 | $17B |
|
||
| Retail | 1 | $60B |
|
||
| Technology Distribution | 1 | $58B |
|
||
| Homebuilding | 1 | $35B |
|
||
| Technology Manufacturing | 1 | $35B |
|
||
Price history
+217.6% since first listed13 events — show timeline
- 2026-06-06 Listed $189,900 SCMLS
- 2026-06-06 Listed $189,900 Beaches MLS
- 2025-07-15 Contingent — SCMLS
- 2025-07-11 Relisted — SCMLS
- 2025-07-02 Pending — SCMLS
- 2025-07-02 Contingent — SCMLS
- 2025-07-02 Listing Removed — SCMLS
- 2025-06-10 Listed $200,000 SCMLS
- 2006-07-14 Sold (MLS) $187,000 SCMLS
- 2006-05-30 Listed $187,000 SCMLS
- 1995-06-01 Sold (Public Records) $80,000 Public Records
- 1989-02-01 Sold (Public Records) $60,500 Public Records
- 1979-12-01 Sold (Public Records) $59,800 Public Records
Property tax history
+19.1%/yrLatest (2025): $4,499 · +607.4% YoY. Source: county tax records.
Cash-flow waterfall
monthlySold comps — $/sqft
last 12 mo · ≤1 miLoading sold comps…