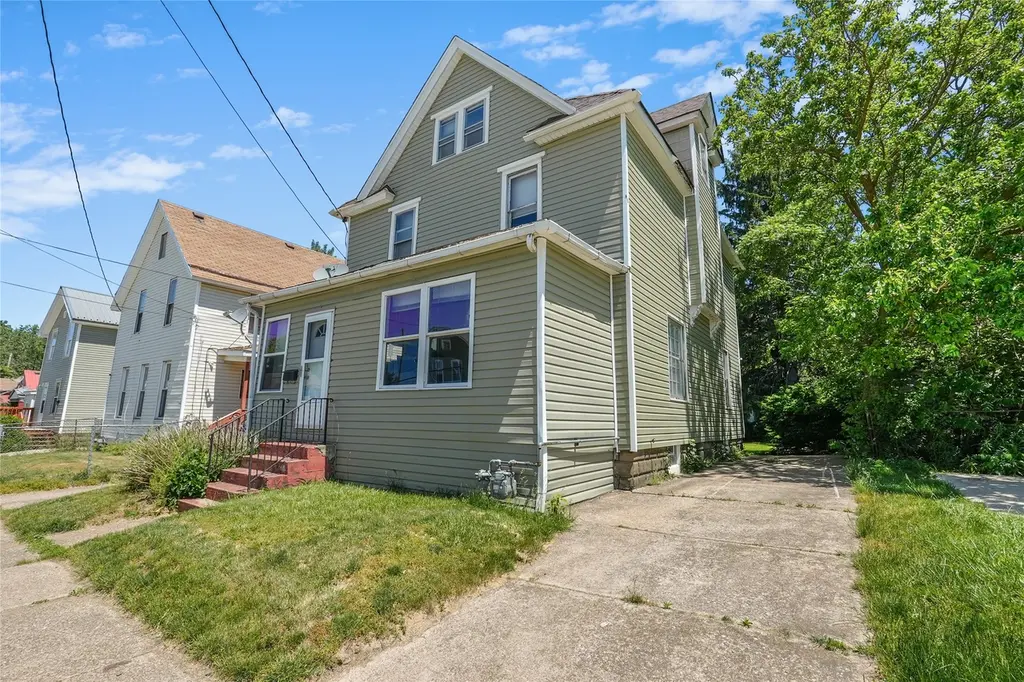
2013 Camphausen Ave · Erie, PA
Flood risk 3/10 · Minor
- FEMA flood zone
- X (unshaded)
- Chance of flooding over 30 yrs
- 0.2%
- Est. flood insurance / yr
- $473 – $860
Fire risk 1/10 · Minimal
- Est. fire insurance / yr
- $511 – $949
Heat risk 3/10 · Minor
- Hot days now (above 90°F)
- 7 days/yr
- Hot days in 30 yrs
- 17 days/yr
Wind risk 1/10 · Minimal
- Chance of severe wind over 30 yrs
- —
Air-quality risk 4/10 · Minor
- Unhealthy air days now
- 3 days/yr
- Unhealthy air days in 30 yrs
- 7 days/yr
Risk factors via First Street. Map © Google.
Why this score? — see what drove the B- grade
The composite is a weighted blend of 9 inputs, each scored 0–100. Each bar is that input's sub-score; the figure is the points it added to the 100-point composite (weight × sub-score).
- Cash flow +25.6/30.0
- ARV discount +15.0/15.0
- DSCR +8.5/10.0
- 1% rule +6.8/10.0
- Livability +4.2/5.0
- Rent growth +2.5/5.0
- Condition / age +2.5/5.0
- Schools +1.3/10.0
- Appreciation +0.0/10.0
$84,900
🖨 Deal sheet 📄 Offer letter ✓ Due diligence
Listing remarks
Big space, southeast Erie location, and room to make it your own! This 4-bedroom, 2-story home at 2013 Camphausen Avenue offers more square footage than you'd expect at this price point, with a newer roof, fresh drywall, updated electrical, and brand-new kitchen appliances already in place. The unfinished attic is a blank canvas with potential! Finish it for additional living space, a home office, or a primary suite. The layout works well for families or as a rental investment! Whether you're looking to rent or own, add some few updates and you can make this your own!
Key facts
- Fresh drywall
- Updated electrical
- Newer roof
Tags
Property features AI
Exterior
- Utilities: Public water; Public sewer
- Home design: Single family residence; Two levels; Residential property
- Construction: Vinyl siding; Full unfinished basement
- Exterior features: Asphalt roof
Interior
- Kitchen: Gas oven; Gas range; Refrigerator
- Bedrooms: Total rooms: 9
- Flooring: Carpet; Vinyl
- Bathrooms: 1 full bathroom
- Heating & cooling: Forced air heating; Ceiling fan(s); No central air
- Interior features: Ceiling fans; Window coverings and drapes; Decorative fireplace (1)
Neighborhood map
What this means for you Summary
Snapshot
- This is a 4-bed/1.0-bath single-family listed at $85k.
Deal economics
- At list price, monthly cash flow is $200 ($2k/yr) — positive.
- The deal already cash-flows at list — no discount required.
- Meets the 1% rule at list price ($1k rent vs $85k).
- Cap rate 9.1% vs local median 5.2% in Erie — top-decile yield for the area; either an underpriced asset or a hidden risk that comps aren't pricing in. Stress-test before assuming the spread holds.
Location & tenants
- Location reads 83/100 on livability (#109 in PA, #840 nationally) — a professional / high-income tenant draw. Strengths: amenities A+, commute A+, cost of living A+; Watch: crime D+, employment F.
- Erie City SD (urban): math 12% / reading 19% proficiency, ranked #510 of 539 in PA (top 95%) — low school quality limits family demand, transient renter base, plan for 1-2y turnover; 81% free/reduced lunch — lower-income household profile, screen leases tightly.
- Market conditions: 76 active listings in the ZIP; 1 comparable units currently listed for rent nearby; 364 units permitted in Erie County in 2024 (188 in 5+ unit buildings).
Forward outlook
- Local home prices are declining (-3.0%/yr); year-one equity from $587 of loan paydown is wiped out by about $3k of value loss. Plan a longer hold.
- Erie County population projected at -14% by 2050 — secular population decline; favor cash flow + early exit over multi-decade hold.
Negotiation context
- Only 7 days on market — expect competitive offers; lowballing is unlikely to land.
- Current owner paid $12k; list at $85k implies a 608% gain — meaningful room to come down on a strong offer.
Risks & watch-outs
- Watch-outs: built in 1913 — expect roof / HVAC / electrical / plumbing capex.
Questions for the listing agent
- Built in 1913 — when were the roof, HVAC, electrical panel, plumbing, and water heater last replaced?
- Is there a deadline driving the sale (1031 exchange, divorce, estate, relocation)? That informs how much negotiation room exists.
- Crime grade is D in this area — have there been break-ins, vandalism, or insurance claims at this property in the last 3 years? What carrier currently insures it and at what premium?
- What's the average days-on-market for RENTAL listings here right now (not sales)? A rising rental-DOM trend means longer vacancies and softer asking-rent achievability than the comps imply.
- What's the recent tenant-quality profile in this submarket — average credit score on applications, eviction rate, late-payment / NSF rate, and stable-employment percentage? A property-management company in the area should have these aggregated.
- How much new for-sale + rental construction is in the pipeline within 1–3 miles? Heavy new supply typically softens prices + rents 12–24 months out; constrained supply supports both.
Investment metrics
- 1% rule
- 1.18% ✓
- Cap rate
- 9.12%
- Cash-on-cash
- 10.10%
- DSCR
- 1.45
- GRM
- 7.1
CMA / ARV
- ARV (on-the-fly)
- $148,938
- Comps found
- 12
Show comp detail 12 sales within ~0.75 mi
| Address | Dist | Beds/Ba | Sqft | Sold | Price | $/sf | Match |
|---|---|---|---|---|---|---|---|
| 1316 Buffalo Rd | 0.26mi | 4/1.5 | 1,470 (+2%) | 3mo | $149,900 | $102 | 81 |
| 1743 E 27th St | 0.53mi | 4/2.0 | 1,440 (-0%) | 8mo | $169,900 | $118 | 64 |
| 2931 Burton Ave | 0.72mi | 4/1.5 | 1,440 (-0%) | 6mo | $169,500 | $118 | 59 |
| 1224 E 22nd St | 0.39mi | 3/1.5 (-1) | 1,584 (+10%) | 1mo | $120,000 | $76 | 58 |
| 1038 E 24th St | 0.65mi | 4/1.0 | 1,352 (-6%) | 2mo | $139,900 | $103 | 58 |
| 2020 Linwood Ave | 0.67mi | 4/1.0 | 1,536 (+6%) | 5mo | $151,000 | $98 | 54 |
| 1203 E 29th St | 0.71mi | 3/2.5 (-1) | 1,450 (+0%) | 3mo | $30,000 | $21 | 53 |
| 2102 Buffalo Rd | 0.73mi | 3/1.0 (-1) | 1,411 (-2%) | 10mo | $49,900 | $35 | 48 |
| 1527 Woodlawn Ave | 0.35mi | 3/2.0 (-1) | 1,240 (-14%) | 10mo | $200,000 | $161 | 42 |
| 2007 Prospect Ave | 0.62mi | 4/2.0 | 1,625 (+12%) | 8mo | $132,500 | $82 | 40 |
| 2036 Woodlawn Ave | 0.74mi | 5/2.0 (+1) | 1,344 (-7%) | 6mo | $195,000 | $145 | 40 |
| 1118 E 27th St | 0.67mi | 5/2.0 (+1) | 1,232 (-15%) | 1mo | $155,000 | $126 | 34 |
Match score weights: distance 35% · size 25% · config 20% · recency 20%. Top-matched comps best support the ARV.
Projected returns pro-forma
-3.0% appreciation · 3.0% rent growth · sell at horizon
- IRR
- -1.1%
- Equity multiple
- 0.96×
- Total profit
- $-997
- Equity at exit
- $12,659
- IRR
- 8.6%
- Equity multiple
- 1.66×
- Total profit
- $15,610
- Equity at exit
- $7,341
Cash invested: $23,772 (down + closing). Projections, not guarantees.
Landlord ↔ Tenant lean methodology
- Overall (STATE)
- 62 Landlord-Friendly
- State Pennsylvania
- 62 Landlord-Friendly · EVEN
- County
- — inherits STATE
- City
- — inherits STATE
ZIP-level market 16510
- Home prices YoY
- -33.7%
- Active inventory
- 76
- Price-to-rent
- 7.1×
Monthly cashflow live
- Estimated rent
- $1,000 medium interval (Pro) →
- Mortgage (P&I)
- −$445
- Tax from tax record
- −$109 /mo · $1,312/yr
- Insurance
- −$35
- HOA
- −$0
- Vacancy / Maint / Mgmt
- −$210
- Net cashflow
- $200
Break-even live
UW: 25.0% down · 7.5% · 30yr · 1.5% tax · 5.0% vac · 8.0% maint · 8.0% mgmt
Financing live
Cash to close
- Down payment
- $21,225
- Closing costs
- $2,547
- Reserves months
- —
- Total cash needed
- —
Loan-product check · same deal, 3 products live
Conventional
25% down · 7.5% · 30yr
- Down + closing
- —
- Monthly P&I
- —
- Monthly cashflow
- —
- DSCR
- —
- Eligible?
- —
Personal DTI + credit; lowest rate.
DSCR
20% down · 8.5% · 30yr
- Down + closing
- —
- Monthly P&I
- —
- Monthly cashflow
- —
- DSCR
- —
- Eligible?
- —
No personal income docs; deal must DSCR.
Hard money
10% down · 12.0% · 12mo
- Down + closing
- —
- Monthly P&I
- —
- Monthly cashflow
- —
- DSCR
- —
- Eligible?
- —
Short-term bridge; refi at stabilization.
Rent comps 1 comps
| Address | Beds | Baths | Sqft | Rent | $/sqft | DOM | Units | Dist |
|---|---|---|---|---|---|---|---|---|
| 614 E 22nd St Unit 1 Erie, PA | 3.0 | 1.0 | 1300 | $1,000 | $0.77 | 43d | 1 | 1.15mi |
Listing history 7 events
-
2026-06-15status $84,900 Pending 7 DOM
-
2026-06-15days on market $84,900 Active 7 DOM
-
2026-06-14days on market $84,900 Active 5 DOM
-
2026-06-13days on market $84,900 Active 4 DOM
-
2026-06-10days on market $84,900 Active 2 DOM
-
2026-06-09remarks 574-char remark
-
2026-06-09$84,900 Active 1 DOM
ⓘ Source: listings_history table (triggers on properties + properties_extension) + one-shot
backfill from property_details.listing_events for pre-trigger history.
Tax reassessment forecast PA · Partial reset (capped growth)
- Current annual tax
- $1,312 · $109/mo
- Projected year-2 tax
- $1,327 · $111/mo
- Expected delta
- +$15/yr (+$1/mo · 1.1%)
ⓘ Screening estimate from a state-policy table — verify with the county assessor before closing.
Climate risk First Street
- Flood 3/10 Moderate FEMA zone X (unshaded) · 20% chance over 30 yrs
- Wildfire 1/10 Low
- Heat 3/10 Moderate 7 d/yr ≥90°F today · 17 d/yr by 30 yrs out
- Wind 1/10 Low
- Air quality 4/10 Moderate 3 unhealthy d/yr today · 7 by 30 yrs out
Nearby sold comps map
Loading sold comps map…
Walkable amenities ~0.75 mi
Loading nearby amenities…
Taxation est. · year 1
- Rental income
- $12,000
- − Mortgage interest
- −$4,756
- − Property taxes
- −$1,312
- − Insurance
- −$424
- − Repairs & maintenance
- −$960
- − Management
- −$960
- − Depreciation
- −$2,470
- Taxable income
- $1,118
- Est. tax owed @ 24.0%
- −$268
- After-tax cash flow
- $2,133/yr
For passive investors: Depreciation is non-cash, so a rental often shows a tax loss while cash-flowing — sheltering income. Rental losses are passive: they offset passive income freely, and up to $25,000/yr can offset ordinary (W-2) income if you actively participate and your MAGI is under $100k (phasing out to $0 by $150k); unused losses carry forward. On sale, claimed depreciation is recaptured at up to 25%, and gains may owe capital-gains tax (a 1031 exchange can defer both). Figures are a year-1 estimate at your 24.0% rate — not tax advice; consult a CPA.
Schools (NCES district)
- District
- Erie City SD
- NCES district ID
- 4209300
- Math proficiency
- 12% ▼ -11.00%
- Reading proficiency
- 19% ▼ -16.00%
- Median HH income
- $33,625
- Composite
- 12.59/100
- National rank
- #9617
- State rank
- #510 of 539 in PA
Livability — Erie
- Score
- 83/100
- State rank
- #109
- US rank
- #840
Category grades
Schools grade is shown separately in the Schools card above.
Census & demographics
- Census place
- Erie, PA
- City population
- 92,215
- Population (ZIP)
- 25,152
Population outlook (Erie County) Hauer SSP2
- Today (2025)
- 272,159 people
- By 2030
- 266,299 · -2.2%
- By 2040
- 250,987 · -7.8%
- By 2050
- 234,925 · -13.7%
- By 2075
- 199,164 · -26.8%
- By 2100
- 162,985 · -40.1%
Race, ethnicity, and origin ACS 2023
- Neighborhood character
- Predominantly White (80%)
- Race & ethnicity
- White 80% Hispanic / Latino 6% Black 6% Asian 4% Two or more races 4%
- Hispanic origin (detail)
- Mexican 1% Puerto Rican 4%
- Common ancestry
- Romanian 12% Subsaharan African 2% Lithuanian 2%
- Foreign-born
- 8% · Vietnam, India, Canada
- Languages at home
- 88% English-only · Arabic 3% Spanish 3% Other Indo-European 2%
Political lean MEDSL · Erie
- 2024 margin
- Toss-up / Even · D 49.0% · R 50.0%
- 2008→2024 swing
- -20.9pp toward R · 2008: 19.9pp · 2024: -1.0pp
- All cycles
- 2024: R+1.0 2020: D+1.0 2016: R+2.0 2012: D+16.9 2008: D+19.9
Not yet ingested
- Civics
- —
Market trends
- HPI YoY
- ▼ -122.36%
- Current HPI
- 240.7222
- Rent YoY
- —
- Metro
- —
- State GDP YoY
- ▲ 1.68%
- F500 in state
- 34
Industry mix (Fortune 500 HQ in PA)
| Industry | F500 HQs | Revenue |
|---|---|---|
| Healthcare | 2 | $309B |
|
||
| Insurance | 2 | $27B |
|
||
| Telecommunications / Media | 1 | $124B |
|
||
| Industrial Distribution | 1 | $22B |
|
||
| Financial Services | 1 | $20B |
|
||
| Chemicals / Materials | 1 | $18B |
|
||
Price history
+607.5% since first listed2 events — show timeline
- 2026-06-08 Listed $84,900 GEBOR
- 1974-07-15 Sold (Public Records) $12,000 Public Records
Property tax history
+1.9%/yrLatest (2026): $1,312 · +3.4% YoY. Source: county tax records.
Cash-flow waterfall
monthlySold comps — $/sqft
last 12 mo · ≤1 miLoading sold comps…