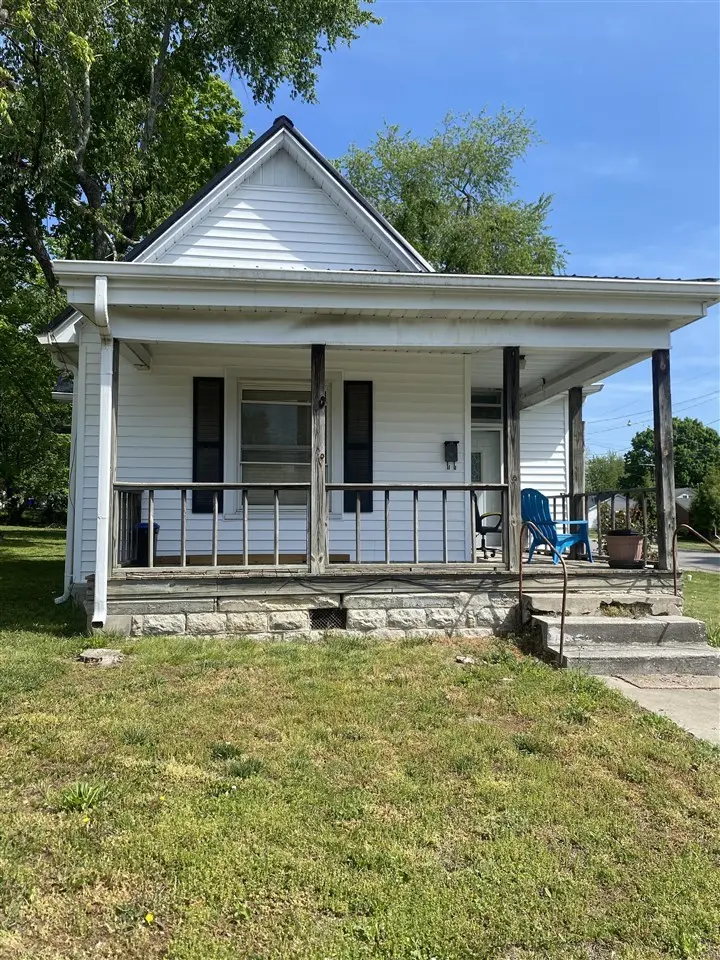
300 Montague St · Franklin, KY
Flood risk 1/10 · Minimal
- FEMA flood zone
- X (unshaded)
- Chance of flooding over 30 yrs
- 0.0%
- Est. flood insurance / yr
- $507 – $1,088
Fire risk 1/10 · Minimal
- Est. fire insurance / yr
- $839 – $1,559
Heat risk 5/10 · Moderate
- Hot days now (above 106°F)
- 7 days/yr
- Hot days in 30 yrs
- 20 days/yr
Wind risk 3/10 · Minor
- Chance of severe wind over 30 yrs
- 6.0%
Air-quality risk 2/10 · Minimal
- Unhealthy air days now
- 0 days/yr
- Unhealthy air days in 30 yrs
- 1 days/yr
Risk factors via First Street. Map © Google.
Why this score? — see what drove the C grade
The composite is a weighted blend of 9 inputs, each scored 0–100. Each bar is that input's sub-score; the figure is the points it added to the 100-point composite (weight × sub-score).
- Cash flow +20.9/30.0
- ARV discount +15.0/15.0
- DSCR +6.6/10.0
- 1% rule +4.4/10.0
- Livability +3.2/5.0
- Schools +2.9/10.0
- Rent growth +2.5/5.0
- Condition / age +2.5/5.0
- Appreciation +0.0/10.0
$159,900
🖨 Deal sheet 📄 Offer letter ✓ Due diligence
Listing remarks
Welcome home to this charming 3-bedroom, 1,400+ sq ft home full of character and cozy appeal! Featuring all new siding and a durable metal roof, this property offers both comfort and peace of mind. Inside, you’ll find a spacious living room, kitchen/dining combo perfect for gathering, and a dedicated office space ideal for working from home or extra flexibility. Enjoy relaxing mornings and evenings on the covered front and back porches. Conveniently located just minutes from downtown Franklin, KY, this home combines small-town charm with everyday convenience. Don’t miss your chance to make it yours!
Key facts
- 4,356 sq ft lot
- Built 1920
- Listed 41 days
Property features AI
Exterior
- Parking: Gravel parking
- Security: Smoke detector(s)
- Utilities: Public water; Public sewer
- Home design: Single-family residence; Residential property
- Construction: Vinyl siding; Metal roof
- Exterior features: Garden; Corner lot; Shed(s)
Interior
- Kitchen: Dishwasher; Microwave; Electric range
- Bathrooms: 1 full bathroom (main level)
- Heating & cooling: Central heating; Natural gas heat
- Interior features: Eat-in kitchen; Covered porch
- Laundry & utility: Laundry room; Electric water heater
Neighborhood map
What this means for you Summary
Snapshot
- This is a 3-bed/1.0-bath single-family listed at $160k.
Deal economics
- At list price, monthly cash flow is $222 ($3k/yr) — positive.
- The deal already cash-flows at list — no discount required.
- To meet the 1% rule (rent ≥ 1% of price), the offer needs to be $151k (5.9% below list).
- Recommended offer: $151k (5.9% below list) — sets the bar for 1% rule.
- Cap rate 8.0% vs local median 3.9% in Franklin — top-decile yield for the area; either an underpriced asset or a hidden risk that comps aren't pricing in. Stress-test before assuming the spread holds.
Location & tenants
- Location reads 65/100 on livability (#266 in KY) — a middle-class / working-renter tenant base. Strengths: cost of living A+, housing A+, crime A; Watch: amenities F, commute F, employment F.
- Simpson County (town): math 29% / reading 39% proficiency, ranked #72 of 165 in KY (top 44%) — families likely to look elsewhere, expect single-tenant / working-renter base with shorter leases.
- Zoned schools: Franklin Elementary School (337 students, 65% FRL); Franklin-Simpson Middle School (math 29% / reading 39%, grade F, #103 of 217 statewide, top 48%, 687 students, 69% FRL); Franklin-Simpson High School (math 27% / reading 42%, grade F, #76 of 254 statewide, top 34%, 817 students, 63% FRL).
- Market conditions: 255 active listings in the ZIP; 17 comparable units currently listed for rent nearby; rentals at typical pace (median 21d on market — plan ~3-4 weeks tenant-placement turnaround); 41% of comp listings sitting > 30 days — soft ceiling on asking rent; 204 units permitted in Simpson County in 2024 (31 in 5+ unit buildings).
- This rent runs 31% of the median local income ($59k/yr) — at the standard rent-burdened threshold; future hikes will face affordability resistance.
Forward outlook
- Local home prices are declining (-3.0%/yr); year-one equity from $1k of loan paydown is wiped out by about $5k of value loss. Plan a longer hold.
- Simpson County population projected at +12% by 2050 — modest demand growth; plan on rents tracking national, not racing it.
Negotiation context
- It's been on market 42 days — a 3% lower offer ($155k) is reasonable based on typical stale-listing flexibility.
Risks & watch-outs
- Watch-outs: built in 1920 — expect roof / HVAC / electrical / plumbing capex.
- Climate carrying-cost: extreme-heat days projected 7→20/yr by 2055 (HVAC capex compounding) — expect insurance premiums to compound above CPI over the hold.
Questions for the listing agent
- It's been on market 42 days. Have you received any prior offers? Is the seller open to a 6% concession, seller financing, or rate buy-down credit?
- Built in 1920 — when were the roof, HVAC, electrical panel, plumbing, and water heater last replaced?
- Is there a deadline driving the sale (1031 exchange, divorce, estate, relocation)? That informs how much negotiation room exists.
- Schools are F-rated, which usually means shorter tenancies and higher turnover. Who's the typical renter profile here, and what's been the actual vacancy rate?
- What's the average days-on-market for RENTAL listings here right now (not sales)? A rising rental-DOM trend means longer vacancies and softer asking-rent achievability than the comps imply.
- What's the recent tenant-quality profile in this submarket — average credit score on applications, eviction rate, late-payment / NSF rate, and stable-employment percentage? A property-management company in the area should have these aggregated.
- How much new for-sale + rental construction is in the pipeline within 1–3 miles? Heavy new supply typically softens prices + rents 12–24 months out; constrained supply supports both.
Investment metrics
- 1% rule
- 0.94% ✗
- Cap rate
- 7.96%
- Cash-on-cash
- 5.94%
- DSCR
- 1.26
- GRM
- 8.9
CMA / ARV
- ARV (median comp)
- $194,079
- List price
- $159,900
- Delta
- -17.61%
- Verdict
- UNDERPRICED
- Comps
- 20 within 1.0 mi
Show comp detail 12 sales within ~0.75 mi
| Address | Dist | Beds/Ba | Sqft | Sold | Price | $/sf | Match |
|---|---|---|---|---|---|---|---|
| 301 N College St | 0.36mi | 2/1.0 (-1) | 1,542 (+9%) | 0mo | $239,250 | $155 | 63 |
| 316 W Cedar St | 0.24mi | 3/1.5 | 1,520 (+7%) | 14mo | $245,000 | $161 | 63 |
| 512 Bell St | 0.55mi | 3/1.0 | 1,313 (-8%) | 1mo | $175,000 | $133 | 61 |
| 307 E Washington St | 0.50mi | 3/1.0 | 1,391 (-2%) | 19mo | $199,900 | $144 | 57 |
| 311 Cardinal Dr | 0.43mi | 3/2.0 | 1,446 (+2%) | 20mo | $215,000 | $149 | 57 |
| 604 Wittland Dr | 0.72mi | 3/2.0 | 1,459 (+3%) | 4mo | $175,000 | $120 | 55 |
| 401 W Washington St | 0.37mi | 2/2.0 (-1) | 1,318 (-7%) | 10mo | $222,000 | $168 | 53 |
| 504 Fairbrook St | 0.58mi | 3/2.0 | 1,296 (-9%) | 10mo | $195,000 | $150 | 46 |
| 405 West St | 0.67mi | 3/2.0 | 1,517 (+7%) | 12mo | $229,900 | $152 | 43 |
| 501 Thomas Dr | 0.64mi | 4/2.5 (+1) | 1,450 (+2%) | 15mo | $244,000 | $168 | 43 |
| 424 Morris St | 0.63mi | 2/1.0 (-1) | 1,282 (-10%) | 11mo | $103,500 | $81 | 40 |
| 629 Jackson St | 0.67mi | 3/2.5 | 1,536 (+8%) | 12mo | $211,000 | $137 | 39 |
Match score weights: distance 35% · size 25% · config 20% · recency 20%. Top-matched comps best support the ARV.
Projected returns pro-forma
-3.0% appreciation · 3.0% rent growth · sell at horizon
- IRR
- -7.2%
- Equity multiple
- 0.74×
- Total profit
- $-11,853
- Equity at exit
- $23,842
- IRR
- 2.4%
- Equity multiple
- 1.17×
- Total profit
- $7,608
- Equity at exit
- $13,825
Cash invested: $44,772 (down + closing). Projections, not guarantees.
Landlord ↔ Tenant lean methodology
- Overall (STATE)
- 83 Strongly Landlord-Friendly
- State Kentucky
- 83 Strongly Landlord-Friendly · R+16
- County
- — inherits STATE
- City
- — inherits STATE
ZIP-level market 42134
- Home prices YoY
- -27.7%
- Active inventory
- 255
- Price-to-rent
- 8.9×
Monthly cashflow live
- Estimated rent
- $1,505 high interval (Pro) →
- Mortgage (P&I)
- −$839
- Tax from tax record
- −$62 /mo · $746/yr
- Insurance
- −$67
- HOA
- −$0
- Vacancy / Maint / Mgmt
- −$316
- Net cashflow
- $222
Break-even live
UW: 25.0% down · 7.5% · 30yr · 1.5% tax · 5.0% vac · 8.0% maint · 8.0% mgmt
Financing live
Cash to close
- Down payment
- $39,975
- Closing costs
- $4,797
- Reserves months
- —
- Total cash needed
- —
Loan-product check · same deal, 3 products live
Conventional
25% down · 7.5% · 30yr
- Down + closing
- —
- Monthly P&I
- —
- Monthly cashflow
- —
- DSCR
- —
- Eligible?
- —
Personal DTI + credit; lowest rate.
DSCR
20% down · 8.5% · 30yr
- Down + closing
- —
- Monthly P&I
- —
- Monthly cashflow
- —
- DSCR
- —
- Eligible?
- —
No personal income docs; deal must DSCR.
Hard money
10% down · 12.0% · 12mo
- Down + closing
- —
- Monthly P&I
- —
- Monthly cashflow
- —
- DSCR
- —
- Eligible?
- —
Short-term bridge; refi at stabilization.
Rent comps 17 comps
| Address | Beds | Baths | Sqft | Rent | $/sqft | DOM | Units | Dist |
|---|---|---|---|---|---|---|---|---|
| 813 W Madison St Franklin, KY | 1.0–2.0 | 1.0–2.0 | 788 | $1,195 | $1.52 | 2d | 7 | 0.53mi |
| 413 E Madison St Franklin, KY | 2.0 | 1.0 | 1000 | $1,300 | $1.30 | 44d | 1 | 0.54mi |
| 205 Walker St Apt B Franklin, KY | 3.0 | 2.5 | 1150 | $1,750 | $1.52 | 44d | 1 | 0.56mi |
| 845 W Madison St Unit 20 Franklin, KY | 2.0 | 1.0 | 900 | $999 | $1.11 | 21d | 1 | 0.65mi |
| 845 W Madison St Franklin, KY | 1.0–2.0 | 1.0 | 900 | $999 | $1.11 | 12d | 4 | 0.65mi |
| 811 Witt Rd Franklin, KY | 3.0 | 2.0 | 1550 | $2,195 | $1.42 | 21d | 1 | 0.83mi |
| 965 W Madison St Apt C2 Franklin, KY | 2.0 | 2.0 | 1070 | $1,025 | $0.96 | 21d | 1 | 0.87mi |
| 317 Sunset Cir Franklin, KY | 4.0 | 1.5 | 1124 | $1,600 | $1.42 | 21d | 1 | 0.87mi |
| 411 Fairview Ave Apt C Franklin, KY | 3.0 | 1.5 | 1450 | $1,250 | $0.86 | 23d | 1 | 0.94mi |
| 1248 Derek Dr Franklin, KY | 3.0 | 2.0 | 1200 | $1,650 | $1.38 | 13d | 1 | 0.94mi |
| 1248 Derek Dr Franklin, KY | 3.0 | 2.0 | 1200 | $1,650 | $1.38 | 21d | 1 | 0.94mi |
| 1500 Easton St Unit 15106 Franklin, KY | 2.0 | 1.5 | 1220 | $1,395 | $1.14 | 13d | 1 | 1.06mi |
| 1030 Brookview Dr Unit 21C Franklin, KY | 2.0 | 1.0 | 976 | $950 | $0.97 | 44d | 1 | 1.18mi |
| 1107 Andover Dr Franklin, KY | 4.0 | 2.0 | 1712 | $2,099 | $1.23 | 44d | 1 | 1.19mi |
| 834 N Main St Unit 28 Franklin, KY | 3.0 | 2.0 | 1000 | $1,195 | $1.20 | 44d | 1 | 1.25mi |
| 834 N Main St Unit 40 Franklin, KY | 3.0 | 2.0 | 1280 | $1,295 | $1.01 | 44d | 1 | 1.25mi |
| 834 N Main St Unit 27 Franklin, KY | 2.0 | 1.0 | 980 | $1,000 | $1.02 | 44d | 1 | 1.26mi |
Listing history 17 events
-
2026-06-19days on market $159,900 Active 42 DOM
-
2026-06-18days on market $159,900 Active 41 DOM
-
2026-06-17days on market $159,900 Active 40 DOM
-
2026-06-16days on market $159,900 Active 39 DOM
-
2026-06-15days on market $159,900 Active 38 DOM
-
2026-06-14days on market $159,900 Active 36 DOM
-
2026-06-13days on market $159,900 Active 35 DOM
-
2026-06-10days on market $159,900 Active 33 DOM
-
2026-06-09days on market $159,900 Active 32 DOM
-
2026-06-08days on market $159,900 Active 31 DOM
-
2026-06-07days on market $159,900 Active 30 DOM
-
2026-06-03days on market $159,900 Active 26 DOM
-
2026-06-02days on market $159,900 Active 25 DOM
-
2026-06-01days on market $159,900 Active 24 DOM
-
2026-05-31days on market $159,900 Active 23 DOM
-
2026-05-30days on market $159,900 Active 22 DOM
-
2026-05-08$159,900 Active 618-char remark
ⓘ Source: listings_history table (triggers on properties + properties_extension) + one-shot
backfill from property_details.listing_events for pre-trigger history.
Tax reassessment forecast KY · Resets to sale price
- Current annual tax
- $746 · $62/mo
- Projected year-2 tax
- $1,375 · $115/mo
- Expected delta
- +$629/yr (+$52/mo · 84.4%)
ⓘ Screening estimate from a state-policy table — verify with the county assessor before closing.
Climate risk First Street
- Flood 1/10 Low FEMA zone X (unshaded) · 0% chance over 30 yrs
- Wildfire 1/10 Low
- Heat 5/10 Major 7 d/yr ≥106°F today · 20 d/yr by 30 yrs out
- Wind 3/10 Moderate 6% chance of damaging wind over 30 yrs
- Air quality 2/10 Low 0 unhealthy d/yr today · 1 by 30 yrs out
Nearby sold comps map
Loading sold comps map…
Walkable amenities ~0.75 mi
Loading nearby amenities…
Taxation est. · year 1
- Rental income
- $18,061
- − Mortgage interest
- −$8,957
- − Property taxes
- −$746
- − Insurance
- −$800
- − Repairs & maintenance
- −$1,445
- − Management
- −$1,445
- − Depreciation
- −$4,652
- Taxable income
- $17
- Est. tax owed @ 24.0%
- −$4
- After-tax cash flow
- $2,656/yr
For passive investors: Depreciation is non-cash, so a rental often shows a tax loss while cash-flowing — sheltering income. Rental losses are passive: they offset passive income freely, and up to $25,000/yr can offset ordinary (W-2) income if you actively participate and your MAGI is under $100k (phasing out to $0 by $150k); unused losses carry forward. On sale, claimed depreciation is recaptured at up to 25%, and gains may owe capital-gains tax (a 1031 exchange can defer both). Figures are a year-1 estimate at your 24.0% rate — not tax advice; consult a CPA.
Schools (NCES district)
- District
- Simpson County
- NCES district ID
- 2105400
- Math proficiency
- 29% ▼ -18.00%
- Reading proficiency
- 39% ▼ -16.00%
- Median HH income
- $41,691
- Composite
- 28.69/100
- National rank
- #6692
- State rank
- #72 of 165 in KY
Livability — Franklin
- Score
- 65/100
- State rank
- #266
- US rank
- #13010
Category grades
Schools grade is shown separately in the Schools card above.
Census & demographics
- Census place
- Franklin, KY
- County
- Simpson County · 19,380 people
- City population
- 19,380
- Metro
- nan
- Population (ZIP)
- 19,380
- Household income
- $59,113
- Rent vs Own
- Severe rent burden
- 576.0
Population outlook (Simpson County) Hauer SSP2
- Today (2025)
- 19,331 people
- By 2030
- 19,921 · +3.1%
- By 2040
- 20,975 · +8.5%
- By 2050
- 21,736 · +12.4%
- By 2075
- 23,536 · +21.8%
- By 2100
- 23,054 · +19.3%
Race, ethnicity, and origin ACS 2023
- Neighborhood character
- Predominantly White (85%)
- Race & ethnicity
- White 85% Black 7% Two or more races 6% Hispanic / Latino 3%
- Common ancestry
- Slovak 4% Italian 1% Lithuanian 1%
- Foreign-born
- 1% · Canada
- Languages at home
- 98% English-only · Spanish 1%
Political lean MEDSL · Simpson
- 2024 margin
- Solid R (+43.9) · D 27.4% · R 71.2% · Other 1.4%
- 2008→2024 swing
- -21.1pp toward R · 2008: -22.7pp · 2024: -43.9pp
- All cycles
- 2024: R+43.9 2020: R+36.7 2016: R+39.0 2012: R+24.1 2008: R+22.7
Not yet ingested
- Civics
- —
Market trends
- HPI YoY
- ▼ -84.92%
- Current HPI
- 221.6725
- Rent YoY
- —
- Metro
- nan
- State GDP YoY
- ▲ 1.81%
- F500 in state
- 4
Industry mix (Fortune 500 HQ in KY)
| Industry | F500 HQs | Revenue |
|---|---|---|
| Healthcare | 1 | $118B |
|
||
| Food / Beverage | 1 | $7B |
|
||
Price history
1 event — show timeline
- 2026-05-08 Listed $159,900 RASKMLS
Property tax history
+3.0%/yrLatest (2025): $746 · -0.8% YoY. Source: county tax records.
Cash-flow waterfall
monthlySold comps — $/sqft
last 12 mo · ≤1 miLoading sold comps…