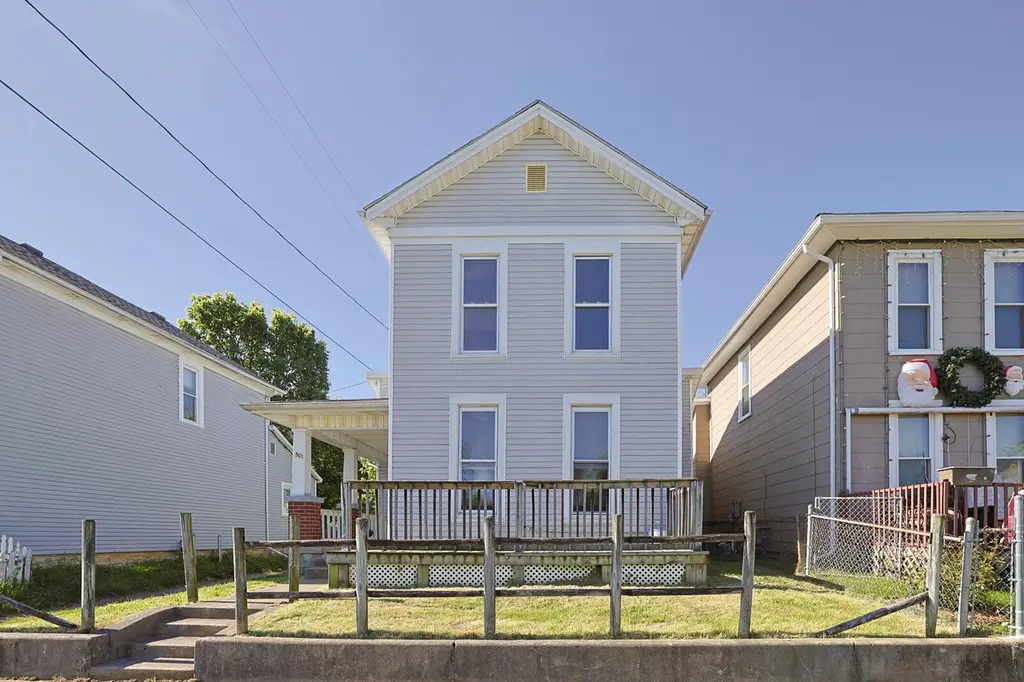
501 E Southern Ave · Springfield, OH
Flood risk 4/10 · Minor
- FEMA flood zone
- X (unshaded)
- Chance of flooding over 30 yrs
- 0.22%
- Est. flood insurance / yr
- $473 – $860
Fire risk 1/10 · Minimal
- Est. fire insurance / yr
- $713 – $1,323
Heat risk 3/10 · Minor
- Hot days now (above 100°F)
- 7 days/yr
- Hot days in 30 yrs
- 18 days/yr
Wind risk 2/10 · Minimal
- Chance of severe wind over 30 yrs
- —
Air-quality risk 3/10 · Minor
- Unhealthy air days now
- 2 days/yr
- Unhealthy air days in 30 yrs
- 3 days/yr
Risk factors via First Street. Map © Google.
Why this score? — see what drove the C+ grade
The composite is a weighted blend of 9 inputs, each scored 0–100. Each bar is that input's sub-score; the figure is the points it added to the 100-point composite (weight × sub-score).
- Cash flow +30.0/30.0
- 1% rule +10.0/10.0
- DSCR +10.0/10.0
- Livability +2.8/5.0
- Rent growth +2.5/5.0
- Condition / age +2.5/5.0
- Schools +1.9/10.0
- ARV discount +0.6/15.0
- Appreciation +0.0/10.0
$83,000
🖨 Deal sheet 📄 Offer letter ✓ Due diligence
Listing remarks MLS
Good opportunity on this 3 bedroom, 1 bath 2 story home. B of A prequal required on financed offers or Proof of funds required on all offers. Please allow 2-3 business days for seller response.
Key facts
- Built 1886
- Listed 36 days
Property features AI
Exterior
- Utilities: Public sewer; Natural gas connected; Sewer connected
- Home design: Single family residence; Residential property; House
- Construction: Built in 1886; Wood siding
- Exterior features: Porch; Supplied water
Interior
- Kitchen: Kitchen (15 x 10)
- Bedrooms: Bedroom 1 (13 x 8); Bedroom 2 (15 x 12)
- Flooring: Carpet; Vinyl
- Bathrooms: One full bathroom (8 x 5)
- Heating & cooling: Natural gas heating; Has heating
- Interior features: Seven total rooms; One fireplace
- Laundry & utility: Utility room (15 x 7)
Neighborhood map
What this means for you Summary
Snapshot
- This is a 3-bed/1.0-bath single-family listed at $83k.
Deal economics
- At list price, monthly cash flow is $659 ($8k/yr) — positive.
- The deal already cash-flows at list — no discount required.
- Meets the 1% rule at list price ($2k rent vs $83k).
- Recommended offer: $81k (3.0% below list) — sets the bar for market timing.
- Cap rate 15.8% vs local median 4.8% in Springfield — top-decile yield for the area; either an underpriced asset or a hidden risk that comps aren't pricing in. Stress-test before assuming the spread holds.
Location & tenants
- Location reads 56/100 on livability (#1,108 in OH) — a working-class tenant base; expect higher turnover. Strengths: cost of living A+, housing A+; Watch: crime F, amenities F, commute F.
- Springfield City School District (urban): math 20% / reading 27% proficiency, ranked #616 of 656 in OH (top 94%) — low school quality limits family demand, transient renter base, plan for 1-2y turnover; 75% free/reduced lunch — lower-income household profile, screen leases tightly.
- Market conditions: 158 active listings in the ZIP; 14 comparable units currently listed for rent nearby; rentals at typical pace (median 15d on market — plan ~3-4 weeks tenant-placement turnaround); lower-income renter base — watch delinquency; 232 units permitted in Clark County in 2024 (116 in 5+ unit buildings).
- This rent runs 41% of the median local income ($44k/yr) — at the standard rent-burdened threshold; future hikes will face affordability resistance.
Forward outlook
- Local home prices are declining (-3.0%/yr); year-one equity from $574 of loan paydown is wiped out by about $2k of value loss. Plan a longer hold.
- Clark County population projected at -16% by 2050 — secular population decline; favor cash flow + early exit over multi-decade hold.
- At projected returns (-3.0% appreciation + 3.0% rent growth), your $23k cash investment doubles in ~4 years — after that, you're playing with house money.
Negotiation context
- It's been on market 37 days — a 3% lower offer ($81k) is reasonable based on typical stale-listing flexibility.
- 2 sale attempts since 14y ago with the ask held roughly flat each time — persistent listings suggest the price (not the market) is what's stuck; bring a comps-based counter.
- Current owner paid $2k; list at $83k implies a 3220% gain — meaningful room to come down on a strong offer.
Risks & watch-outs
- Watch-outs: built in 1886 — expect roof / HVAC / electrical / plumbing capex.
Questions for the listing agent
- It's been on market 37 days. Have you received any prior offers? Is the seller open to a 3% concession, seller financing, or rate buy-down credit?
- Built in 1886 — when were the roof, HVAC, electrical panel, plumbing, and water heater last replaced?
- Is there a deadline driving the sale (1031 exchange, divorce, estate, relocation)? That informs how much negotiation room exists.
- Crime grade is F in this area — have there been break-ins, vandalism, or insurance claims at this property in the last 3 years? What carrier currently insures it and at what premium?
- What's the average days-on-market for RENTAL listings here right now (not sales)? A rising rental-DOM trend means longer vacancies and softer asking-rent achievability than the comps imply.
- What's the recent tenant-quality profile in this submarket — average credit score on applications, eviction rate, late-payment / NSF rate, and stable-employment percentage? A property-management company in the area should have these aggregated.
- How much new for-sale + rental construction is in the pipeline within 1–3 miles? Heavy new supply typically softens prices + rents 12–24 months out; constrained supply supports both.
Investment metrics
- 1% rule
- 1.81% ✓
- Cap rate
- 15.82%
- Cash-on-cash
- 34.01%
- DSCR
- 2.51
- GRM
- 4.6
CMA / ARV
- ARV (median comp)
- $71,945
- List price
- $83,000
- Delta
- 15.37%
- Verdict
- OVERPRICED
- Comps
- 20 within 1.0 mi
Show comp detail 12 sales within ~0.75 mi
| Address | Dist | Beds/Ba | Sqft | Sold | Price | $/sf | Match |
|---|---|---|---|---|---|---|---|
| 644 Clifton Ave | 0.45mi | 3/2.0 | 1,420 (+0%) | 7mo | $165,000 | $116 | 69 |
| 1617 Clifton Ave | 0.39mi | 2/1.0 (-1) | 1,368 (-4%) | 4mo | $51,000 | $37 | 68 |
| 1414 Woodward Ave | 0.50mi | 3/1.5 | 1,440 (+2%) | 7mo | $185,000 | $128 | 66 |
| 1159 Selma Rd | 0.46mi | 3/1.0 | 1,519 (+7%) | 5mo | $125,000 | $82 | 63 |
| 305 Catherine St | 0.26mi | 3/1.5 | 1,272 (-10%) | 9mo | $143,000 | $112 | 62 |
| 230 Rice St | 0.16mi | 2/1.0 (-1) | 1,208 (-15%) | 2mo | $40,000 | $33 | 61 |
| 1213 Gable St | 0.69mi | 3/2.0 | 1,430 (+1%) | 3mo | $189,900 | $133 | 60 |
| 1126 Oak St | 0.37mi | 4/1.0 (+1) | 1,596 (+13%) | 2mo | $29,200 | $18 | 55 |
| 1318 Maryland Ave | 0.70mi | 3/1.0 | 1,528 (+8%) | 4mo | $169,000 | $111 | 51 |
| 551 Georgia Ave | 0.40mi | 2/1.0 (-1) | 1,248 (-12%) | 7mo | $37,000 | $30 | 51 |
| 1024 Elder St | 0.45mi | 3/2.0 | 1,242 (-12%) | 4mo | $33,334 | $27 | 51 |
| 513 Homeview Ave | 0.51mi | 2/1.0 (-1) | 1,272 (-10%) | 7mo | $38,000 | $30 | 48 |
Match score weights: distance 35% · size 25% · config 20% · recency 20%. Top-matched comps best support the ARV.
Projected returns pro-forma
-3.0% appreciation · 3.0% rent growth · sell at horizon
- IRR
- 29.4%
- Equity multiple
- 2.23×
- Total profit
- $28,494
- Equity at exit
- $12,376
- IRR
- 36.7%
- Equity multiple
- 4.39×
- Total profit
- $78,804
- Equity at exit
- $7,176
Cash invested: $23,240 (down + closing). Projections, not guarantees.
Landlord ↔ Tenant lean methodology
- Overall (STATE)
- 73 Landlord-Friendly
- State Ohio
- 73 Landlord-Friendly · R+6
- County
- — inherits STATE
- City
- — inherits STATE
ZIP-level market 45505
- Home prices YoY
- -34.3%
- Active inventory
- 158
- Price-to-rent
- 4.6×
Monthly cashflow live
- Estimated rent
- $1,501 high interval (Pro) →
- Mortgage (P&I)
- −$435
- Tax from tax record
- −$58 /mo · $692/yr
- Insurance
- −$35
- HOA
- −$0
- Vacancy / Maint / Mgmt
- −$315
- Net cashflow
- $659
Break-even live
UW: 25.0% down · 7.5% · 30yr · 1.5% tax · 5.0% vac · 8.0% maint · 8.0% mgmt
Financing live
Cash to close
- Down payment
- $20,750
- Closing costs
- $2,490
- Reserves months
- —
- Total cash needed
- —
Loan-product check · same deal, 3 products live
Conventional
25% down · 7.5% · 30yr
- Down + closing
- —
- Monthly P&I
- —
- Monthly cashflow
- —
- DSCR
- —
- Eligible?
- —
Personal DTI + credit; lowest rate.
DSCR
20% down · 8.5% · 30yr
- Down + closing
- —
- Monthly P&I
- —
- Monthly cashflow
- —
- DSCR
- —
- Eligible?
- —
No personal income docs; deal must DSCR.
Hard money
10% down · 12.0% · 12mo
- Down + closing
- —
- Monthly P&I
- —
- Monthly cashflow
- —
- DSCR
- —
- Eligible?
- —
Short-term bridge; refi at stabilization.
Rent comps 14 comps
| Address | Beds | Baths | Sqft | Rent | $/sqft | DOM | Units | Dist |
|---|---|---|---|---|---|---|---|---|
| 421 Catherine St Springfield, OH | 3.0 | 2.0 | 1498 | $1,500 | $1.00 | 43d | 1 | 0.20mi |
| 1306 S Limestone St Springfield, OH | 4.0 | 2.0 | 1452 | $1,695 | $1.17 | 21d | 1 | 0.31mi |
| 18 E Grand Ave Springfield, OH | 4.0 | 2.0 | 1452 | $1,575 | $1.08 | 19d | 1 | 0.38mi |
| 1452 S Wittenberg Ave Springfield, OH | 2.0 | 1.0 | 937 | $1,010 | $1.08 | 1d | 1 | 0.64mi |
| 830 Oak St Unit 830 Springfield, OH | 4.0 | 1.5 | 1400 | $1,250 | $0.89 | 14d | 1 | 0.65mi |
| 401 Section St Springfield, OH | 4.0 | 2.0 | 1612 | $1,850 | $1.15 | 11d | 1 | 0.94mi |
| 545 W Grand Ave Springfield, OH | 4.0 | 2.0 | 1456 | $1,595 | $1.10 | 3d | 1 | 1.01mi |
| 306 S Plum St Springfield, OH | 4.0 | 2.0 | 1352 | $1,700 | $1.26 | 43d | 1 | 1.06mi |
| 524 W Pleasant St Springfield, OH | 4.0 | 2.0 | 1456 | $1,645 | $1.13 | 11d | 1 | 1.10mi |
| 523 W Mulberry St Springfield, OH | 4.0 | 2.0 | 1456 | $1,825 | $1.25 | 11d | 1 | 1.12mi |
| 515 Ludlow Ave Springfield, OH | 3.0 | 1.0 | 1000 | $950 | $0.95 | 43d | 1 | 1.12mi |
| 356 S Yellow Springs St Springfield, OH | 4.0 | 2.0 | 1606 | $1,825 | $1.14 | 11d | 1 | 1.16mi |
| 302 S Yellow Springs St Springfield, OH | 4.0 | 2.0 | 1456 | $1,845 | $1.27 | 11d | 1 | 1.18mi |
| 220 S Yellow Springs St Springfield, OH | 4.0 | 2.0 | 1456 | $1,645 | $1.13 | 23d | 1 | 1.20mi |
Listing history 20 events
-
2026-06-19days on market $83,000 Active 37 DOM
-
2026-06-18days on market $83,000 Active 36 DOM
-
2026-06-17days on market $83,000 Active 35 DOM
-
2026-06-16days on market $83,000 Active 34 DOM
-
2026-06-16price $83,000 Active 33 DOM
-
2026-06-15days on market $85,500 Active 33 DOM
-
2026-06-14days on market $85,500 Active 31 DOM
-
2026-06-12days on market $85,500 Active 30 DOM
-
2026-06-09days on market $85,500 Active 27 DOM
-
2026-06-08days on market $85,500 Active 26 DOM
-
2026-06-07days on market $85,500 Active 25 DOM
-
2026-06-05days on market $85,500 Active 22 DOM
-
2026-06-02days on market $85,500 Active 20 DOM
-
2026-06-01days on market $85,500 Active 19 DOM
-
2026-05-31days on market $85,500 Active 18 DOM
-
2026-05-30days on market $85,500 Active 17 DOM
-
2026-05-13$85,500 Active 657-char remark
-
2012-08-24soldstatus $2,500 193-char remark
Show marketing remark (193 chars)
Good opportunity on this 3 bedroom, 1 bath 2 story home. B of A prequal required on financed offers or Proof of funds required on all offers. Please allow 2-3 business days for seller response.
-
2012-05-24$3,900 193-char remark
Show marketing remark (193 chars)
Good opportunity on this 3 bedroom, 1 bath 2 story home. B of A prequal required on financed offers or Proof of funds required on all offers. Please allow 2-3 business days for seller response.
-
2001-02-21soldstatus $57,000
ⓘ Source: listings_history table (triggers on properties + properties_extension) + one-shot
backfill from property_details.listing_events for pre-trigger history.
Tax reassessment forecast OH · Partial reset (capped growth)
- Current annual tax
- $692 · $58/mo
- Projected year-2 tax
- $993 · $83/mo
- Expected delta
- +$302/yr (+$25/mo · 43.6%)
ⓘ Screening estimate from a state-policy table — verify with the county assessor before closing.
Climate risk First Street
- Flood 4/10 Moderate FEMA zone X (unshaded) · 22% chance over 30 yrs
- Wildfire 1/10 Low
- Heat 3/10 Moderate 7 d/yr ≥100°F today · 18 d/yr by 30 yrs out
- Wind 2/10 Low
- Air quality 3/10 Moderate 2 unhealthy d/yr today · 3 by 30 yrs out
Nearby sold comps map
Loading sold comps map…
Walkable amenities ~0.75 mi
Loading nearby amenities…
Taxation est. · year 1
- Rental income
- $18,017
- − Mortgage interest
- −$4,649
- − Property taxes
- −$692
- − Insurance
- −$415
- − Repairs & maintenance
- −$1,441
- − Management
- −$1,441
- − Depreciation
- −$2,415
- Taxable income
- $6,964
- Est. tax owed @ 24.0%
- −$1,671
- After-tax cash flow
- $6,232/yr
For passive investors: Depreciation is non-cash, so a rental often shows a tax loss while cash-flowing — sheltering income. Rental losses are passive: they offset passive income freely, and up to $25,000/yr can offset ordinary (W-2) income if you actively participate and your MAGI is under $100k (phasing out to $0 by $150k); unused losses carry forward. On sale, claimed depreciation is recaptured at up to 25%, and gains may owe capital-gains tax (a 1031 exchange can defer both). Figures are a year-1 estimate at your 24.0% rate — not tax advice; consult a CPA.
Schools (NCES district)
- District
- Springfield City School District
- NCES district ID
- 3904481
- Math proficiency
- 20% ▼ -16.00%
- Reading proficiency
- 27% ▼ -12.00%
- Median HH income
- $32,541
- Composite
- 19.12/100
- National rank
- #8834
- State rank
- #616 of 656 in OH
Livability — Springfield
- Score
- 56/100
- State rank
- #1108
- US rank
- #22551
Category grades
Schools grade is shown separately in the Schools card above.
Census & demographics
- Census place
- Springfield, OH
- County
- Clark County · 33,261 people
- City population
- 33,261
- Metro
- Springfield, OH
- Population (ZIP)
- 19,826
- Household income
- $43,819
- Rent vs Own
- Severe rent burden
- 950.0
Population outlook (Clark County) Hauer SSP2
- Today (2025)
- 130,703 people
- By 2030
- 126,952 · -2.9%
- By 2040
- 118,344 · -9.5%
- By 2050
- 109,590 · -16.2%
- By 2075
- 89,464 · -31.6%
- By 2100
- 68,810 · -47.4%
Race, ethnicity, and origin ACS 2023
- Neighborhood character
- Predominantly White (75%)
- Race & ethnicity
- White 75% Black 14% Two or more races 7% Hispanic / Latino 4%
- Common ancestry
- Slovak 1% German 1% Iranian 1%
- Foreign-born
- 2% · Canada
- Languages at home
- 96% English-only · Spanish 2% French/Haitian/Cajun 1% German/W. Germanic 1%
Political lean MEDSL · Clark
- 2024 margin
- Strong R (+29.5) · D 34.8% · R 64.3%
- 2008→2024 swing
- -27.0pp toward R · 2008: -2.5pp · 2024: -29.5pp
- All cycles
- 2024: R+29.5 2020: R+23.3 2016: R+19.5 2012: R+1.8 2008: R+2.5
Not yet ingested
- Civics
- —
Market trends
- HPI YoY
- ▼ -135.16%
- Current HPI
- 258.9037
- Rent YoY
- —
- Metro
- Springfield, OH
- State GDP YoY
- ▲ 1.98%
- F500 in state
- 48
Industry mix (Fortune 500 HQ in OH)
| Industry | F500 HQs | Revenue |
|---|---|---|
| Insurance | 3 | $145B |
|
||
| Industrial Machinery | 3 | $49B |
|
||
| Financial Services | 3 | $24B |
|
||
| Consumer Goods | 2 | $93B |
|
||
| Aerospace / Defense | 2 | $47B |
|
||
| Utilities | 2 | $33B |
|
||
Price history
+45.6% since first listed5 events — show timeline
- 2026-06-15 Price Changed $83,000 WRIST
- 2026-05-13 Listed $85,500 WRIST
- 2012-08-24 Sold (MLS) $2,500 WRIST
- 2012-05-24 Listed $3,900 WRIST
- 2001-02-21 Sold (Public Records) $57,000 Public Records
Property tax history
+15.6%/yrLatest (2025): $692 · +107.6% YoY. Source: county tax records.
Cash-flow waterfall
monthlySold comps — $/sqft
last 12 mo · ≤1 miLoading sold comps…