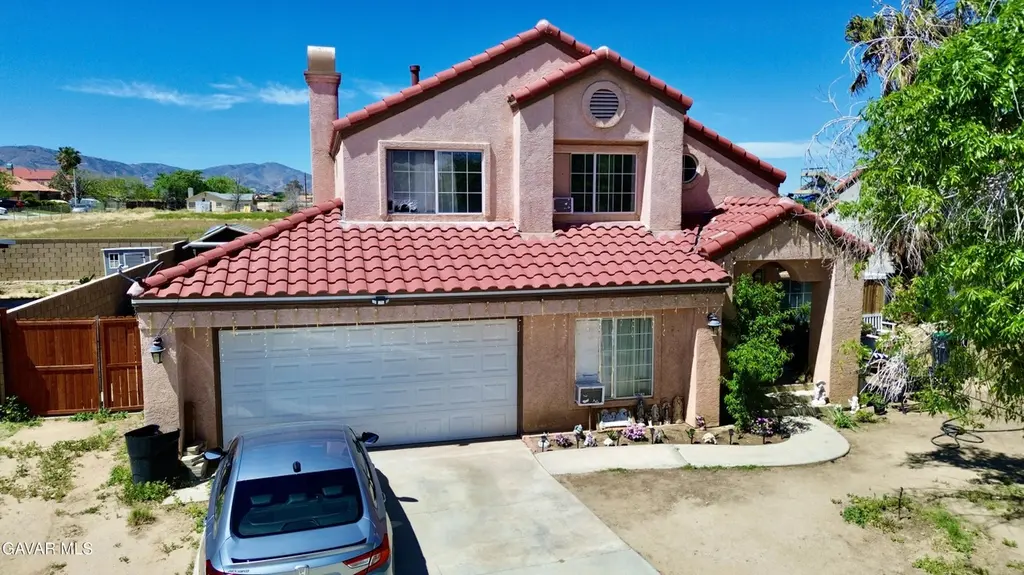
37111 Springfield · Palmdale, CA
Flood risk 6/10 · Moderate
- FEMA flood zone
- X (unshaded)
- Chance of flooding over 30 yrs
- 0.69%
- Est. flood insurance / yr
- $507 – $1,088
Fire risk 8/10 · Major
- Est. fire insurance / yr
- $659 – $1,223
Heat risk 7/10 · Major
- Hot days now (above 99°F)
- 7 days/yr
- Hot days in 30 yrs
- 17 days/yr
Wind risk 1/10 · Minimal
- Chance of severe wind over 30 yrs
- —
Air-quality risk 10/10 · Severe
- Unhealthy air days now
- 25 days/yr
- Unhealthy air days in 30 yrs
- 29 days/yr
Risk factors via First Street. Map © Google.
Why this score? — see what drove the C grade
The composite is a weighted blend of 9 inputs, each scored 0–100. Each bar is that input's sub-score; the figure is the points it added to the 100-point composite (weight × sub-score).
- Cash flow +20.7/30.0
- ARV discount +15.0/15.0
- DSCR +6.6/10.0
- 1% rule +5.5/10.0
- Livability +2.8/5.0
- Rent growth +2.5/5.0
- Schools +2.5/10.0
- Condition / age +2.5/5.0
- Appreciation +0.0/10.0
$300,000
🖨 Deal sheet 📄 Offer letter ✓ Due diligence
Listing remarks MLS
* * Not a short sale or REO - can close in 30 days or less * * Spacious & bright 3 bedroom home in great location. Home features new carpet, new paint, vaulted ceilings in living room and dining area, family room with fireplace, bonus room, and master bedroom with vaulted ceilings.
Key facts
- 6,969 sq ft lot
- 2 garage spots
- Built 1991
Neighborhood map
What this means for you Summary
Snapshot
- This is a 3-bed/2.0-bath single-family listed at $300k.
Deal economics
- At list price, monthly cash flow is $408 ($5k/yr) — positive.
- The deal already cash-flows at list — no discount required.
- Meets the 1% rule at list price ($3k rent vs $300k).
- Cap rate 7.9% vs local median 4.5% in Palmdale — top-decile yield for the area; either an underpriced asset or a hidden risk that comps aren't pricing in. Stress-test before assuming the spread holds.
Location & tenants
- Location reads 55/100 on livability (#861 in CA) — a working-class tenant base; expect higher turnover. Strengths: housing A+; Watch: schools F, crime F, amenities F.
- Palmdale Elementary (suburban): math 20% / reading 31% proficiency, ranked #1,147 of 1,400 in CA (top 82%) — low school quality limits family demand, transient renter base, plan for 1-2y turnover; 69% free/reduced lunch — lower-income household profile, screen leases tightly.
- Market conditions: 128 active listings in the ZIP; 16 comparable units currently listed for rent nearby; rentals leasing fast (median 2d on market — plan ~1-2 weeks tenant-placement turnaround); solid renter incomes; 19,697 units permitted in Los Angeles County in 2024 (9,426 in 5+ unit buildings).
- This rent runs 44% of the median local income ($86k/yr) — at the standard rent-burdened threshold; future hikes will face affordability resistance.
Forward outlook
- Local home prices are declining (-3.0%/yr); year-one equity from $2k of loan paydown is wiped out by about $9k of value loss. Plan a longer hold.
- Los Angeles County population projected at +9% by 2050 — modest demand growth; plan on rents tracking national, not racing it.
Negotiation context
- Only 1 days on market — expect competitive offers; lowballing is unlikely to land.
- 3 sale attempts since 24y ago with the ask held roughly flat each time — persistent listings suggest the price (not the market) is what's stuck; bring a comps-based counter.
- Current owner paid $153k; list at $300k implies a 96% gain — meaningful room to come down on a strong offer.
Risks & watch-outs
- Climate carrying-cost: major flood risk; severe wildfire risk; extreme-heat days projected 7→17/yr by 2055 (HVAC capex compounding) — expect insurance premiums to compound above CPI over the hold.
Questions for the listing agent
- Is there a deadline driving the sale (1031 exchange, divorce, estate, relocation)? That informs how much negotiation room exists.
- Schools are F-rated, which usually means shorter tenancies and higher turnover. Who's the typical renter profile here, and what's been the actual vacancy rate?
- Crime grade is F in this area — have there been break-ins, vandalism, or insurance claims at this property in the last 3 years? What carrier currently insures it and at what premium?
- What's the average days-on-market for RENTAL listings here right now (not sales)? A rising rental-DOM trend means longer vacancies and softer asking-rent achievability than the comps imply.
- What's the recent tenant-quality profile in this submarket — average credit score on applications, eviction rate, late-payment / NSF rate, and stable-employment percentage? A property-management company in the area should have these aggregated.
- How much new for-sale + rental construction is in the pipeline within 1–3 miles? Heavy new supply typically softens prices + rents 12–24 months out; constrained supply supports both.
Investment metrics
- 1% rule
- 1.05% ✓
- Cap rate
- 7.93%
- Cash-on-cash
- 5.84%
- DSCR
- 1.26
- GRM
- 7.9
CMA / ARV
- ARV (on-the-fly)
- $502,282
- Comps found
- 12
Show comp detail 12 sales within ~0.75 mi
| Address | Dist | Beds/Ba | Sqft | Sold | Price | $/sf | Match |
|---|---|---|---|---|---|---|---|
| 37064 Springfield St | 0.06mi | 4/2.0 (+1) | 1,837 (+6%) | 0mo | $530,000 | $289 | 82 |
| 4026 Kona Ct | 0.25mi | 3/2.0 | 1,650 (-5%) | 1mo | $500,000 | $303 | 79 |
| 4021 Kona Ct | 0.28mi | 3/2.0 | 1,650 (-5%) | 9mo | $460,000 | $279 | 71 |
| 37328 Starcrest St | 0.36mi | 4/3.0 (+1) | 1,761 (+1%) | 2mo | $525,000 | $298 | 70 |
| 37327 Starcrest St | 0.37mi | 3/2.5 | 1,842 (+6%) | 3mo | $520,000 | $282 | 68 |
| 4057 E Avenue R12 | 0.45mi | 3/2.0 | 1,650 (-5%) | 9mo | $470,000 | $285 | 63 |
| 36910 Windtree Cir | 0.31mi | 4/3.0 (+1) | 1,823 (+5%) | 8mo | $505,000 | $277 | 62 |
| 3839 Eclipse | 0.34mi | 4/2.0 (+1) | 1,517 (-13%) | 1mo | $510,000 | $336 | 57 |
| 36664 45th E | 0.69mi | 4/2.5 (+1) | 1,670 (-4%) | 2mo | $500,000 | $299 | 53 |
| 4117 E Avenue R13 | 0.35mi | 4/3.0 (+1) | 1,925 (+11%) | 5mo | $533,000 | $277 | 52 |
| 3625 Toscany Ct | 0.44mi | 4/2.0 (+1) | 1,998 (+15%) | 9mo | $520,000 | $260 | 42 |
| 4543 Windstar Way | 0.65mi | 4/2.0 (+1) | 1,517 (-13%) | 2mo | $470,000 | $310 | 42 |
Match score weights: distance 35% · size 25% · config 20% · recency 20%. Top-matched comps best support the ARV.
Projected returns pro-forma
-3.0% appreciation · 3.0% rent growth · sell at horizon
- IRR
- -7.3%
- Equity multiple
- 0.73×
- Total profit
- $-22,544
- Equity at exit
- $44,731
- IRR
- 2.3%
- Equity multiple
- 1.17×
- Total profit
- $14,080
- Equity at exit
- $25,939
Cash invested: $84,000 (down + closing). Projections, not guarantees.
Landlord ↔ Tenant lean methodology
- Overall (STATE)
- 18 Strongly Tenant-Friendly
- State California
- 18 Strongly Tenant-Friendly · D+13
- County
- — inherits STATE
- City
- — inherits STATE
ZIP-level market 93552
- Home prices YoY
- -6.4%
- Active inventory
- 128
- Price-to-rent
- 7.9×
Monthly cashflow live
- Estimated rent
- $3,150 high interval (Pro) →
- Mortgage (P&I)
- −$1,573
- Tax from tax record
- −$382 /mo · $4,578/yr
- Insurance
- −$125
- HOA
- −$0
- Vacancy / Maint / Mgmt
- −$661
- Net cashflow
- $408
Break-even live
UW: 25.0% down · 7.5% · 30yr · 1.5% tax · 5.0% vac · 8.0% maint · 8.0% mgmt
Financing live
Cash to close
- Down payment
- $75,000
- Closing costs
- $9,000
- Reserves months
- —
- Total cash needed
- —
Loan-product check · same deal, 3 products live
Conventional
25% down · 7.5% · 30yr
- Down + closing
- —
- Monthly P&I
- —
- Monthly cashflow
- —
- DSCR
- —
- Eligible?
- —
Personal DTI + credit; lowest rate.
DSCR
20% down · 8.5% · 30yr
- Down + closing
- —
- Monthly P&I
- —
- Monthly cashflow
- —
- DSCR
- —
- Eligible?
- —
No personal income docs; deal must DSCR.
Hard money
10% down · 12.0% · 12mo
- Down + closing
- —
- Monthly P&I
- —
- Monthly cashflow
- —
- DSCR
- —
- Eligible?
- —
Short-term bridge; refi at stabilization.
Rent comps 16 comps
| Address | Beds | Baths | Sqft | Rent | $/sqft | DOM | Units | Dist |
|---|---|---|---|---|---|---|---|---|
| 37333 Scranton Ct Palmdale, CA | 3.0 | 2.0 | 1756 | $2,850 | $1.62 | 24d | 1 | 0.33mi |
| 3559 E Avenue R14 Palmdale, CA | 4.0 | 2.5 | 1483 | $2,895 | $1.95 | 1d | 1 | 0.54mi |
| 37347 Waterman Ave Palmdale, CA | 3.0 | 2.0 | 1383 | $3,350 | $2.42 | 1d | 1 | 0.67mi |
| 36521 Windtree Cir Palmdale, CA | 3.0 | 2.0 | 1371 | $3,000 | $2.19 | 22d | 1 | 0.75mi |
| 36717 Sulphur Springs Rd Palmdale, CA | 3.0 | 2.0 | 1548 | $3,100 | $2.00 | 19d | 1 | 0.76mi |
| 36453 Clearwood Ct Palmdale, CA | 3.0 | 2.5 | 1651 | $2,850 | $1.73 | 1d | 1 | 0.83mi |
| 36905 Pond Ave Palmdale, CA | 4.0 | 3.0 | 1908 | $2,850 | $1.49 | 1d | 1 | 0.86mi |
| 37526 Rose St Palmdale, CA | 3.0 | 2.0 | 1361 | $3,150 | $2.31 | 1d | 1 | 0.87mi |
| 4636 Blue Ridge Ave Palmdale, CA | 3.0 | 2.0 | 1526 | $3,000 | $1.97 | 24d | 1 | 1.07mi |
| 36741 30th St E Palmdale, CA | 3.0 | 2.0 | 1600 | $2,995 | $1.87 | 1d | 1 | 1.19mi |
| 3039 Conestoga Canyon Rd Palmdale, CA | 4.0 | 3.0 | 1948 | $3,100 | $1.59 | 2d | 1 | 1.22mi |
| 4206 East Avenue Q-14 Unit Q14 Palmdale, CA | 3.0 | 2.0 | 1150 | $2,850 | $2.48 | 1d | 1 | 1.32mi |
| 37210 Sabal Ave Palmdale, CA | 3.0 | 2.0 | 1198 | $2,395 | $2.00 | 1d | 1 | 1.37mi |
| 36935 26th St E Palmdale, CA | 4.0 | 2.0 | 1530 | $2,300 | $1.50 | 6d | 1 | 1.45mi |
| 37147 Alder St Palmdale, CA | 3.0 | 2.5 | 1712 | $2,900 | $1.69 | 1d | 1 | 1.48mi |
| 5327 Meredith Ave Palmdale, CA | 4.0 | 2.0 | 1600 | $3,200 | $2.00 | 1d | 1 | 1.50mi |
Listing history 9 events
-
2026-04-03status Pending
-
2026-04-01$300,000 Active
-
2015-03-27historical
-
2010-09-20soldstatus $153,000 291-char remark
Show marketing remark (291 chars)
* * Not a short sale or REO - can close in 30 days or less * * Spacious & bright 3 bedroom home in great location. Home features new carpet, new paint, vaulted ceilings in living room and dining area, family room with fireplace, bonus room, and master bedroom with vaulted ceilings.
-
2010-09-20soldstatus $153,000
Show marketing remark (291 chars)
* * Not a short sale or REO - can close in 30 days or less * * Spacious & bright 3 bedroom home in great location. Home features new carpet, new paint, vaulted ceilings in living room and dining area, family room with fireplace, bonus room, and master bedroom with vaulted ceilings.
-
2010-07-09$153,000 291-char remark
Show marketing remark (291 chars)
* * Not a short sale or REO - can close in 30 days or less * * Spacious & bright 3 bedroom home in great location. Home features new carpet, new paint, vaulted ceilings in living room and dining area, family room with fireplace, bonus room, and master bedroom with vaulted ceilings.
-
2002-11-27$175,000
-
1996-04-26soldstatus $96,500
-
1991-06-28soldstatus $145,450
ⓘ Source: listings_history table (triggers on properties + properties_extension) + one-shot
backfill from property_details.listing_events for pre-trigger history.
Tax reassessment forecast CA · Resets to sale price
- Current annual tax
- $4,578 · $382/mo
- Projected year-2 tax
- $4,578 · $382/mo
- Expected delta
- $0/yr ($0/mo · 0.0%)
ⓘ Screening estimate from a state-policy table — verify with the county assessor before closing.
Climate risk First Street
- Flood 6/10 Major FEMA zone X (unshaded) · 69% chance over 30 yrs
- Wildfire 8/10 Severe
- Heat 7/10 Severe 7 d/yr ≥99°F today · 17 d/yr by 30 yrs out
- Wind 1/10 Low
- Air quality 10/10 Extreme 25 unhealthy d/yr today · 29 by 30 yrs out
Nearby sold comps map
Loading sold comps map…
Walkable amenities ~0.75 mi
Loading nearby amenities…
Taxation est. · year 1
- Rental income
- $37,796
- − Mortgage interest
- −$16,805
- − Property taxes
- −$4,578
- − Insurance
- −$1,500
- − Repairs & maintenance
- −$3,024
- − Management
- −$3,024
- − Depreciation
- −$8,727
- Taxable income
- $139
- Est. tax owed @ 24.0%
- −$33
- After-tax cash flow
- $4,869/yr
For passive investors: Depreciation is non-cash, so a rental often shows a tax loss while cash-flowing — sheltering income. Rental losses are passive: they offset passive income freely, and up to $25,000/yr can offset ordinary (W-2) income if you actively participate and your MAGI is under $100k (phasing out to $0 by $150k); unused losses carry forward. On sale, claimed depreciation is recaptured at up to 25%, and gains may owe capital-gains tax (a 1031 exchange can defer both). Figures are a year-1 estimate at your 24.0% rate — not tax advice; consult a CPA.
Schools (NCES district)
- District
- Palmdale Elementary
- NCES district ID
- 0629580
- Math proficiency
- 20% ▲ 1.00%
- Reading proficiency
- 31% ▲ 1.00%
- Median HH income
- $48,652
- Composite
- 25.34/100
- National rank
- #12888
- State rank
- #1147 of 1400 in CA
Livability — Palmdale
- Score
- 55/100
- State rank
- #861
- US rank
- #23501
Category grades
Schools grade is shown separately in the Schools card above.
Census & demographics
- Census place
- Palmdale, CA
- County
- Los Angeles County · 9,444,647 people
- City population
- 177,644
- Metro
- Los Angeles-Long Beach-Anaheim, CA
- Population (ZIP)
- 42,639
- Household income
- $85,954
- Rent vs Own
- Severe rent burden
- 747.0
Population outlook (Los Angeles County) Hauer SSP2
- Today (2025)
- 10,940,515 people
- By 2030
- 11,256,481 · +2.9%
- By 2040
- 11,729,929 · +7.2%
- By 2050
- 11,948,407 · +9.2%
- By 2075
- 11,818,114 · +8.0%
- By 2100
- 10,842,928 · -0.9%
Race, ethnicity, and origin ACS 2023
- Neighborhood character
- Predominantly Hispanic (72%)
- Race & ethnicity
- Hispanic / Latino 72% Two or more races 21% Black 13% White 11% Asian 2% Native American 1%
- Hispanic origin (detail)
- Mexican 55%
- Common ancestry
- Italian 1%
- Foreign-born
- 27% · Canada, Dominican Republic
- Languages at home
- 42% English-only · Spanish 55% Tagalog/Filipino 1%
Political lean MEDSL · Los Angeles
- 2024 margin
- Solid D (+32.9) · D 64.8% · R 31.9% · Other 3.3%
- 2008→2024 swing
- -7.4pp toward R · 2008: 40.4pp · 2024: 32.9pp
- All cycles
- 2024: D+32.9 2020: D+44.2 2016: D+48.0 2012: D+40.0 2008: D+40.4
Not yet ingested
- Civics
- —
Market trends
- HPI YoY
- ▼ -27.00%
- Current HPI
- 394.1607
- Rent YoY
- —
- Metro
- Los Angeles-Long Beach-Anaheim, CA
- State GDP YoY
- ▲ 3.21%
- F500 in state
- 116
Industry mix (Fortune 500 HQ in CA)
| Industry | F500 HQs | Revenue |
|---|---|---|
| Technology | 27 | $1,492B |
|
||
| Financial Services | 3 | $174B |
|
||
| Retail | 3 | $44B |
|
||
| Insurance | 3 | $26B |
|
||
| Media / Entertainment | 2 | $115B |
|
||
| Pharmaceuticals / Biotech | 2 | $62B |
|
||
Price history
+106.3% since first listed9 events — show timeline
- 2026-04-03 Pending — AVMLS
- 2026-04-01 Listed $300,000 AVMLS
- 2015-03-27 Listing Removed — AVMLS
- 2010-09-20 Sold (Public Records) $153,000 Public Records
- 2010-09-20 Sold (MLS) $153,000 AVMLS
- 2010-07-09 Listed $153,000 AVMLS
- 2002-11-27 Listed $175,000 AVMLS
- 1996-04-26 Sold (Public Records) $96,500 Public Records
- 1991-06-28 Sold (Public Records) $145,450 Public Records
Property tax history
+3.5%/yrLatest (2025): $4,578 · +6.4% YoY. Source: county tax records.
Cash-flow waterfall
monthlySold comps — $/sqft
last 12 mo · ≤1 miLoading sold comps…