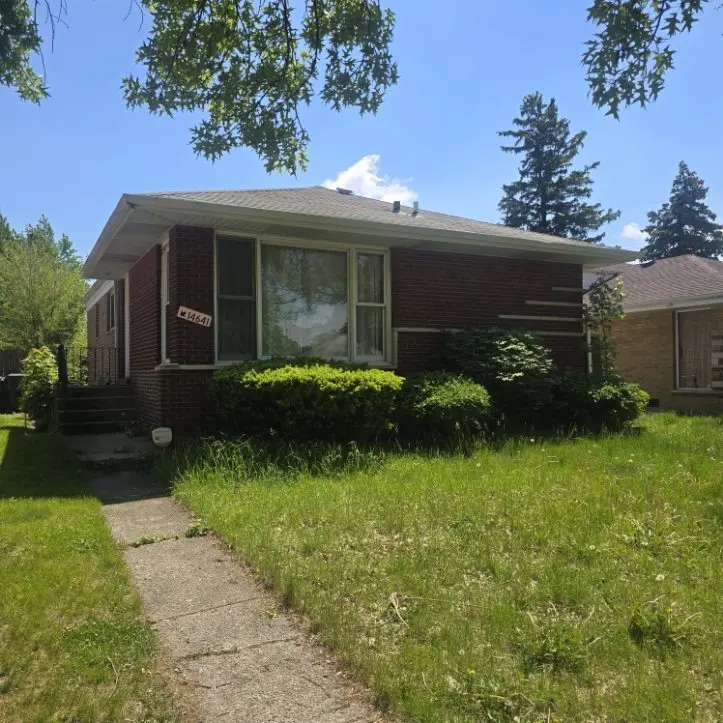
14641 Avalon Ave · Dolton, IL
Flood risk 1/10 · Minimal
- FEMA flood zone
- X (unshaded)
- Chance of flooding over 30 yrs
- 0.0%
- Est. flood insurance / yr
- $473 – $860
Fire risk 1/10 · Minimal
- Est. fire insurance / yr
- $804 – $1,492
Heat risk 3/10 · Minor
- Hot days now (above 101°F)
- 7 days/yr
- Hot days in 30 yrs
- 15 days/yr
Wind risk 2/10 · Minimal
- Chance of severe wind over 30 yrs
- —
Air-quality risk 4/10 · Minor
- Unhealthy air days now
- 4 days/yr
- Unhealthy air days in 30 yrs
- 5 days/yr
Risk factors via First Street. Map © Google.
Why this score? — see what drove the B+ grade
The composite is a weighted blend of 9 inputs, each scored 0–100. Each bar is that input's sub-score; the figure is the points it added to the 100-point composite (weight × sub-score).
- Cash flow +30.0/30.0
- ARV discount +15.0/15.0
- 1% rule +10.0/10.0
- DSCR +10.0/10.0
- Rent growth +4.9/5.0
- Livability +3.7/5.0
- Condition / age +2.5/5.0
- Schools +0.7/10.0
- Appreciation +0.0/10.0
$125,000
🖨 Deal sheet 📄 Offer letter ✓ Due diligence
Listing remarks MLS
Beautifully updated and ready for new owners! Solid brick ranch with full, finished basement! Home has newer AC, furnace, roof and electric. Gorgeous new kitchen with white, shaker style cabinets, stone countertops and stainless appliances. Many new windows, new flooring and fresh paint throughout. Full permits for the renovation. This is a real gem, so view the 3-D tour and schedule private showing today!
Key facts
- Quartz countertops
- Newer furnace
- Finished basement
Tags
Property features AI
Finance
- Other: Lot dimensions approximately 44 x 123 (less than 0.25 acre); Living area source: Assessor; Parcel number available
- Financial info: Special service area: No
- HOA & community: No master association fee required
Exterior
- Parking: Detached garage owned (2 garage spaces, 2 total parking spaces)
- Utilities: Water: Lake Michigan and public; Sewer: Public sewer; Electric: 100 amp service with circuit breakers
- Home design: Detached single-family home; One-story; Fee simple ownership; Built approximately 61–70 years ago; Built before 1978
- Construction: Brick construction; Asphalt roof; Concrete perimeter foundation
- Exterior features: Patio; Curb, sidewalk, street lights, and paved streets
Interior
- Kitchen: Range; Microwave; Dishwasher; Refrigerator; Stainless steel appliances
- Bedrooms: Master bedroom on main level (10 x 13) with full bath; Bedroom on main level (11 x 12); Bedroom on main level (9 x 10)
- Bathrooms: Two full bathrooms
- Heating & cooling: Natural gas forced air heating; Central air conditioning
- Interior features: First-floor bedroom; Finished full basement; Unfinished attic; Six total rooms
- Laundry & utility: Basement laundry (11 x 13); Sump pump
Neighborhood map
What this means for you Summary
Snapshot
- This is a 3-bed/2.0-bath single-family listed at $125k.
Deal economics
- At list price, monthly cash flow is $945 ($11k/yr) — positive.
- The deal already cash-flows at list — no discount required.
- Meets the 1% rule at list price ($2k rent vs $125k).
- Cap rate 15.4% vs local median 9.3% in Dolton — top-decile yield for the area; either an underpriced asset or a hidden risk that comps aren't pricing in. Stress-test before assuming the spread holds.
Location & tenants
- Location reads 74/100 on livability (#263 in IL, #4,883 nationally) — a middle-class / working-renter tenant base. Strengths: commute A+, cost of living A+, housing A+; Watch: employment C-, health & safety C-, crime D-.
- Thornton Twp Hsd 205 (suburban): math 7% / reading 8% proficiency, ranked #594 of 620 in IL (top 96%) — low school quality limits family demand, transient renter base, plan for 1-2y turnover.
- Zoned schools: Thornton Township High School (math 7% / reading 7%, grade F, #605 of 693 statewide, top 87%, 1,628 students, 0% FRL).
- Market conditions: Rents rising fast (+9.7%/yr); 130 active listings in the ZIP; 27 comparable units currently listed for rent nearby; rentals leasing fast (median 12d on market — plan ~1-2 weeks tenant-placement turnaround); 6,272 units permitted in Cook County in 2024 (4,658 in 5+ unit buildings).
- At $2,290/mo this rent would consume 47% of the median local household income ($58k/yr) (locally 919% of renters already pay >50% of income on rent) — very limited rent-growth headroom before tenants either downsize or default.
Forward outlook
- Local home prices are declining (-3.0%/yr); year-one equity from $864 of loan paydown is wiped out by about $4k of value loss. Plan a longer hold.
- At projected returns (-3.0% appreciation + 8.0% rent growth), your $35k cash investment doubles in ~4 years — after that, you're playing with house money.
Negotiation context
- Only 1 days on market — expect competitive offers; lowballing is unlikely to land.
- 5 sale attempts since 20y ago; this cycle's ask has dropped $95k (43%) from the opening price — seller is motivated, your offer sets the floor, not the list.
Risks & watch-outs
- Watch-outs: built in 1957 — expect roof / HVAC / electrical / plumbing capex.
Questions for the listing agent
- Built in 1957 — when were the roof, HVAC, electrical panel, plumbing, and water heater last replaced?
- Is there a deadline driving the sale (1031 exchange, divorce, estate, relocation)? That informs how much negotiation room exists.
- Schools are F-rated, which usually means shorter tenancies and higher turnover. Who's the typical renter profile here, and what's been the actual vacancy rate?
- Crime grade is D in this area — have there been break-ins, vandalism, or insurance claims at this property in the last 3 years? What carrier currently insures it and at what premium?
- What's the average days-on-market for RENTAL listings here right now (not sales)? A rising rental-DOM trend means longer vacancies and softer asking-rent achievability than the comps imply.
- What's the recent tenant-quality profile in this submarket — average credit score on applications, eviction rate, late-payment / NSF rate, and stable-employment percentage? A property-management company in the area should have these aggregated.
- How much new for-sale + rental construction is in the pipeline within 1–3 miles? Heavy new supply typically softens prices + rents 12–24 months out; constrained supply supports both.
Investment metrics
- 1% rule
- 1.83% ✓
- Cap rate
- 15.37%
- Cash-on-cash
- 32.42%
- DSCR
- 2.44
- GRM
- 4.5
CMA / ARV
- ARV (on-the-fly)
- $154,791
- Comps found
- 12
Show comp detail 12 sales within ~0.75 mi
| Address | Dist | Beds/Ba | Sqft | Sold | Price | $/sf | Match |
|---|---|---|---|---|---|---|---|
| 14731 Kimbark Ave | 0.12mi | 3/1.0 | 1,017 (-3%) | 2mo | $115,000 | $113 | 83 |
| 14642 Dorchester Ave | 0.16mi | 3/1.0 | 1,013 (-4%) | 1mo | $170,000 | $168 | 82 |
| 14610 Blackstone Ave | 0.29mi | 3/1.0 | 1,017 (-3%) | 1mo | $150,000 | $147 | 76 |
| 14738 Blackstone Ave | 0.31mi | 3/1.0 | 1,017 (-3%) | 1mo | $150,000 | $147 | 75 |
| 14341 University Ave | 0.39mi | 3/1.0 | 1,035 (-2%) | 1mo | $100,000 | $97 | 74 |
| 14842 Shepard Dr | 0.24mi | 3/1.5 | 1,141 (+8%) | 2mo | $135,000 | $118 | 71 |
| 1138 E 151st St | 0.53mi | 3/1.5 | 1,056 (+0%) | 2mo | $210,000 | $199 | 71 |
| 14222 S Woodlawn Ave | 0.55mi | 3/1.0 | 1,089 (+3%) | 2mo | $90,000 | $83 | 62 |
| 14927 Cottage Grove Ave | 0.66mi | 3/2.0 | 1,095 (+4%) | 1mo | $250,000 | $228 | 62 |
| 15043 Meadow Ln | 0.51mi | 3/1.0 | 1,151 (+9%) | 1mo | $130,000 | $113 | 55 |
| 317 Madison Ave | 0.63mi | 3/1.0 | 1,152 (+9%) | 3mo | $67,200 | $58 | 49 |
| 14315 Dobson Ave | 0.50mi | 4/2.0 (+1) | 1,200 (+14%) | 1mo | $194,888 | $162 | 48 |
Match score weights: distance 35% · size 25% · config 20% · recency 20%. Top-matched comps best support the ARV.
Projected returns pro-forma
-3.0% appreciation · 8.0% rent growth · sell at horizon
- IRR
- 33.0%
- Equity multiple
- 2.49×
- Total profit
- $52,098
- Equity at exit
- $18,638
- IRR
- 42.7%
- Equity multiple
- 6.09×
- Total profit
- $178,132
- Equity at exit
- $10,808
Cash invested: $35,000 (down + closing). Projections, not guarantees.
Landlord ↔ Tenant lean methodology
- Overall (STATE)
- 43 Moderately Tenant-Leaning
- State Illinois
- 43 Moderately Tenant-Leaning · D+7
- County
- — inherits STATE
- City
- — inherits STATE
ZIP-level market 60419
- Home prices YoY
- -25.7%
- Rents YoY
- 9.7%
- Active inventory
- 130
- Price-to-rent
- 4.5×
Monthly cashflow live
- Estimated rent
- $2,290 high interval (Pro) →
- Mortgage (P&I)
- −$656
- Tax est. 1.5%
- −$156 /mo · $1,875/yr
- Insurance
- −$52
- HOA
- −$0
- Vacancy / Maint / Mgmt
- −$481
- Net cashflow
- $945
Break-even live
UW: 25.0% down · 7.5% · 30yr · 1.5% tax · 5.0% vac · 8.0% maint · 8.0% mgmt
Financing live
Cash to close
- Down payment
- $31,250
- Closing costs
- $3,750
- Reserves months
- —
- Total cash needed
- —
Loan-product check · same deal, 3 products live
Conventional
25% down · 7.5% · 30yr
- Down + closing
- —
- Monthly P&I
- —
- Monthly cashflow
- —
- DSCR
- —
- Eligible?
- —
Personal DTI + credit; lowest rate.
DSCR
20% down · 8.5% · 30yr
- Down + closing
- —
- Monthly P&I
- —
- Monthly cashflow
- —
- DSCR
- —
- Eligible?
- —
No personal income docs; deal must DSCR.
Hard money
10% down · 12.0% · 12mo
- Down + closing
- —
- Monthly P&I
- —
- Monthly cashflow
- —
- DSCR
- —
- Eligible?
- —
Short-term bridge; refi at stabilization.
Rent comps 27 comps
| Address | Beds | Baths | Sqft | Rent | $/sqft | DOM | Units | Dist |
|---|---|---|---|---|---|---|---|---|
| 14716 Dorchester Ave Dolton, IL | 3.0 | 2.0 | 1250 | $2,800 | $2.24 | 19d | 1 | 0.18mi |
| 14433 Woodlawn Ave Dolton, IL | 4.0 | 2.0 | 1300 | $2,000 | $1.54 | 18d | 1 | 0.30mi |
| 14738 Blackstone Ave Dolton, IL | 3.0 | 1.0 | 1017 | $2,400 | $2.36 | 10d | 1 | 0.32mi |
| 14610 Blackstone Ave Dolton, IL | 3.0 | 1.0 | 1017 | $2,400 | $2.36 | 6d | 1 | 0.32mi |
| 14500 Cottage Grove Ave Unit 3 Dolton, IL | 2.0 | 1.0 | 1000 | $1,475 | $1.48 | 24d | 1 | 0.64mi |
| 409 Madison Ave Unit 2 Calumet City, IL | 3.0 | 1.5 | 1200 | $1,795 | $1.50 | 3d | 1 | 0.68mi |
| 15231 Hastings Dr Dolton, IL | 4.0 | 1.5 | 1487 | $2,146 | $1.44 | 7d | 1 | 0.71mi |
| 14817 Champlain Ave Dolton, IL | 2.0 | 1.0 | 980 | $2,430 | $2.48 | 22d | 1 | 0.75mi |
| 14916 Langley Ave Dolton, IL | 3.0 | 1.5 | 1418 | $2,500 | $1.76 | 24d | 1 | 0.76mi |
| 405 Clyde Ave Calumet City, IL | 3.0 | 1.0 | 973 | $2,300 | $2.36 | 1d | 1 | 0.86mi |
| 1860 State St Calumet City, IL | 3.0 | 1.0 | 1100 | $1,800 | $1.64 | 17d | 1 | 0.86mi |
| 14305 Irving Ave Unit 2 Dolton, IL | 3.0 | 1.0 | 1100 | $2,200 | $2.00 | 24d | 1 | 0.93mi |
| 660 Clyde Ave Calumet City, IL | 3.0 | 1.5 | 1400 | $1,750 | $1.25 | 3d | 1 | 1.13mi |
| 101 Oglesby Ave Calumet City, IL | 2.0 | 1.0 | 1000 | $1,800 | $1.80 | 19d | 1 | 1.18mi |
| 101 Oglesby Ave Calumet City, IL | 2.0 | 1.0 | 1100 | $1,800 | $1.64 | 12d | 1 | 1.18mi |
| 101 Oglesby Ave Calumet City, IL | 2.0 | 1.0 | 1000 | $1,800 | $1.80 | 22d | 1 | 1.18mi |
| 250 Yates Ave Unit 1616 Dolton 1E Calumet City, IL | 2.0 | 1.0 | 875 | $1,465 | $1.67 | 7d | 1 | 1.19mi |
| 1601 Downs Dr Unit 3S Calumet City, IL | 2.0 | 1.0 | 750 | $1,400 | $1.87 | 24d | 1 | 1.20mi |
| 659 Paxton Ave Calumet City, IL | 3.0 | 2.0 | 1255 | $2,461 | $1.96 | 10d | 1 | 1.25mi |
| 15238 Doctor Martin Luther King Junior Dr Unit 2W Dolton, IL | 2.0 | 1.0 | 800 | $1,500 | $1.88 | 10d | 1 | 1.29mi |
| 15509 Park Ln South Holland, IL | 4.0 | 1.5 | 1200 | $3,400 | $2.83 | 7d | 1 | 1.30mi |
| 15509 Park Ln South Holland, IL | 4.0 | 1.5 | 1200 | $3,400 | $2.83 | 24d | 1 | 1.30mi |
| 14518 S Hoxie Ave Chicago, IL | 3.0 | 1.5 | 1128 | $2,450 | $2.17 | 1d | 1 | 1.38mi |
| 460 Hoxie Ave Unit R Calumet City, IL | 2.0 | 1.0 | 800 | $1,650 | $2.06 | 14d | 1 | 1.40mi |
| 460 Hoxie Ave Unit R Calumet City, IL | 2.0 | 1.0 | 800 | $1,650 | $2.06 | 7d | 1 | 1.40mi |
| 14501 Torrence Ave Unit 3A Burnham, IL | 2.0 | 1.0 | 800 | $1,250 | $1.56 | 10d | 1 | 1.47mi |
| 14501 S Torrence Ave Chicago, IL | 1.0–2.0 | 1.0 | 737 | $1,250 | $1.69 | 12d | 2 | 1.47mi |
Listing history 29 events
-
2026-06-18pricedays on market $125,000 Active 1 DOM
-
2026-06-17days on market $150,000 Active 31 DOM
-
2026-06-16days on market $150,000 Active 30 DOM
-
2026-06-15days on market $150,000 Active 29 DOM
-
2026-06-13days on market $150,000 Active 27 DOM
-
2026-06-13days on market $150,000 Active 26 DOM
-
2026-06-09days on market $150,000 Active 23 DOM
-
2026-06-08days on market $150,000 Active 22 DOM
-
2026-06-07days on market $150,000 Active 21 DOM
-
2026-06-04days on market $150,000 Active 18 DOM
-
2026-06-03days on market $150,000 Active 17 DOM
-
2026-06-02days on market $150,000 Active 16 DOM
-
2026-06-01days on market $150,000 Active 15 DOM
-
2026-05-31days on market $150,000 Active 14 DOM
-
2022-08-08soldstatus $225,000
-
2022-08-01soldstatus $225,000 Closed 409-char remark
Show marketing remark (409 chars)
Beautifully updated and ready for new owners! Solid brick ranch with full, finished basement! Home has newer AC, furnace, roof and electric. Gorgeous new kitchen with white, shaker style cabinets, stone countertops and stainless appliances. Many new windows, new flooring and fresh paint throughout. Full permits for the renovation. This is a real gem, so view the 3-D tour and schedule private showing today!
-
2022-06-08historical Contingent - Continue to Show 409-char remark
Show marketing remark (409 chars)
Beautifully updated and ready for new owners! Solid brick ranch with full, finished basement! Home has newer AC, furnace, roof and electric. Gorgeous new kitchen with white, shaker style cabinets, stone countertops and stainless appliances. Many new windows, new flooring and fresh paint throughout. Full permits for the renovation. This is a real gem, so view the 3-D tour and schedule private showing today!
-
2022-05-25price $214,700 409-char remark
Show marketing remark (409 chars)
Beautifully updated and ready for new owners! Solid brick ranch with full, finished basement! Home has newer AC, furnace, roof and electric. Gorgeous new kitchen with white, shaker style cabinets, stone countertops and stainless appliances. Many new windows, new flooring and fresh paint throughout. Full permits for the renovation. This is a real gem, so view the 3-D tour and schedule private showing today!
-
2022-04-25$219,700 Active 409-char remark
Show marketing remark (409 chars)
Beautifully updated and ready for new owners! Solid brick ranch with full, finished basement! Home has newer AC, furnace, roof and electric. Gorgeous new kitchen with white, shaker style cabinets, stone countertops and stainless appliances. Many new windows, new flooring and fresh paint throughout. Full permits for the renovation. This is a real gem, so view the 3-D tour and schedule private showing today!
-
2021-11-11historical
-
2021-10-22Active
-
2021-06-08soldstatus $105,000
-
2017-09-27historical
-
2017-08-18New
-
2017-07-26historical
-
2017-07-24New
-
2007-07-05soldstatus $143,500
-
2007-06-14historical
-
2006-11-21$149,900
ⓘ Source: listings_history table (triggers on properties + properties_extension) + one-shot
backfill from property_details.listing_events for pre-trigger history.
Climate risk First Street
- Flood 1/10 Low FEMA zone X (unshaded) · 0% chance over 30 yrs
- Wildfire 1/10 Low
- Heat 3/10 Moderate 7 d/yr ≥101°F today · 15 d/yr by 30 yrs out
- Wind 2/10 Low
- Air quality 4/10 Moderate 4 unhealthy d/yr today · 5 by 30 yrs out
Nearby sold comps map
Loading sold comps map…
Walkable amenities ~0.75 mi
Loading nearby amenities…
Taxation est. · year 1
- Rental income
- $27,483
- − Mortgage interest
- −$7,002
- − Property taxes
- −$1,875
- − Insurance
- −$625
- − Repairs & maintenance
- −$2,199
- − Management
- −$2,199
- − Depreciation
- −$3,636
- Taxable income
- $9,947
- Est. tax owed @ 24.0%
- −$2,387
- After-tax cash flow
- $8,958/yr
For passive investors: Depreciation is non-cash, so a rental often shows a tax loss while cash-flowing — sheltering income. Rental losses are passive: they offset passive income freely, and up to $25,000/yr can offset ordinary (W-2) income if you actively participate and your MAGI is under $100k (phasing out to $0 by $150k); unused losses carry forward. On sale, claimed depreciation is recaptured at up to 25%, and gains may owe capital-gains tax (a 1031 exchange can defer both). Figures are a year-1 estimate at your 24.0% rate — not tax advice; consult a CPA.
Schools (NCES district)
- District
- Thornton Twp Hsd 205
- NCES district ID
- 1738970
- Math proficiency
- 7% ▬ 0.00%
- Reading proficiency
- 8% ▼ -2.00%
- Median HH income
- $43,392
- Composite
- 6.92/100
- National rank
- #9976
- State rank
- #594 of 620 in IL
Livability — Dolton
- Score
- 74/100
- State rank
- #263
- US rank
- #4883
Category grades
Schools grade is shown separately in the Schools card above.
Census & demographics
- Census place
- Dolton, IL
- County
- Cook County · 4,486,803 people
- City population
- 20,825
- Metro
- Chicago-Naperville-Elgin, IL-IN-WI
- Population (ZIP)
- 20,825
- Household income
- $57,887
- Rent vs Own
- Severe rent burden
- 919.0
Population outlook (Cook County) Hauer SSP2
- Today (2025)
- 5,347,519 people
- By 2030
- 5,357,703 · +0.2%
- By 2040
- 5,324,924 · -0.4%
- By 2050
- 5,230,762 · -2.2%
- By 2075
- 4,785,735 · -10.5%
- By 2100
- 4,188,836 · -21.7%
Race, ethnicity, and origin ACS 2023
- Neighborhood character
- Predominantly Black (91%)
- Race & ethnicity
- Black 91% White 4% Two or more races 3% Hispanic / Latino 1%
- Common ancestry
- Romanian 1% Hispanic 1%
- Foreign-born
- 3% · Canada
- Languages at home
- 95% English-only · French/Haitian/Cajun 2% Spanish 1%
Political lean MEDSL · Cook
- 2024 margin
- Solid D (+42.0) · D 70.4% · R 28.4% · Other 1.2%
- 2008→2024 swing
- -11.4pp toward R · 2008: 53.4pp · 2024: 42.0pp
- All cycles
- 2024: D+42.0 2020: D+50.3 2016: D+53.0 2012: D+49.4 2008: D+53.4
Not yet ingested
- Civics
- —
Market trends
- HPI YoY
- ▼ -66.88%
- Current HPI
- 193.2346
- Rent YoY
- ▲ 9.65%
- Metro
- Chicago-Naperville-Elgin, IL-IN-WI
- State GDP YoY
- ▲ 1.59%
- F500 in state
- 60
Industry mix (Fortune 500 HQ in IL)
| Industry | F500 HQs | Revenue |
|---|---|---|
| Insurance | 4 | $201B |
|
||
| Consumer Goods | 4 | $87B |
|
||
| Industrial Machinery | 3 | $64B |
|
||
| Healthcare | 2 | $55B |
|
||
| Retail / Pharmacy | 1 | $148B |
|
||
| Agriculture / Food | 1 | $86B |
|
||
Price history
+50.1% since first listed15 events — show timeline
- 2022-08-08 Sold (Public Records) $225,000 Public Records
- 2022-08-01 Sold (MLS) $225,000 MRED as Distributed by MLS Grid
- 2022-06-08 Contingent — MRED as Distributed by MLS Grid
- 2022-05-25 Price Changed $214,700 MRED as Distributed by MLS Grid
- 2022-04-25 Listed $219,700 MRED as Distributed by MLS Grid
- 2021-11-11 Listing Removed — MRED as Distributed by MLS Grid
- 2021-10-22 Listed — MRED as Distributed by MLS Grid
- 2021-06-08 Sold (Public Records) $105,000 Public Records
- 2017-09-27 Listing Removed — MRED as Distributed by MLS Grid
- 2017-08-18 Listed — MRED as Distributed by MLS Grid
- 2017-07-26 Listing Removed — MRED as Distributed by MLS Grid
- 2017-07-24 Listed — MRED as Distributed by MLS Grid
- 2007-07-05 Sold (MLS) $143,500 MRED as Distributed by MLS Grid
- 2007-06-14 Listing Removed — MRED as Distributed by MLS Grid
- 2006-11-21 Listed $149,900 MRED as Distributed by MLS Grid
Property tax history
+3.9%/yrLatest (2023): $7,899 · +19.2% YoY. Source: county tax records.
Cash-flow waterfall
monthlySold comps — $/sqft
last 12 mo · ≤1 miLoading sold comps…