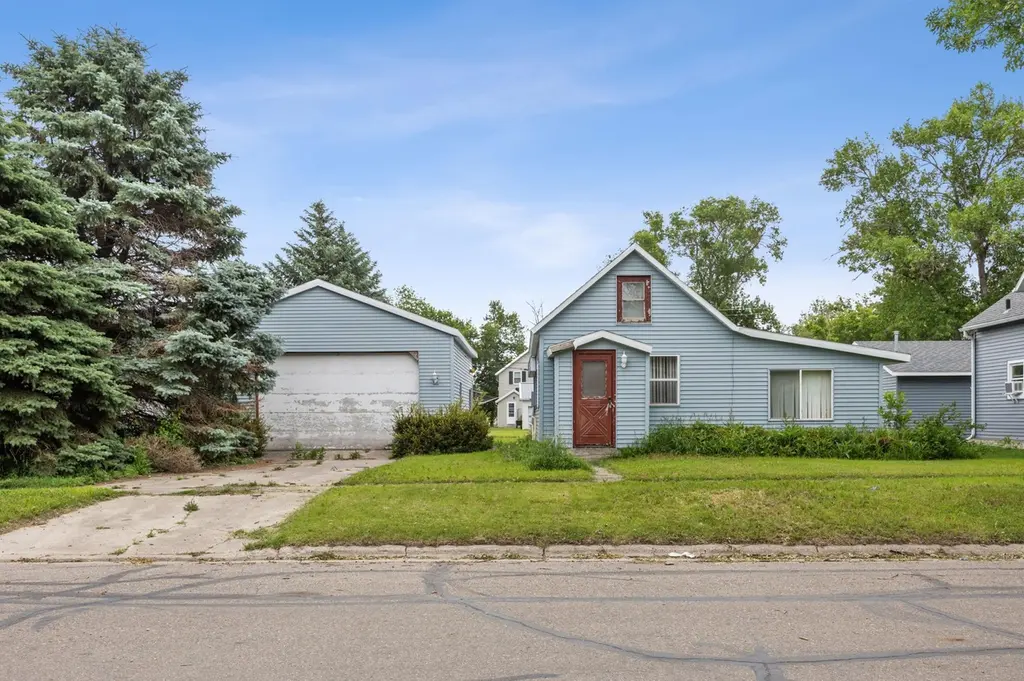
118 2nd St SW · Hillsboro, ND
Flood risk 1/10 · Minimal
- FEMA flood zone
- X (unshaded)
- Chance of flooding over 30 yrs
- 0.0%
- Est. flood insurance / yr
- $473 – $860
Fire risk 3/10 · Minor
- Est. fire insurance / yr
- $1,289 – $2,393
Heat risk 2/10 · Minimal
- Hot days now (above 98°F)
- 7 days/yr
- Hot days in 30 yrs
- 12 days/yr
Wind risk 1/10 · Minimal
- Chance of severe wind over 30 yrs
- —
Air-quality risk 3/10 · Minor
- Unhealthy air days now
- 3 days/yr
- Unhealthy air days in 30 yrs
- 3 days/yr
Risk factors via First Street. Map © Google.
Why this score? — see what drove the B+ grade
The composite is a weighted blend of 9 inputs, each scored 0–100. Each bar is that input's sub-score; the figure is the points it added to the 100-point composite (weight × sub-score).
- Cash flow +30.0/30.0
- 1% rule +10.0/10.0
- DSCR +10.0/10.0
- ARV discount +7.5/15.0
- Appreciation +6.9/10.0
- Schools +4.1/10.0
- Livability +3.9/5.0
- Rent growth +2.5/5.0
- Condition / age +2.5/5.0
$60,000
🖨 Deal sheet 📄 Offer letter ✓ Due diligence
Key facts
- Quarter acre lot
- 0.26 acre lot
- 2 garage spots
Tags
Property features AI
Exterior
- Parking: Concrete parking; 2 garage spaces (garage dimensions approx. 26 x 30)
- Utilities: City water (connected); City sewer (connected); Natural gas and propane available
- Home design: Residential property; One-and-one-half story; Above-grade finished area approximately 1,158 sq ft
- Construction: Other construction materials; Roof age 8 years or less; Foundation area approximately 1,040 (crawl space foundation)
- Exterior features: Vinyl exterior; Patio; No fencing
Interior
- Kitchen: Range
- Bedrooms: 3 bedrooms (primary on main floor; other bedrooms on main level)
- Bathrooms: One full bathroom on the main floor
- Heating & cooling: Forced air heating; Window air conditioning units
- Interior features: Ceiling fan(s); Main floor primary bedroom; Living/Dining room layout; Crawl space basement
- Laundry & utility: Main level laundry; Washer; Dryer
Neighborhood map
What this means for you Summary
Snapshot
- This is a 3-bed/1.0-bath single-family listed at $60k.
Deal economics
- At list price, monthly cash flow is $1k ($13k/yr) — positive.
- The deal already cash-flows at list — no discount required.
- Meets the 1% rule at list price ($2k rent vs $60k).
Location & tenants
- Location reads 78/100 on livability (#7 in ND, #2,511 nationally) — a middle-class / working-renter tenant base. Strengths: crime A+, cost of living A+, housing A+; Watch: amenities F, commute F.
- Hillsboro 9 (rural): math 51% / reading 44% proficiency, ranked #16 of 53 in ND (top 30%) — families likely to look elsewhere, expect single-tenant / working-renter base with shorter leases; only 19% free/reduced lunch — higher-income household profile.
- Zoned schools: Hillsboro High School (math 47% / reading 47%, grade D-, #30 of 144 statewide, top 22%, 241 students, 21% FRL) — zoned schools at 21% FRL track the district average.
- Market conditions: 14 active listings in the ZIP; 8 units permitted in Traill County in 2024 (0 in 5+ unit buildings).
Forward outlook
- In year one you build about $3k of equity ($415 loan paydown + $2k appreciation (3.7% local appreciation)).
- Traill County population projected at +3% by 2050 — modest demand growth; plan on rents tracking national, not racing it.
- At projected returns (3.7% appreciation + 3.0% rent growth), your $17k cash investment doubles in ~2 years — after that, you're playing with house money.
Negotiation context
- Only 13 days on market — expect competitive offers; lowballing is unlikely to land.
- 2 sale attempts; this cycle's ask has dropped $5k (8%) from the opening price — seller is motivated, your offer sets the floor, not the list.
Risks & watch-outs
- Watch-outs: built in 1905 — expect roof / HVAC / electrical / plumbing capex.
Questions for the listing agent
- Built in 1905 — when were the roof, HVAC, electrical panel, plumbing, and water heater last replaced?
- Is there a deadline driving the sale (1031 exchange, divorce, estate, relocation)? That informs how much negotiation room exists.
- What's the average days-on-market for RENTAL listings here right now (not sales)? A rising rental-DOM trend means longer vacancies and softer asking-rent achievability than the comps imply.
- What's the recent tenant-quality profile in this submarket — average credit score on applications, eviction rate, late-payment / NSF rate, and stable-employment percentage? A property-management company in the area should have these aggregated.
- How much new for-sale + rental construction is in the pipeline within 1–3 miles? Heavy new supply typically softens prices + rents 12–24 months out; constrained supply supports both.
Investment metrics
- 1% rule
- 3.11% ✓
- Cap rate
- 27.59%
- Cash-on-cash
- 76.08%
- DSCR
- 4.39
- GRM
- 2.7
CMA / ARV
No comps found within radius.
Projected returns pro-forma
3.72% appreciation · 3.0% rent growth · sell at horizon
- IRR
- 81.2%
- Equity multiple
- 5.61×
- Total profit
- $77,391
- Equity at exit
- $29,428
- IRR
- 80.2%
- Equity multiple
- 11.58×
- Total profit
- $177,713
- Equity at exit
- $47,357
Cash invested: $16,800 (down + closing). Projections, not guarantees.
Landlord ↔ Tenant lean methodology
- Overall (STATE)
- 82 Strongly Landlord-Friendly
- State North Dakota
- 82 Strongly Landlord-Friendly · R+20
- County
- — inherits STATE
- City
- — inherits STATE
ZIP-level market 58045
- Home prices YoY
- 2.7%
- Active inventory
- 14
- Price-to-rent
- 2.7×
Monthly cashflow live
- Estimated rent
- $1,866 medium interval (Pro) →
- Mortgage (P&I)
- −$315
- Tax from tax record
- −$69 /mo · $829/yr
- Insurance
- −$25
- HOA
- −$0
- Vacancy / Maint / Mgmt
- −$392
- Net cashflow
- $1,065
Break-even live
UW: 25.0% down · 7.5% · 30yr · 1.5% tax · 5.0% vac · 8.0% maint · 8.0% mgmt
Financing live
Cash to close
- Down payment
- $15,000
- Closing costs
- $1,800
- Reserves months
- —
- Total cash needed
- —
Loan-product check · same deal, 3 products live
Conventional
25% down · 7.5% · 30yr
- Down + closing
- —
- Monthly P&I
- —
- Monthly cashflow
- —
- DSCR
- —
- Eligible?
- —
Personal DTI + credit; lowest rate.
DSCR
20% down · 8.5% · 30yr
- Down + closing
- —
- Monthly P&I
- —
- Monthly cashflow
- —
- DSCR
- —
- Eligible?
- —
No personal income docs; deal must DSCR.
Hard money
10% down · 12.0% · 12mo
- Down + closing
- —
- Monthly P&I
- —
- Monthly cashflow
- —
- DSCR
- —
- Eligible?
- —
Short-term bridge; refi at stabilization.
Listing history 15 events
-
2026-06-18days on market $60,000 Active 13 DOM
-
2026-06-17days on market $60,000 Active 12 DOM
-
2026-06-16days on market $60,000 Active 11 DOM
-
2026-06-15days on market $60,000 Active 10 DOM
-
2026-06-13days on market $60,000 Active 8 DOM
-
2026-06-12days on market $60,000 Active 7 DOM
-
2026-06-09days on market $60,000 Active 4 DOM
-
2026-06-08days on market $60,000 Active 3 DOM
-
2026-06-07pricedays on market $60,000 Active 2 DOM
-
2026-01-08$64,900 Active
-
2026-01-01historical
-
2025-11-18price $64,900
-
2025-09-14price $69,900
-
2025-08-14price $78,000
-
2025-06-26$83,000 Active
ⓘ Source: listings_history table (triggers on properties + properties_extension) + one-shot
backfill from property_details.listing_events for pre-trigger history.
Tax reassessment forecast ND · Resets to sale price
- Current annual tax
- $829 · $69/mo
- Projected year-2 tax
- $829 · $69/mo
- Expected delta
- $0/yr ($0/mo · 0.0%)
ⓘ Screening estimate from a state-policy table — verify with the county assessor before closing.
Climate risk First Street
- Flood 1/10 Low FEMA zone X (unshaded) · 0% chance over 30 yrs
- Wildfire 3/10 Moderate
- Heat 2/10 Low 7 d/yr ≥98°F today · 12 d/yr by 30 yrs out
- Wind 1/10 Low
- Air quality 3/10 Moderate 3 unhealthy d/yr today · 3 by 30 yrs out
Nearby sold comps map
Loading sold comps map…
Walkable amenities ~0.75 mi
Loading nearby amenities…
Taxation est. · year 1
- Rental income
- $22,387
- − Mortgage interest
- −$3,361
- − Property taxes
- −$829
- − Insurance
- −$300
- − Repairs & maintenance
- −$1,791
- − Management
- −$1,791
- − Depreciation
- −$1,745
- Taxable income
- $12,570
- Est. tax owed @ 24.0%
- −$3,017
- After-tax cash flow
- $9,764/yr
For passive investors: Depreciation is non-cash, so a rental often shows a tax loss while cash-flowing — sheltering income. Rental losses are passive: they offset passive income freely, and up to $25,000/yr can offset ordinary (W-2) income if you actively participate and your MAGI is under $100k (phasing out to $0 by $150k); unused losses carry forward. On sale, claimed depreciation is recaptured at up to 25%, and gains may owe capital-gains tax (a 1031 exchange can defer both). Figures are a year-1 estimate at your 24.0% rate — not tax advice; consult a CPA.
Schools (NCES district)
- District
- Hillsboro 9
- NCES district ID
- 3809570
- Math proficiency
- 51% ▲ 1.00%
- Reading proficiency
- 44% ▬ 0.00%
- Median HH income
- $51,294
- Composite
- 40.88/100
- National rank
- #3622
- State rank
- #16 of 53 in ND
Livability — Hillsboro
- Score
- 78/100
- State rank
- #7
- US rank
- #2511
Category grades
Schools grade is shown separately in the Schools card above.
Census & demographics
- Census place
- Hillsboro, ND
- Population (ZIP)
- 2,181
Population outlook (Traill County) Hauer SSP2
- Today (2025)
- 8,107 people
- By 2030
- 8,099 · -0.1%
- By 2040
- 8,151 · +0.5%
- By 2050
- 8,384 · +3.4%
- By 2075
- 9,868 · +21.7%
- By 2100
- 12,181 · +50.3%
Race, ethnicity, and origin ACS 2023
- Neighborhood character
- Predominantly White (90%)
- Race & ethnicity
- White 90% Two or more races 8% Hispanic / Latino 3%
- Common ancestry
- Portuguese 31% Scottish 6% Lithuanian 3%
- Foreign-born
- 1%
- Languages at home
- 98% English-only · Other Indo-European 1% Tagalog/Filipino 1%
Political lean MEDSL · Traill
- 2024 margin
- Solid R (+31.6) · D 33.3% · R 65.0% · Other 1.7%
- 2008→2024 swing
- -38.8pp toward R · 2008: 7.2pp · 2024: -31.6pp
- All cycles
- 2024: R+31.6 2020: R+24.9 2016: R+26.5 2012: R+4.7 2008: D+7.2
Not yet ingested
- Civics
- —
Market trends
- HPI YoY
- ▲ 3.72%
- Current HPI
- 139.3759
- Rent YoY
- —
- Metro
- —
- State GDP YoY
- ▲ 2.09%
- F500 in state
- 2
Industry mix (Fortune 500 HQ in ND)
| Industry | F500 HQs | Revenue |
|---|---|---|
| Utilities / Construction | 1 | $6B |
|
||
Price history
-21.8% since first listed6 events — show timeline
- 2026-01-08 Listed $64,900 NORTHSTARMLS as Distributed by MLS Grid
- 2026-01-01 Listing Removed — NORTHSTARMLS as Distributed by MLS Grid
- 2025-11-18 Price Changed $64,900 NORTHSTARMLS as Distributed by MLS Grid
- 2025-09-14 Price Changed $69,900 NORTHSTARMLS as Distributed by MLS Grid
- 2025-08-14 Price Changed $78,000 NORTHSTARMLS as Distributed by MLS Grid
- 2025-06-26 Listed $83,000 NORTHSTARMLS as Distributed by MLS Grid
Property tax history
-1.8%/yrLatest (2025): $829 · +15.6% YoY. Source: county tax records.
Cash-flow waterfall
monthlySold comps — $/sqft
last 12 mo · ≤1 miLoading sold comps…