878 Doctor's Creek Rd NE · Ludowici, GA
Flood risk 1/10 · Minimal
- FEMA flood zone
- X (unshaded)
- Chance of flooding over 30 yrs
- 0.0%
- Est. flood insurance / yr
- $507 – $1,088
Fire risk 7/10 · Major
- Est. fire insurance / yr
- $963 – $1,789
Heat risk 8/10 · Major
- Hot days now (above 109°F)
- 7 days/yr
- Hot days in 30 yrs
- 18 days/yr
Wind risk 8/10 · Major
- Chance of severe wind over 30 yrs
- 99.0%
Air-quality risk 2/10 · Minimal
- Unhealthy air days now
- 2 days/yr
- Unhealthy air days in 30 yrs
- 2 days/yr
Risk factors via First Street. Map © Google.
Why this score? — see what drove the D grade
The composite is a weighted blend of 9 inputs, each scored 0–100. Each bar is that input's sub-score; the figure is the points it added to the 100-point composite (weight × sub-score).
- ARV discount +11.0/15.0
- Cash flow +9.6/30.0
- Appreciation +5.6/10.0
- Condition / age +3.8/5.0
- Livability +3.6/5.0
- 1% rule +3.1/10.0
- DSCR +2.7/10.0
- Rent growth +2.5/5.0
- Schools +2.3/10.0
$278,625
🖨 Deal sheet (PDF) 📄 Offer letter ✓ Due diligence
Listing remarks
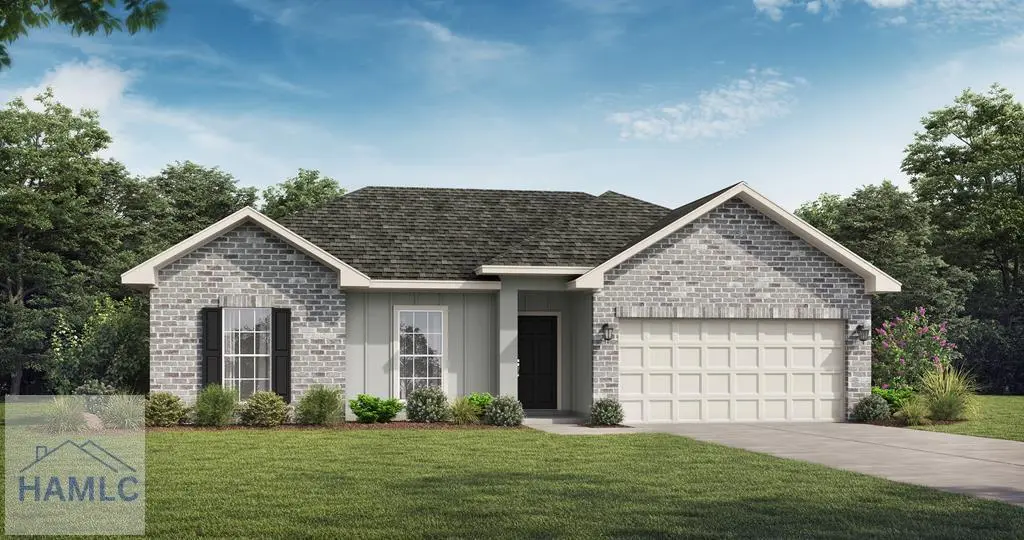
The Stafford floor plan, situated in the serene new Doctor’s Creek community, boasts striking curb appeal that never fails to impress. Perfect for families of any size, this versatile layout offers 4 bedrooms and 2 baths. The open-concept living space provides unobstructed views from the upgraded granite kitchen to the breakfast area. The primary suite includes a spacious walk-in closet, along with a private bath featuring a dual vanity, garden tub, and separate shower. Artistic renderings are provided for reference purposes only, and the actual floor plans, features, and inclusions may vary.
Key facts
- Private bath
- Dual vanity
- Separate shower
Tags
Property features AI
Finance
- HOA & community: Homeowners association with a $45 monthly fee
Exterior
- Parking: Attached 2-car garage; Driveway; 2 covered parking spaces (total 2 parking spaces)
- Utilities: Electricity connected (electric on property); Underground utilities; Septic tank
- Home design: Single-family residence; One level; Under construction
- Construction: Brick and vinyl siding construction; Shingle roof; Slab foundation; Built recently (under construction)
- Exterior features: Landscaped lot; Paved road access; Irrigation equipment
Interior
- Kitchen: Dishwasher; Electric oven; Electric range; Microwave; Refrigerator
- Flooring: Carpet; Vinyl
- Bathrooms: 2 full bathrooms
- Heating & cooling: Central heating; Central electric air conditioning
- Interior features: Breakfast bar; Entrance foyer; Pantry
- Laundry & utility: Washer hookup; Electric water heater
Neighborhood map
What this means for you Summary
Snapshot
- This is a 4-bed/2.0-bath single-family listed at $279k. Condition is rated good.
Deal economics
- At list price, monthly cash flow is $-188 ($-2k/yr) — negative.
- To cash-flow at today's rent, offer at most $251k (9.7% below list).
- To meet the 1% rule (rent ≥ 1% of price), the offer needs to be $226k (19.0% below list).
- Recommended offer: $226k (19.0% below list) — sets the bar for 1% rule.
Location & tenants
- Location reads 72/100 on livability (#74 in GA) — a middle-class / working-renter tenant base. Strengths: cost of living A+, health & safety A+, crime A; Watch: employment D, amenities F, commute F.
- Long County (rural): math 26% / reading 26% proficiency, ranked #115 of 174 in GA (top 66%) — low school quality limits family demand, transient renter base, plan for 1-2y turnover; 61% free/reduced lunch — lower-income household profile, screen leases tightly.
- Zoned schools: Smiley Elementary School (1,258 students, 67% FRL); Long County Middle School (math 21% / reading 27%, grade F, #311 of 470 statewide, top 68%, 945 students, 69% FRL); Long County High School (math 37% / reading 22%, grade F, #140 of 424 statewide, top 35%, 1,209 students, 70% FRL).
- Market conditions: 412 active listings in the ZIP; 1 comparable units currently listed for rent nearby; 298 units permitted in Long County in 2024 (0 in 5+ unit buildings).
- This rent runs 36% of the median local income ($75k/yr) — at the standard rent-burdened threshold; future hikes will face affordability resistance.
Forward outlook
- In year one you build about $5k of equity ($2k loan paydown + $3k appreciation (1.2% local appreciation)).
- Long County population projected at +72% by 2050 — long-run rental-demand tailwind backs the buy-and-hold thesis.
- By year 7, paydown + projected appreciation supports a ~$35k cash-out refi (75% LTV) — recoverable capital for the next deal without selling this one.
Negotiation context
- Only 13 days on market — expect competitive offers; lowballing is unlikely to land.
Risks & watch-outs
- Climate carrying-cost: severe wind risk, 99% chance of damaging wind over 30y; major wildfire risk; extreme-heat days projected 7→18/yr by 2055 (HVAC capex compounding) — expect insurance premiums to compound above CPI over the hold.
Questions for the listing agent
- What do current leases actually rent for vs. the listed asking? Can we see a recent rent roll and the last 12 months of T-12 income?
- What does the HOA fee cover, when was the last increase, and are there any pending special assessments or reserve-fund shortfalls?
- Is there a deadline driving the sale (1031 exchange, divorce, estate, relocation)? That informs how much negotiation room exists.
- Schools are D-rated, which usually means shorter tenancies and higher turnover. Who's the typical renter profile here, and what's been the actual vacancy rate?
- The area grade is low — what's the realistic commute time and amenity access for the typical tenant pool here? Any planned neighborhood developments (good or bad) we should know about?
- What's the average days-on-market for RENTAL listings here right now (not sales)? A rising rental-DOM trend means longer vacancies and softer asking-rent achievability than the comps imply.
- What's the recent tenant-quality profile in this submarket — average credit score on applications, eviction rate, late-payment / NSF rate, and stable-employment percentage? A property-management company in the area should have these aggregated.
- How much new for-sale + rental construction is in the pipeline within 1–3 miles? Heavy new supply typically softens prices + rents 12–24 months out; constrained supply supports both.
Investment metrics
- 1% rule
- 0.81% ✗
- Cap rate
- 5.48%
- Cash-on-cash
- -2.89%
- DSCR
- 0.87
- GRM
- 10.3
CMA / ARV
- ARV (on-the-fly)
- $302,045
- Comps found
- 12
Show comp detail 12 sales within ~0.75 mi
| Address | Dist | Beds/Ba | Sqft | Sold | Price | $/sf | Match |
|---|---|---|---|---|---|---|---|
| 725 Doctor's Creek Rd NE | 0.04mi | 4/2.0 | 1,565 (0%) | 1mo | $278,925 | $178 | 98 |
| 555 Doctor's Creek Rd NE | 0.15mi | 4/2.0 | 1,565 (0%) | 3mo | $277,625 | $177 | 91 |
| 612 Doctor's Creek Rd NE | 0.04mi | 4/2.0 | 1,620 (+4%) | 2mo | $281,325 | $174 | 90 |
| 707 Doctor's Creek Rd NE | 0.04mi | 3/2.0 (-1) | 1,527 (-2%) | 1mo | $274,830 | $180 | 89 |
| 685 Doctor's Creek Rd NE | 0.04mi | 3/2.0 (-1) | 1,380 (-12%) | 2mo | $262,975 | $191 | 72 |
| 241 NE Freshwater Ln | 0.22mi | 3/2.0 (-1) | 1,415 (-10%) | 4mo | $274,900 | $194 | 66 |
| 249 Lanier Rd | 0.42mi | 3/2.0 (-1) | 1,474 (-6%) | 5mo | $279,400 | $190 | 62 |
| 53 Freshwater Ln | 0.37mi | 3/2.0 (-1) | 1,415 (-10%) | 3mo | $274,400 | $194 | 60 |
| 263 Lanier Rd | 0.41mi | 3/2.0 (-1) | 1,415 (-10%) | 3mo | $274,400 | $194 | 58 |
| 52 Freshwater Ln | 0.61mi | 3/2.0 (-1) | 1,474 (-6%) | 3mo | $285,178 | $193 | 54 |
| 92 Freshwater Ln | 0.61mi | 3/2.0 (-1) | 1,473 (-6%) | 4mo | $284,800 | $193 | 53 |
| 74 Freshwater Ln | 0.61mi | 3/2.0 (-1) | 1,415 (-10%) | 1mo | $278,000 | $196 | 50 |
Match score weights: distance 35% · size 25% · config 20% · recency 20%. Top-matched comps best support the ARV.
Projected returns pro-forma
1.16% appreciation · 3.0% rent growth · sell at horizon
- IRR
- -1.1%
- Equity multiple
- 0.94×
- Total profit
- $-4,513
- Equity at exit
- $97,423
- IRR
- 3.7%
- Equity multiple
- 1.46×
- Total profit
- $35,938
- Equity at exit
- $131,268
Cash invested: $78,015 (down + closing). Projections, not guarantees.
Landlord ↔ Tenant lean methodology
- Overall (STATE)
- 90 Strongly Landlord-Friendly
- State Georgia
- 90 Strongly Landlord-Friendly · R+3
- County
- — inherits STATE
- City
- — inherits STATE
ZIP-level market 31316
- Home prices YoY
- 0.6%
- Active inventory
- 412
- Price-to-rent
- 10.3×
Monthly cashflow live
- Estimated rent
- $2,257 medium interval (Pro) →
- Mortgage (P&I)
- −$1,461
- Tax est. 1.5%
- −$348 /mo · $4,179/yr
- Insurance
- −$116
- HOA
- −$45
- Vacancy / Maint / Mgmt
- −$474
- Net cashflow
- $-188
Break-even live
Sensitivity live
| Price | -10% $5 | -5% $-91 | +0% $-188 | +5% $-284 | +10% $-380 |
|---|---|---|---|---|---|
| Rent | -10% $-366 | -5% $-277 | +0% $-188 | +5% $-99 | +10% $-9 |
| Rate | -1.0pp $-47 | -0.5pp $-117 | base $-188 | +0.5pp $-260 | +1.0pp $-333 |
UW: 25.0% down · 7.5% · 30yr · 1.5% tax · 5.0% vac · 8.0% maint · 8.0% mgmt
Financing live
Cash to close
- Down payment
- $69,656
- Closing costs
- $8,359
- Reserves months
- —
- Total cash needed
- —
Loan-product check · same deal, 3 products live
Conventional
25% down · 7.5% · 30yr
- Down + closing
- —
- Monthly P&I
- —
- Monthly cashflow
- —
- DSCR
- —
- Eligible?
- —
Personal DTI + credit; lowest rate.
DSCR
20% down · 8.5% · 30yr
- Down + closing
- —
- Monthly P&I
- —
- Monthly cashflow
- —
- DSCR
- —
- Eligible?
- —
No personal income docs; deal must DSCR.
Hard money
10% down · 12.0% · 12mo
- Down + closing
- —
- Monthly P&I
- —
- Monthly cashflow
- —
- DSCR
- —
- Eligible?
- —
Short-term bridge; refi at stabilization.
Rent comps 1 comps
| Address | Beds | Baths | Sqft | Rent | $/sqft | DOM | Units | Dist |
|---|---|---|---|---|---|---|---|---|
| 15 Clark St Ludowici, GA | 3.0 | 2.0 | 1497 | $1,995 | $1.33 | 45d | 1 | 0.99mi |
HOA detail
- Monthly dues
- $45 · $540/yr
Listing history 13 events
-
2026-06-21days on market $278,625 Active 13 DOM
-
2026-06-19days on market $278,625 Active 11 DOM
-
2026-06-18days on market $278,625 Active 10 DOM
-
2026-06-17days on market $278,625 Active 9 DOM
-
2026-06-16days on market $278,625 Active 8 DOM
-
2026-06-15days on market $278,625 Active 7 DOM
-
2026-06-14days on market $278,625 Active 5 DOM
-
2026-06-13days on market $278,625 Active 4 DOM
-
2026-06-10days on market $278,625 Active 2 DOM
-
2026-06-09days on market $278,625 Active 1 DOM
-
2026-06-08days on market $278,625 Active 3 DOM
-
2026-06-07remarks 599-char remark
-
2026-06-07$278,625 Active 2 DOM
ⓘ Source: listings_history table (triggers on properties + properties_extension) + one-shot
backfill from property_details.listing_events for pre-trigger history.
Climate risk First Street
- Flood 1/10 Low FEMA zone X (unshaded) · 0% chance over 30 yrs
- Wildfire 7/10 Severe
- Heat 8/10 Severe 7 d/yr ≥109°F today · 18 d/yr by 30 yrs out
- Wind 8/10 Severe 99% chance of damaging wind over 30 yrs
- Air quality 2/10 Low 2 unhealthy d/yr today · 2 by 30 yrs out
Nearby sold comps map
Loading sold comps map…
Walkable amenities ~0.75 mi
Loading nearby amenities…
Taxation est. · year 1
- Rental income
- $27,081
- − Mortgage interest
- −$15,607
- − Property taxes
- −$4,179
- − Insurance
- −$1,393
- − Repairs & maintenance
- −$2,166
- − Management
- −$2,166
- − HOA
- −$540
- − Depreciation
- −$8,105
- Taxable loss
- −$7,077
- Est. tax savings @ 24.0%
- +$1,698
- After-tax cash flow
- $-554/yr
For passive investors: Depreciation is non-cash, so a rental often shows a tax loss while cash-flowing — sheltering income. Rental losses are passive: they offset passive income freely, and up to $25,000/yr can offset ordinary (W-2) income if you actively participate and your MAGI is under $100k (phasing out to $0 by $150k); unused losses carry forward. On sale, claimed depreciation is recaptured at up to 25%, and gains may owe capital-gains tax (a 1031 exchange can defer both). Figures are a year-1 estimate at your 24.0% rate — not tax advice; consult a CPA.
Condition & rehab AI · 2 photos
The home is in good condition with a good exterior and interior. It has a good curb appeal and is ready for minor cosmetic updates to enhance its value.
Value-add opportunities
- Both Paint the exterior — Painting the exterior can enhance curb appeal and add value to the home.
- Both Landscaping improvements — Enhancing the landscaping can improve curb appeal and attract potential buyers or renters.
- Both Interior updates — Updating the interior can make the home more appealing and increase its value.
- Both HVAC maintenance — Maintaining the HVAC system ensures comfort and can add value to the home.
- Both Kitchen and bathroom updates — Updating the kitchen and bathrooms can make the home more modern and attractive to potential buyers or renters.
Renovation cost estimate screening
Value-add ROI direction
- Both Paint the exterior — Painting the exterior can enhance curb appeal and add value to the home. ↑
- Both Landscaping improvements — Enhancing the landscaping can improve curb appeal and attract potential buyers or renters. ↑
- Both Interior updates — Updating the interior can make the home more appealing and increase its value. ↑
- Both HVAC maintenance — Maintaining the HVAC system ensures comfort and can add value to the home. ↑
- Both Kitchen and bathroom updates — Updating the kitchen and bathrooms can make the home more modern and attractive to potential buyers or renters. ↑
ⓘ Cost ranges are severity-bucket heuristics (US national rule-of-thumb). Get contractor quotes + a written scope before underwriting a rehab budget.
Schools (NCES district)
- District
- Long County
- NCES district ID
- 1303360
- Math proficiency
- 26% ▼ -14.00%
- Reading proficiency
- 26% ▼ -13.00%
- Median HH income
- $45,958
- Composite
- 22.51/100
- National rank
- #8090
- State rank
- #115 of 174 in GA
Livability — Ludowici
- Score
- 72/100
- State rank
- #74
- US rank
- #6449
Category grades
Schools grade is shown separately in the Schools card above.
Census & demographics
- County
- Long County · 13,812 people
- City population
- 13,812
- Metro
- Hinesville, GA
- Population (ZIP)
- 13,812
- Household income
- $74,766
- Rent vs Own
- Severe rent burden
- 109.0
Population outlook (Long County) Hauer SSP2
- Today (2025)
- 24,669 people
- By 2030
- 28,223 · +14.4%
- By 2040
- 35,430 · +43.6%
- By 2050
- 42,403 · +71.9%
- By 2075
- 56,996 · +131.0%
- By 2100
- 64,185 · +160.2%
Race, ethnicity, and origin ACS 2023
- Neighborhood character
- Diverse neighborhood (Simpson 0.56)
- Race & ethnicity
- White 61% Black 23% Hispanic / Latino 8% Two or more races 8%
- Hispanic origin (detail)
- Mexican 2% Puerto Rican 5%
- Common ancestry
- Serbian 1% Italian 1% Romanian 1%
- Foreign-born
- 3% · Canada
- Languages at home
- 92% English-only · Spanish 6% Other Asian/Pacific 1% German/W. Germanic 1%
Political lean MEDSL · Long
- 2024 margin
- Strong R (+29.5) · D 35.1% · R 64.6%
- 2008→2024 swing
- -5.4pp toward R · 2008: -24.1pp · 2024: -29.5pp
- All cycles
- 2024: R+29.5 2020: R+26.4 2016: R+30.8 2012: R+22.9 2008: R+24.1
Not yet ingested
- Civics
- —
Market trends
- HPI YoY
- ▲ 1.16%
- Current HPI
- 195.2978
- Rent YoY
- —
- Metro
- Hinesville, GA
- State GDP YoY
- ▲ 2.66%
- F500 in state
- 28
Industry mix (Fortune 500 HQ in GA)
| Industry | F500 HQs | Revenue |
|---|---|---|
| Paper / Packaging | 2 | $29B |
|
||
| Retail | 1 | $160B |
|
||
| Transportation / Logistics | 1 | $91B |
|
||
| Airlines | 1 | $62B |
|
||
| Consumer Goods | 1 | $47B |
|
||
| Utilities | 1 | $25B |
|
||
Price history
1 event — show timeline
- 2026-06-05 Listed $278,625 HABR
Cash-flow waterfall
monthlySold comps — $/sqft
last 12 mo · ≤1 miLoading sold comps…