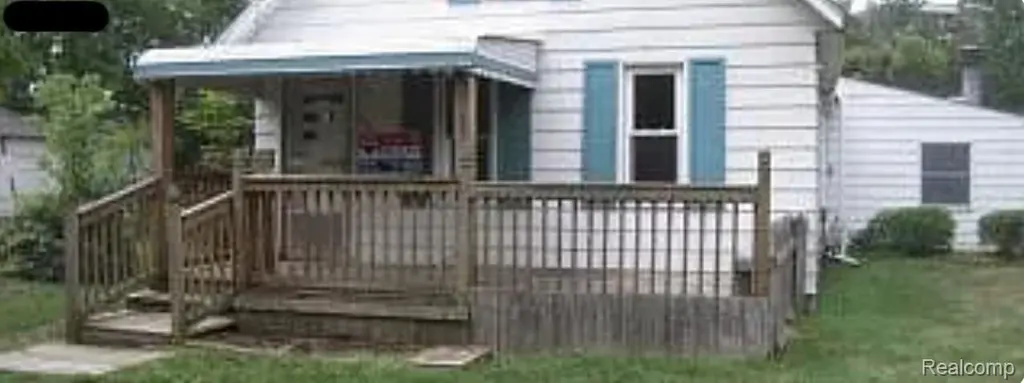
59 Marion Ave · Pontiac, MI
Flood risk 4/10 · Minor
- FEMA flood zone
- X (unshaded)
- Chance of flooding over 30 yrs
- 0.2%
- Est. flood insurance / yr
- $473 – $860
Fire risk 1/10 · Minimal
- Est. fire insurance / yr
- $784 – $1,456
Heat risk 2/10 · Minimal
- Hot days now (above 96°F)
- 7 days/yr
- Hot days in 30 yrs
- 15 days/yr
Wind risk 2/10 · Minimal
- Chance of severe wind over 30 yrs
- —
Air-quality risk 3/10 · Minor
- Unhealthy air days now
- 2 days/yr
- Unhealthy air days in 30 yrs
- 4 days/yr
Risk factors via First Street. Map © Google.
Why this score? — see what drove the B grade
The composite is a weighted blend of 9 inputs, each scored 0–100. Each bar is that input's sub-score; the figure is the points it added to the 100-point composite (weight × sub-score).
- Cash flow +28.5/30.0
- ARV discount +15.0/15.0
- DSCR +10.0/10.0
- 1% rule +8.8/10.0
- Livability +3.2/5.0
- Schools +3.0/10.0
- Rent growth +2.5/5.0
- Condition / age +2.5/5.0
- Appreciation +0.0/10.0
$110,000
🖨 Deal sheet (PDF) 📄 Offer letter ✓ Due diligence
Listing remarks MLS
The home is being sold as is.
Key facts
- 0.3 acre lot
- 3 garage spots
- Built 1926
Property features AI
Exterior
- Parking: Detached 3-car garage
- Utilities: Public water; Public sewer
- Home design: Single-family residence; Two levels; Ground-level entry
- Construction: Aluminum siding
- Exterior features: Paved road access; Lot approximately 0.3 acres (50 x 200)
Interior
- Bathrooms: 1 full bathroom
- Heating & cooling: Forced air heating (natural gas); No central cooling
- Interior features: Crawl space basement; Six total rooms
Neighborhood map
What this means for you Summary
Snapshot
- This is a 3-bed/1.0-bath single-family listed at $110k.
Deal economics
- At list price, monthly cash flow is $358 ($4k/yr) — positive.
- The deal already cash-flows at list — no discount required.
- Meets the 1% rule at list price ($2k rent vs $110k).
- Cap rate 10.2% vs local median 6.7% in Pontiac — top-decile yield for the area; either an underpriced asset or a hidden risk that comps aren't pricing in. Stress-test before assuming the spread holds.
Location & tenants
- Location reads 64/100 on livability (#499 in MI) — a middle-class / working-renter tenant base. Strengths: commute A+, cost of living A+, housing A+; Watch: health & safety D, schools F, crime F.
- Waterford School District (suburban): math 26% / reading 42% proficiency, ranked #285 of 540 in MI (top 53%) — families likely to look elsewhere, expect single-tenant / working-renter base with shorter leases.
- Market conditions: 144 active listings in the ZIP; 11 comparable units currently listed for rent nearby; rentals at typical pace (median 23d on market — plan ~3-4 weeks tenant-placement turnaround); 2,614 units permitted in Oakland County in 2024 (721 in 5+ unit buildings).
Forward outlook
- Local home prices are declining (-3.0%/yr); year-one equity from $761 of loan paydown is wiped out by about $3k of value loss. Plan a longer hold.
- Oakland County population projected at +10% by 2050 — modest demand growth; plan on rents tracking national, not racing it.
- At projected returns (-3.0% appreciation + 3.0% rent growth), your $31k cash investment doubles in ~9 years — after that, you're playing with house money.
Negotiation context
- Only 4 days on market — expect competitive offers; lowballing is unlikely to land.
- 12 sale attempts since 22y ago with the ask held roughly flat each time — persistent listings suggest the price (not the market) is what's stuck; bring a comps-based counter.
- Current owner paid $23k; list at $110k implies a 378% gain — meaningful room to come down on a strong offer.
Risks & watch-outs
- Watch-outs: built in 1926 — expect roof / HVAC / electrical / plumbing capex.
Questions for the listing agent
- Built in 1926 — when were the roof, HVAC, electrical panel, plumbing, and water heater last replaced?
- Is there a deadline driving the sale (1031 exchange, divorce, estate, relocation)? That informs how much negotiation room exists.
- Schools are F-rated, which usually means shorter tenancies and higher turnover. Who's the typical renter profile here, and what's been the actual vacancy rate?
- Crime grade is F in this area — have there been break-ins, vandalism, or insurance claims at this property in the last 3 years? What carrier currently insures it and at what premium?
- What's the average days-on-market for RENTAL listings here right now (not sales)? A rising rental-DOM trend means longer vacancies and softer asking-rent achievability than the comps imply.
- What's the recent tenant-quality profile in this submarket — average credit score on applications, eviction rate, late-payment / NSF rate, and stable-employment percentage? A property-management company in the area should have these aggregated.
- How much new for-sale + rental construction is in the pipeline within 1–3 miles? Heavy new supply typically softens prices + rents 12–24 months out; constrained supply supports both.
Investment metrics
- 1% rule
- 1.38% ✓
- Cap rate
- 10.20%
- Cash-on-cash
- 13.96%
- DSCR
- 1.62
- GRM
- 6.0
CMA / ARV
- ARV (on-the-fly)
- $193,361
- Comps found
- 12
Show comp detail 12 sales within ~0.75 mi
| Address | Dist | Beds/Ba | Sqft | Sold | Price | $/sf | Match |
|---|---|---|---|---|---|---|---|
| 148 Marion Ave | 0.09mi | 3/1.0 | 1,272 (+6%) | 1mo | $250,000 | $197 | 85 |
| 1160 La Salle Ave | 0.30mi | 2/1.0 (-1) | 1,204 (+0%) | 3mo | $90,000 | $75 | 78 |
| 1110 Myrtle Ave | 0.48mi | 3/1.0 | 1,200 (-0%) | 1mo | $193,000 | $161 | 77 |
| 2803 Old Orchard Dr | 0.39mi | 2/1.5 (-1) | 1,194 (-1%) | 3mo | $225,000 | $188 | 72 |
| 1068 LA Salle Ave | 0.39mi | 3/2.0 | 1,191 (-1%) | 6mo | $217,500 | $183 | 71 |
| 114 Waterly Ave | 0.66mi | 3/1.0 | 1,190 (-1%) | 1mo | $160,000 | $134 | 67 |
| 3066 W Huron St | 0.56mi | 3/1.0 | 1,148 (-4%) | 5mo | $180,000 | $157 | 62 |
| 3118 Fernbarry Ct | 0.58mi | 3/1.5 | 1,278 (+6%) | 2mo | $259,900 | $203 | 59 |
| 1155 Lakeview St | 0.54mi | 3/1.5 | 1,090 (-9%) | 5mo | $145,000 | $133 | 53 |
| 98 S Tilden Ave | 0.74mi | 3/2.0 | 1,170 (-3%) | 12mo | $138,500 | $118 | 47 |
| 3070 Old Orchard Dr | 0.50mi | 3/1.5 | 1,342 (+12%) | 10mo | $225,000 | $168 | 47 |
| 2546 Woodbine Dr | 0.67mi | 2/1.0 (-1) | 1,064 (-11%) | 9mo | $158,000 | $148 | 37 |
Match score weights: distance 35% · size 25% · config 20% · recency 20%. Top-matched comps best support the ARV.
Projected returns pro-forma
-3.0% appreciation · 3.0% rent growth · sell at horizon
- IRR
- 4.3%
- Equity multiple
- 1.16×
- Total profit
- $5,076
- Equity at exit
- $16,401
- IRR
- 13.8%
- Equity multiple
- 2.11×
- Total profit
- $34,110
- Equity at exit
- $9,511
Cash invested: $30,800 (down + closing). Projections, not guarantees.
Landlord ↔ Tenant lean methodology
- Overall (STATE)
- 62 Landlord-Friendly
- State Michigan
- 62 Landlord-Friendly · EVEN
- County
- — inherits STATE
- City
- — inherits STATE
ZIP-level market 48328
- Active inventory
- 144
- Price-to-rent
- 6.0×
Monthly cashflow live
- Estimated rent
- $1,519 high interval (Pro) →
- Mortgage (P&I)
- −$577
- Tax from tax record
- −$219 /mo · $2,622/yr
- Insurance
- −$46
- HOA
- −$0
- Vacancy / Maint / Mgmt
- −$319
- Net cashflow
- $358
Break-even live
Sensitivity live
| Price | -10% $421 | -5% $390 | +0% $358 | +5% $327 | +10% $296 |
|---|---|---|---|---|---|
| Rent | -10% $238 | -5% $298 | +0% $358 | +5% $418 | +10% $478 |
| Rate | -1.0pp $414 | -0.5pp $386 | base $358 | +0.5pp $330 | +1.0pp $301 |
UW: 25.0% down · 7.5% · 30yr · 1.5% tax · 5.0% vac · 8.0% maint · 8.0% mgmt
Financing live
Cash to close
- Down payment
- $27,500
- Closing costs
- $3,300
- Reserves months
- —
- Total cash needed
- —
Loan-product check · same deal, 3 products live
Conventional
25% down · 7.5% · 30yr
- Down + closing
- —
- Monthly P&I
- —
- Monthly cashflow
- —
- DSCR
- —
- Eligible?
- —
Personal DTI + credit; lowest rate.
DSCR
20% down · 8.5% · 30yr
- Down + closing
- —
- Monthly P&I
- —
- Monthly cashflow
- —
- DSCR
- —
- Eligible?
- —
No personal income docs; deal must DSCR.
Hard money
10% down · 12.0% · 12mo
- Down + closing
- —
- Monthly P&I
- —
- Monthly cashflow
- —
- DSCR
- —
- Eligible?
- —
Short-term bridge; refi at stabilization.
Rent comps 11 comps
| Address | Beds | Baths | Sqft | Rent | $/sqft | DOM | Units | Dist |
|---|---|---|---|---|---|---|---|---|
| 59 N Lynn Ave Waterford, MI | 3.0 | 1.0 | 1300 | $2,100 | $1.62 | 3d | 1 | 0.32mi |
| 949 Boston Ave Unit 1 Waterford Township, MI | 2.0 | 1.0 | 1220 | $1,150 | $0.94 | 22d | 1 | 0.54mi |
| 949 Boston Ave Waterford Twp, MI | 2.0 | 1.0 | 1320 | $1,150 | $0.87 | 44d | 1 | 0.54mi |
| 2750 Cherokee Dr Waterford Twp, MI | 1.0–2.0 | 1.0 | 1000 | $1,389 | $1.39 | 0d | 8 | 0.54mi |
| 995 Lakeview St Waterford, MI | 2.0 | 1.5 | 884 | $1,375 | $1.56 | 25d | 1 | 0.67mi |
| 223 Tucker St Pontiac, MI | 2.0 | 2.5 | 1295 | $1,700 | $1.31 | 18d | 1 | 0.85mi |
| 60 Waldo St Pontiac, MI | 3.0 | 1.0 | 1100 | $1,500 | $1.36 | 5d | 1 | 1.02mi |
| 38 Spokane Dr Pontiac, MI | 2.0 | 1.0 | 1000 | $1,000 | $1.00 | 44d | 1 | 1.02mi |
| 950 Village Green Ln Waterford Twp, MI | 1.0–2.0 | 1.0–2.0 | 811 | $1,294 | $1.60 | 2d | 12 | 1.13mi |
| 99 Chippewa Rd Pontiac, MI | 4.0 | 1.0 | 1315 | $1,750 | $1.33 | 25d | 1 | 1.14mi |
| 311 S Telegraph Rd Pontiac, MI | 1.0–2.0 | 1.0 | 732 | $1,200 | $1.64 | 44d | 1 | 1.21mi |
Listing history 26 events
-
2026-06-01status $110,000 Pending 4 DOM
-
2026-05-31days on market $110,000 Active 4 DOM
-
2026-05-28$110,000 Active
-
2026-05-27$110,000 Active 29-char remark
Show marketing remark (29 chars)
The home is being sold as is.
-
2013-01-11soldstatus $23,000 163-char remark
Show marketing remark (163 chars)
3 BEDROOM ALUMINUM BUNGALOW, FORMAL LIVING ROOM, KITCHEN OPENS UP TO FAMILY ROOM WITH FIREPLACE, 1ST FLOOR BATH, FRONT PORCH, 2 CAR ATTACHED GARAGE 1 CAR DETACHED.
-
2013-01-11soldstatus $23,000
Show marketing remark (163 chars)
3 BEDROOM ALUMINUM BUNGALOW, FORMAL LIVING ROOM, KITCHEN OPENS UP TO FAMILY ROOM WITH FIREPLACE, 1ST FLOOR BATH, FRONT PORCH, 2 CAR ATTACHED GARAGE 1 CAR DETACHED.
-
2012-12-28historical
-
2012-12-12$23,000 163-char remark
Show marketing remark (163 chars)
3 BEDROOM ALUMINUM BUNGALOW, FORMAL LIVING ROOM, KITCHEN OPENS UP TO FAMILY ROOM WITH FIREPLACE, 1ST FLOOR BATH, FRONT PORCH, 2 CAR ATTACHED GARAGE 1 CAR DETACHED.
-
2012-12-12$23,000
Show marketing remark (163 chars)
3 BEDROOM ALUMINUM BUNGALOW, FORMAL LIVING ROOM, KITCHEN OPENS UP TO FAMILY ROOM WITH FIREPLACE, 1ST FLOOR BATH, FRONT PORCH, 2 CAR ATTACHED GARAGE 1 CAR DETACHED.
-
2012-11-30historical
-
2012-11-30historical
-
2012-11-13$23,000
-
2012-11-13$23,000
-
2012-11-09historical
-
2012-11-09historical
-
2012-08-02$23,000
-
2012-08-02$23,000
-
2004-11-18soldstatus $119,900
-
2004-09-30soldstatus $119,900
-
2004-08-20$119,900
-
2004-08-20historical
-
2004-07-30$129,900
-
2004-07-30historical
-
2004-07-07historical
-
2004-07-06$139,900
-
2004-06-08$149,900
ⓘ Source: listings_history table (triggers on properties + properties_extension) + one-shot
backfill from property_details.listing_events for pre-trigger history.
Tax reassessment forecast MI · Partial reset (capped growth)
- Current annual tax
- $2,622 · $219/mo
- Projected year-2 tax
- $2,622 · $219/mo
- Expected delta
- $0/yr ($0/mo · 0.0%)
ⓘ Screening estimate from a state-policy table — verify with the county assessor before closing.
Climate risk First Street
- Flood 4/10 Moderate FEMA zone X (unshaded) · 20% chance over 30 yrs
- Wildfire 1/10 Low
- Heat 2/10 Low 7 d/yr ≥96°F today · 15 d/yr by 30 yrs out
- Wind 2/10 Low
- Air quality 3/10 Moderate 2 unhealthy d/yr today · 4 by 30 yrs out
Nearby sold comps map
Loading sold comps map…
Walkable amenities ~0.75 mi
Loading nearby amenities…
Taxation est. · year 1
- Rental income
- $18,222
- − Mortgage interest
- −$6,162
- − Property taxes
- −$2,622
- − Insurance
- −$550
- − Repairs & maintenance
- −$1,458
- − Management
- −$1,458
- − Depreciation
- −$3,200
- Taxable income
- $2,773
- Est. tax owed @ 24.0%
- −$665
- After-tax cash flow
- $3,636/yr
For passive investors: Depreciation is non-cash, so a rental often shows a tax loss while cash-flowing — sheltering income. Rental losses are passive: they offset passive income freely, and up to $25,000/yr can offset ordinary (W-2) income if you actively participate and your MAGI is under $100k (phasing out to $0 by $150k); unused losses carry forward. On sale, claimed depreciation is recaptured at up to 25%, and gains may owe capital-gains tax (a 1031 exchange can defer both). Figures are a year-1 estimate at your 24.0% rate — not tax advice; consult a CPA.
Schools (NCES district)
- District
- Waterford School District
- NCES district ID
- 2635310
- Math proficiency
- 26% ▼ -5.00%
- Reading proficiency
- 42% ▼ -1.00%
- Median HH income
- $55,581
- Composite
- 29.99/100
- National rank
- #6364
- State rank
- #285 of 540 in MI
Livability — Pontiac
- Score
- 64/100
- State rank
- #499
- US rank
- #14703
Category grades
Schools grade is shown separately in the Schools card above.
Census & demographics
- County
- Oakland County · 1,009,092 people
- City population
- 44,593
- Metro
- Detroit-Warren-Dearborn, MI
- Population (ZIP)
- 24,478
- Household income
- $72,299
- Rent vs Own
- Severe rent burden
- 1013.0
Population outlook (Oakland County) Hauer SSP2
- Today (2025)
- 1,335,747 people
- By 2030
- 1,375,100 · +2.9%
- By 2040
- 1,435,385 · +7.5%
- By 2050
- 1,469,250 · +10.0%
- By 2075
- 1,531,946 · +14.7%
- By 2100
- 1,450,485 · +8.6%
Race, ethnicity, and origin ACS 2023
- Neighborhood character
- Predominantly White (73%)
- Race & ethnicity
- White 73% Hispanic / Latino 10% Two or more races 9% Black 9% Asian 2%
- Hispanic origin (detail)
- Mexican 7% Puerto Rican 1%
- Common ancestry
- Romanian 7% Lithuanian 3% Slovak 3%
- Foreign-born
- 6% · Canada
- Languages at home
- 90% English-only · Spanish 4% Other Asian/Pacific 2% Russian/Polish/Slavic 2%
Political lean MEDSL · Oakland
- 2024 margin
- D (+10.6) · D 54.4% · R 43.8% · Other 1.9%
- 2008→2024 swing
- -3.9pp toward R · 2008: 14.5pp · 2024: 10.6pp
- All cycles
- 2024: D+10.6 2020: D+14.1 2016: D+8.1 2012: D+8.1 2008: D+14.5
Not yet ingested
- Civics
- —
Market trends
- HPI YoY
- ▼ -249.13%
- Current HPI
- 191.2771
- Rent YoY
- —
- Metro
- Detroit-Warren-Dearborn, MI
- State GDP YoY
- ▲ 1.37%
- F500 in state
- 28
Industry mix (Fortune 500 HQ in MI)
| Industry | F500 HQs | Revenue |
|---|---|---|
| Automotive Parts | 3 | $48B |
|
||
| Automotive | 2 | $372B |
|
||
| Chemicals | 1 | $45B |
|
||
| Automotive Retail | 1 | $29B |
|
||
| Healthcare / Medical Devices | 1 | $23B |
|
||
| Automotive Technology | 1 | $20B |
|
||
Price history
-26.6% since first listed24 events — show timeline
- 2026-05-28 Listed $110,000 REALCOMP
- 2026-05-27 Listed $110,000 MiRealSource-MiMLS
- 2013-01-11 Sold (MLS) $23,000 MiRealSource-MiMLS
- 2013-01-11 Sold (MLS) $23,000 REALCOMP
- 2012-12-28 Listing Removed — MiRealSource-MiMLS
- 2012-12-12 Listed $23,000 MiRealSource-MiMLS
- 2012-12-12 Listed $23,000 REALCOMP
- 2012-11-30 Listing Removed — REALCOMP
- 2012-11-30 Listing Removed — MiRealSource-MiMLS
- 2012-11-13 Listed $23,000 REALCOMP
- 2012-11-13 Listed $23,000 MiRealSource-MiMLS
- 2012-11-09 Listing Removed — REALCOMP
- 2012-11-09 Listing Removed — MiRealSource-MiMLS
- 2012-08-02 Listed $23,000 REALCOMP
- 2012-08-02 Listed $23,000 MiRealSource-MiMLS
- 2004-11-18 Sold (Public Records) $119,900 Public Records
- 2004-09-30 Sold (MLS) $119,900 REALCOMP
- 2004-08-20 Listing Removed — REALCOMP
- 2004-08-20 Listed $119,900 REALCOMP
- 2004-07-30 Listing Removed — REALCOMP
- 2004-07-30 Listed $129,900 REALCOMP
- 2004-07-07 Listing Removed — REALCOMP
- 2004-07-06 Listed $139,900 REALCOMP
- 2004-06-08 Listed $149,900 REALCOMP
Property tax history
+0.4%/yrLatest (2025): $2,622 · +46.1% YoY. Source: county tax records.
Cash-flow waterfall
monthlySold comps — $/sqft
last 12 mo · ≤1 miLoading sold comps…