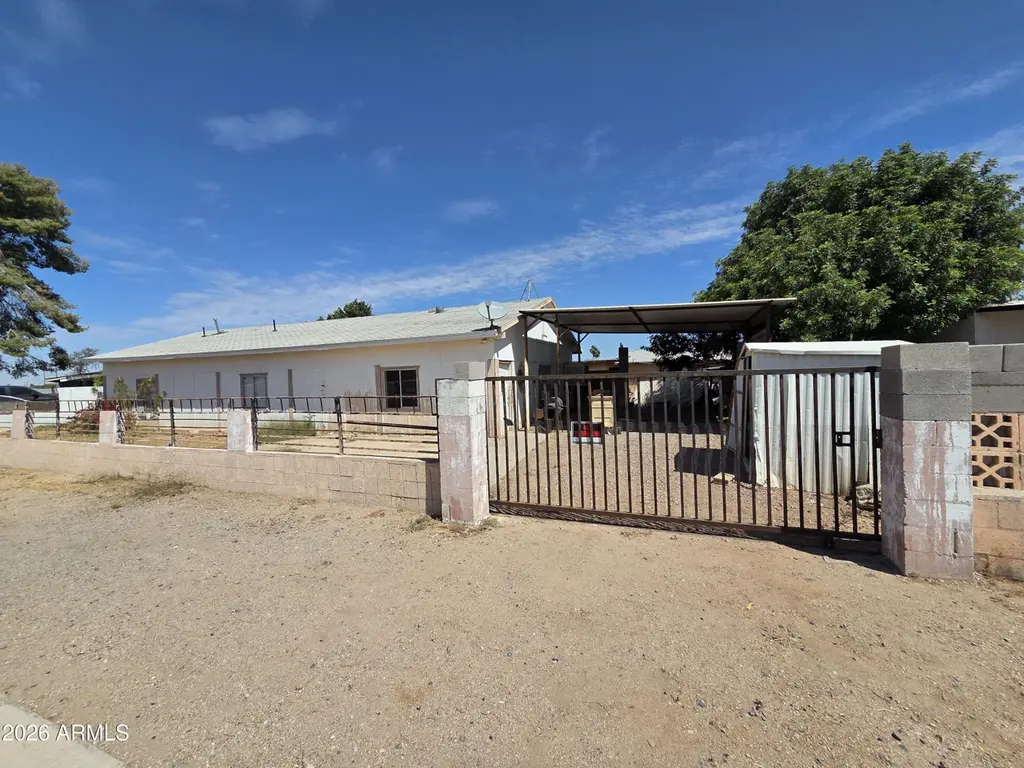
6934 W Greenway Rd · Glendale, AZ
Flood risk 1/10 · Minimal
- FEMA flood zone
- X (shaded)
- Chance of flooding over 30 yrs
- 0.0%
- Est. flood insurance / yr
- $507 – $1,088
Fire risk 1/10 · Minimal
- Est. fire insurance / yr
- $610 – $1,132
Heat risk 9/10 · Severe
- Hot days now (above 112°F)
- 7 days/yr
- Hot days in 30 yrs
- 19 days/yr
Wind risk 1/10 · Minimal
- Chance of severe wind over 30 yrs
- —
Air-quality risk 3/10 · Minor
- Unhealthy air days now
- 3 days/yr
- Unhealthy air days in 30 yrs
- 3 days/yr
Risk factors via First Street. Map © Google.
Why this score? — see what drove the C+ grade
The composite is a weighted blend of 9 inputs, each scored 0–100. Each bar is that input's sub-score; the figure is the points it added to the 100-point composite (weight × sub-score).
- Cash flow +24.5/30.0
- ARV discount +15.0/15.0
- DSCR +7.9/10.0
- 1% rule +5.0/10.0
- Livability +3.8/5.0
- Schools +3.5/10.0
- Condition / age +2.5/5.0
- Rent growth +2.3/5.0
- Appreciation +0.0/10.0
$167,500
🖨 Deal sheet 📄 Offer letter ✓ Due diligence
Listing remarks
Fixer upper. Endless possibilities. Fix and rent/sell the mobile home that is there, bring a new mobile home in or you are able to build in that community.
Key facts
- 9,131 sq ft lot
- Built 1972
- Listed 31 days
Property features AI
Finance
- Other: Lot size approximately 9,131 sq ft
- Financial info: Private financing
- HOA & community: No association fees
Exterior
- Utilities: City water; Public sewer
- Home design: Manufactured/Mobile home; Fee simple ownership
- Construction: Board & batten siding; Wood frame construction; Composition roof
- Exterior features: Dirt front yard; Dirt back yard; Block fencing
Interior
- Kitchen: Eat-in kitchen
- Bedrooms: 3 possible bedrooms
- Bathrooms: 1 full bathroom; 1 half bathroom (2 total bathrooms)
- Heating & cooling: Window/Wall unit cooling; No heating system
- Interior features: Eat-in kitchen
- Laundry & utility: No laundry hookups
Neighborhood map
What this means for you Summary
Snapshot
- This is a 3-bed/1.5-bath manufactured listed at $168k.
Deal economics
- At list price, monthly cash flow is $344 ($4k/yr) — positive.
- The deal already cash-flows at list — no discount required.
- Meets the 1% rule at list price ($2k rent vs $168k).
- Recommended offer: $162k (3.0% below list) — sets the bar for market timing.
- Cap rate 8.8% vs local median 3.5% in Glendale — top-decile yield for the area; either an underpriced asset or a hidden risk that comps aren't pricing in. Stress-test before assuming the spread holds.
Location & tenants
- Location reads 76/100 on livability (#12 in AZ, #3,235 nationally) — a middle-class / working-renter tenant base. Strengths: commute A+, housing A+, amenities B; Watch: health & safety D+, crime F.
- Peoria Unified School District (4237) (suburban): math 36% / reading 42% proficiency, ranked #64 of 249 in AZ (top 26%) — families likely to look elsewhere, expect single-tenant / working-renter base with shorter leases.
- Market conditions: Rents soft (-0.8%/yr); 113 active listings in the ZIP; 5 comparable units currently listed for rent nearby; rentals leasing fast (median 2d on market — plan ~1-2 weeks tenant-placement turnaround); solid renter incomes; 36,011 units permitted in Maricopa County in 2024 (12,801 in 5+ unit buildings).
Forward outlook
- Local home prices are declining (-3.0%/yr); year-one equity from $1k of loan paydown is wiped out by about $5k of value loss. Plan a longer hold.
- Maricopa County population projected at +38% by 2050 — long-run rental-demand tailwind backs the buy-and-hold thesis.
Negotiation context
- It's been on market 32 days — a 3% lower offer ($162k) is reasonable based on typical stale-listing flexibility.
- Current owner paid $140k; 20% above their basis — modest negotiation headroom, anchor on the comps not their cost.
Risks & watch-outs
- Climate carrying-cost: extreme-heat days projected 7→19/yr by 2055 (HVAC capex compounding) — expect insurance premiums to compound above CPI over the hold.
Questions for the listing agent
- It's been on market 32 days. Have you received any prior offers? Is the seller open to a 3% concession, seller financing, or rate buy-down credit?
- Built in 1972 — when were the roof, HVAC, electrical panel, plumbing, and water heater last replaced?
- Is there a deadline driving the sale (1031 exchange, divorce, estate, relocation)? That informs how much negotiation room exists.
- Crime grade is F in this area — have there been break-ins, vandalism, or insurance claims at this property in the last 3 years? What carrier currently insures it and at what premium?
- What's the average days-on-market for RENTAL listings here right now (not sales)? A rising rental-DOM trend means longer vacancies and softer asking-rent achievability than the comps imply.
- What's the recent tenant-quality profile in this submarket — average credit score on applications, eviction rate, late-payment / NSF rate, and stable-employment percentage? A property-management company in the area should have these aggregated.
- How much new for-sale + rental construction is in the pipeline within 1–3 miles? Heavy new supply typically softens prices + rents 12–24 months out; constrained supply supports both.
Investment metrics
- 1% rule
- 1.00% ✓
- Cap rate
- 8.75%
- Cash-on-cash
- 8.79%
- DSCR
- 1.39
- GRM
- 8.3
CMA / ARV
- ARV (median comp)
- $240,752
- List price
- $167,500
- Delta
- -30.43%
- Verdict
- UNDERPRICED
- Comps
- 1 within 2.0 mi
Show comp detail 1 sale within ~0.75 mi
| Address | Dist | Beds/Ba | Sqft | Sold | Price | $/sf | Match |
|---|---|---|---|---|---|---|---|
| 7002 W Karen Lee Ln | 0.11mi | 2/1.0 (-1) | 673 (-6%) | 17mo | $242,000 | $360 | 63 |
Match score weights: distance 35% · size 25% · config 20% · recency 20%. Top-matched comps best support the ARV.
Projected returns pro-forma
-3.0% appreciation · 0.0% rent growth · sell at horizon
- IRR
- -6.1%
- Equity multiple
- 0.78×
- Total profit
- $-10,253
- Equity at exit
- $24,975
- IRR
- -0.0%
- Equity multiple
- 1.00×
- Total profit
- $-78
- Equity at exit
- $14,482
Cash invested: $46,900 (down + closing). Projections, not guarantees.
Landlord ↔ Tenant lean methodology
- Overall (STATE)
- 87 Strongly Landlord-Friendly
- State Arizona
- 87 Strongly Landlord-Friendly · R+3
- County
- — inherits STATE
- City
- — inherits STATE
ZIP-level market 85381
- Home prices YoY
- -20.6%
- Rents YoY
- -0.8%
- Active inventory
- 113
- Price-to-rent
- 8.3×
Monthly cashflow live
- Estimated rent
- $1,677 high interval (Pro) →
- Mortgage (P&I)
- −$878
- Tax from tax record
- −$33 /mo · $398/yr
- Insurance
- −$70
- HOA
- −$0
- Vacancy / Maint / Mgmt
- −$352
- Net cashflow
- $344
Break-even live
UW: 25.0% down · 7.5% · 30yr · 1.5% tax · 5.0% vac · 8.0% maint · 8.0% mgmt
Financing live
Cash to close
- Down payment
- $41,875
- Closing costs
- $5,025
- Reserves months
- —
- Total cash needed
- —
Loan-product check · same deal, 3 products live
Conventional
25% down · 7.5% · 30yr
- Down + closing
- —
- Monthly P&I
- —
- Monthly cashflow
- —
- DSCR
- —
- Eligible?
- —
Personal DTI + credit; lowest rate.
DSCR
20% down · 8.5% · 30yr
- Down + closing
- —
- Monthly P&I
- —
- Monthly cashflow
- —
- DSCR
- —
- Eligible?
- —
No personal income docs; deal must DSCR.
Hard money
10% down · 12.0% · 12mo
- Down + closing
- —
- Monthly P&I
- —
- Monthly cashflow
- —
- DSCR
- —
- Eligible?
- —
Short-term bridge; refi at stabilization.
Rent comps 5 comps
| Address | Beds | Baths | Sqft | Rent | $/sqft | DOM | Units | Dist |
|---|---|---|---|---|---|---|---|---|
| 16601 N 75th Ave Peoria, AZ | 1.0–3.0 | 1.0–2.0 | 1042 | $2,378 | $2.28 | 2d | 24 | 0.89mi |
| 6451 W Bell Rd Glendale, AZ | 2.0 | 1.0–2.0 | 630 | $1,285 | $2.04 | 1d | 107 | 1.10mi |
| 5959 W Greenway Rd Glendale, AZ | 1.0–2.0 | 1.0–2.0 | 735 | $1,357 | $1.85 | 1d | 10 | 1.18mi |
| 15050 N 59th Ave Glendale, AZ | 1.0–2.0 | 1.0–2.0 | 775 | $1,499 | $1.93 | 1d | 7 | 1.22mi |
| 15010 N 59th Ave Glendale, AZ | 1.0–2.0 | 1.0–2.0 | 637 | $1,445 | $2.27 | 2d | 13 | 1.27mi |
Listing history 12 events
-
2026-06-09days on market $167,500 Active 32 DOM
-
2026-06-08days on market $167,500 Active 31 DOM
-
2026-06-07days on market $167,500 Active 30 DOM
-
2026-06-04days on market $167,500 Active 27 DOM
-
2026-06-03days on market $167,500 Active 26 DOM
-
2026-06-02days on market $167,500 Active 25 DOM
-
2026-06-01days on market $167,500 Active 24 DOM
-
2026-05-31days on market $167,500 Active 23 DOM
-
2026-05-08$167,500 Active 155-char remark
-
2026-04-17soldstatus $85,000
-
1989-04-28soldstatus $45,000
-
1976-12-13soldstatus $5,000
ⓘ Source: listings_history table (triggers on properties + properties_extension) + one-shot
backfill from property_details.listing_events for pre-trigger history.
Tax reassessment forecast AZ · Resets to sale price
- Current annual tax
- $398 · $33/mo
- Projected year-2 tax
- $1,106 · $92/mo
- Expected delta
- +$707/yr (+$59/mo · 177.4%)
ⓘ Screening estimate from a state-policy table — verify with the county assessor before closing.
Climate risk First Street
- Flood 1/10 Low FEMA zone X (shaded) · 0% chance over 30 yrs
- Wildfire 1/10 Low
- Heat 9/10 Extreme 7 d/yr ≥112°F today · 19 d/yr by 30 yrs out
- Wind 1/10 Low
- Air quality 3/10 Moderate 3 unhealthy d/yr today · 3 by 30 yrs out
Nearby sold comps map
Loading sold comps map…
Walkable amenities ~0.75 mi
Loading nearby amenities…
Taxation est. · year 1
- Rental income
- $20,127
- − Mortgage interest
- −$9,383
- − Property taxes
- −$398
- − Insurance
- −$838
- − Repairs & maintenance
- −$1,610
- − Management
- −$1,610
- − Depreciation
- −$4,873
- Taxable income
- $1,415
- Est. tax owed @ 24.0%
- −$340
- After-tax cash flow
- $3,784/yr
For passive investors: Depreciation is non-cash, so a rental often shows a tax loss while cash-flowing — sheltering income. Rental losses are passive: they offset passive income freely, and up to $25,000/yr can offset ordinary (W-2) income if you actively participate and your MAGI is under $100k (phasing out to $0 by $150k); unused losses carry forward. On sale, claimed depreciation is recaptured at up to 25%, and gains may owe capital-gains tax (a 1031 exchange can defer both). Figures are a year-1 estimate at your 24.0% rate — not tax advice; consult a CPA.
Schools (NCES district)
- District
- Peoria Unified School District (4237)
- NCES district ID
- 0406250
- Math proficiency
- 36% ▼ -14.00%
- Reading proficiency
- 42% ▼ -8.00%
- Median HH income
- $60,171
- Composite
- 34.62/100
- National rank
- #5152
- State rank
- #64 of 249 in AZ
Livability — Glendale
- Score
- 76/100
- State rank
- #12
- US rank
- #3235
Category grades
Schools grade is shown separately in the Schools card above.
Census & demographics
- Census place
- Glendale, AZ
- County
- Maricopa County · 4,537,380 people
- City population
- 294,586
- Metro
- Phoenix-Mesa-Chandler, AZ
- Population (ZIP)
- 27,650
- Household income
- $96,746
- Rent vs Own
- Severe rent burden
- 1114.0
Population outlook (Maricopa County) Hauer SSP2
- Today (2025)
- 4,979,203 people
- By 2030
- 5,378,229 · +8.0%
- By 2040
- 6,156,598 · +23.6%
- By 2050
- 6,872,376 · +38.0%
- By 2075
- 8,401,270 · +68.7%
- By 2100
- 9,247,439 · +85.7%
Race, ethnicity, and origin ACS 2023
- Neighborhood character
- Predominantly White (69%)
- Race & ethnicity
- White 69% Hispanic / Latino 21% Two or more races 11% Asian 3% Black 2%
- Hispanic origin (detail)
- Mexican 17% Puerto Rican 2%
- Common ancestry
- Lithuanian 4% Slovak 3% Iranian 2%
- Foreign-born
- 7% · Canada, Vietnam, China
- Languages at home
- 89% English-only · Spanish 7% Vietnamese 1% Chinese 1%
Political lean MEDSL · Maricopa
- 2024 margin
- Toss-up / Even · D 47.7% · R 51.2% · Other 1.1%
- 2008→2024 swing
- +7.1pp toward D · 2008: -10.6pp · 2024: -3.5pp
- All cycles
- 2024: R+3.5 2020: D+2.2 2016: R+3.5 2012: R+12.0 2008: R+10.6
Not yet ingested
- Civics
- —
Market trends
- HPI YoY
- ▼ -74.78%
- Current HPI
- 288.2663
- Rent YoY
- ▼ -0.80%
- Metro
- Phoenix-Mesa-Chandler, AZ
- State GDP YoY
- ▲ 4.54%
- F500 in state
- 20
Industry mix (Fortune 500 HQ in AZ)
| Industry | F500 HQs | Revenue |
|---|---|---|
| Technology | 2 | $13B |
|
||
| Mining / Metals | 1 | $23B |
|
||
| Environmental Services | 1 | $16B |
|
||
| Metals / Steel | 1 | $14B |
|
||
| Technology Distribution | 1 | $9B |
|
||
| Homebuilding | 1 | $8B |
|
||
Price history
+2700.0% since first listed6 events — show timeline
- 2026-06-11 Sold (Public Records) $140,000 Public Records
- 2026-06-11 Listing Removed — ARMLS
- 2026-05-08 Listed $167,500 ARMLS
- 2026-04-17 Sold (Public Records) $85,000 Public Records
- 1989-04-28 Sold (Public Records) $45,000 Public Records
- 1976-12-13 Sold (Public Records) $5,000 Public Records
Property tax history
-2.1%/yrLatest (2025): $398 · +2.4% YoY. Source: county tax records.
Cash-flow waterfall
monthlySold comps — $/sqft
last 12 mo · ≤1 miLoading sold comps…