 Duplex
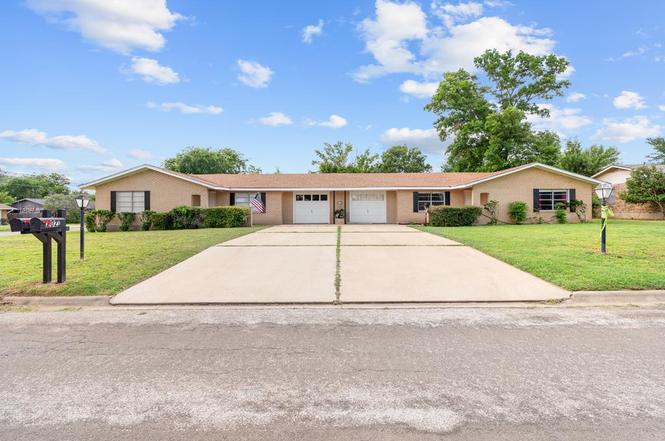
202 Manor Dr · Kerrville, TX
Flood risk 1/10 · Minimal
- FEMA flood zone
- X (unshaded)
- Chance of flooding over 30 yrs
- 0.0%
- Est. flood insurance / yr
- $507 – $1,088
Fire risk 5/10 · Moderate
- Est. fire insurance / yr
- $1,222 – $2,270
Heat risk 6/10 · Moderate
- Hot days now (above 103°F)
- 7 days/yr
- Hot days in 30 yrs
- 23 days/yr
Wind risk 6/10 · Moderate
- Chance of severe wind over 30 yrs
- 52.0%
Air-quality risk 1/10 · Minimal
- Unhealthy air days now
- 0 days/yr
- Unhealthy air days in 30 yrs
- 0 days/yr
Risk factors via First Street. Map © Google.
Why this score? — see what drove the D+ grade
The composite is a weighted blend of 9 inputs, each scored 0–100. Each bar is that input's sub-score; the figure is the points it added to the 100-point composite (weight × sub-score).
- Cash flow +14.9/30.0
- ARV discount +7.5/15.0
- 1% rule +5.0/10.0
- DSCR +4.5/10.0
- Schools +4.1/10.0
- Livability +4.0/5.0
- Rent growth +3.3/5.0
- Condition / age +2.5/5.0
- Appreciation +0.0/10.0
$399,000
🖨 Deal sheet 📄 Offer letter ✓ Due diligence
Multi-family units
County records classify this as Multi-Family (2-4 Unit). Listing-text estimate: 2 units. confirmed
Listing remarks MLS
This duplex is a great investment for an owner who wants lots of space and a very good rental. The owner's side is 2508 square feet with large bedrooms, an office, dining room and huge laundry room. The den could easily make a third bedroom. The other side is a very nice 1260 square foot 2/1 with a large kitchen. The property has a large, fenced backyard and is very conveniently located. This property has lots of extras- it is totally handicap accessible. Check out the ironing board feature in the laundry room, the pull-down scale in the master bathroom and the cedar closet in the hallway. This place has storage galore! Push open the magnetic doors between the laundry and dining rooms to reveal the wet bar.
Key facts
- Cedar-lined closet
- Double gates
- Fenced backyard
Tags
Property features AI
Finance
- Other: Zoning: R2; Subdivision: Colonial Manor; Located at the corner of Lois and Manor Drive
Exterior
- Parking: Attached garage
- Utilities: Public sewer; Publicly maintained road access
- Home design: Duplex (residential income); Single-story
- Construction: Brick veneer construction; Composition roof; Slab foundation; Built as duplex
- Exterior features: Covered patio/porch; Fenced yard; Corner, level lot
Interior
- Kitchen: Dishwasher; Disposal; Electric range; Refrigerator
- Flooring: Carpet; Tile; Vinyl
- Bathrooms: 3 full bathrooms
- Heating & cooling: Central heating; Central air conditioning
- Interior features: Walk-in closet(s); Den with fireplace
Neighborhood map
What this means for you Summary
Snapshot
- This is a 2 × 2-bed/1.5-bath units multifamily listed at $399k.
Deal economics
- At list price, monthly cash flow is $114 ($1k/yr) — positive. Per door: $57/mo.
- The deal already cash-flows at list — no discount required.
- Meets the 1% rule at list price ($4k rent vs $399k).
- Cap rate 6.6% vs local median 2.1% in Kerrville — top-decile yield for the area; either an underpriced asset or a hidden risk that comps aren't pricing in. Stress-test before assuming the spread holds.
Location & tenants
- Location reads 81/100 on livability (#25 in TX, #1,483 nationally) — a professional / high-income tenant draw. Strengths: crime A+, cost of living A+, housing A+; Watch: employment C-, commute F.
- Kerrville ISD (town): math 45% / reading 51% proficiency, ranked #220 of 826 in TX (top 27%) — families likely to look elsewhere, expect single-tenant / working-renter base with shorter leases.
- Zoned schools: Starkey El (math 47% / reading 45%, grade D-, #1,097 of 4,322 statewide, top 26%, 467 students, 62% FRL) — zoned schools average 62% FRL vs 41% district-wide (21 pts higher); higher-poverty schools than district average — tighter screening recommended.
- Market conditions: Rents rising (+3.0%/yr); 753 active listings in the ZIP; 3 comparable units currently listed for rent nearby; rentals lingering (median 44d on market — plan ~5-8 weeks vacancy on turnover, expect pricing pressure); 100% of comp listings sitting > 30 days — soft ceiling on asking rent; 422 units permitted in Kerr County in 2024 (322 in 5+ unit buildings).
- At $3,990/mo this rent would consume 71% of the median local household income ($67k/yr) (locally 1092% of renters already pay >50% of income on rent) — very limited rent-growth headroom before tenants either downsize or default.
Forward outlook
- Local home prices are declining (-3.0%/yr); year-one equity from $3k of loan paydown is wiped out by about $12k of value loss. Plan a longer hold.
- Kerr County population projected at +15% by 2050 — long-run rental-demand tailwind backs the buy-and-hold thesis.
Negotiation context
- Only 3 days on market — expect competitive offers; lowballing is unlikely to land.
- 2 sale attempts since 15y ago with the ask held roughly flat each time — persistent listings suggest the price (not the market) is what's stuck; bring a comps-based counter.
Risks & watch-outs
- Climate carrying-cost: major wind risk, 52% chance of damaging wind over 30y; moderate wildfire risk; extreme-heat days projected 7→23/yr by 2055 (HVAC capex compounding) — expect insurance premiums to compound above CPI over the hold.
Questions for the listing agent
- Can we see the unit-by-unit rent roll, current vacancy, and any below-market leases? What's the average tenancy length?
- What capital expenditures (roof, boiler, parking lot, exteriors) have been made in the last 5 years, and what's planned in the next 2?
- Built in 1969 — when were the roof, HVAC, electrical panel, plumbing, and water heater last replaced?
- Is there a deadline driving the sale (1031 exchange, divorce, estate, relocation)? That informs how much negotiation room exists.
- Schools are B-rated — typically a magnet for longer-tenancy family renters. What's the average tenant stay here, and is there a school-zone premium baked into asking?
- The area grade is low — what's the realistic commute time and amenity access for the typical tenant pool here? Any planned neighborhood developments (good or bad) we should know about?
- What's the average days-on-market for RENTAL listings here right now (not sales)? A rising rental-DOM trend means longer vacancies and softer asking-rent achievability than the comps imply.
- What's the recent tenant-quality profile in this submarket — average credit score on applications, eviction rate, late-payment / NSF rate, and stable-employment percentage? A property-management company in the area should have these aggregated.
- How much new apartment / multifamily construction is in the pipeline within 1–3 miles? Heavy new supply (>2% of stock underway) typically softens rents 12–24 months out; light construction supports rent growth.
Investment metrics
- 1% rule
- 1.00% ✓
- Cap rate
- 6.64%
- Cash-on-cash
- 1.23%
- DSCR
- 1.05
- GRM
- 8.3
CMA / ARV
No comps found within radius.
Projected returns pro-forma
-3.0% appreciation · 3.03% rent growth · sell at horizon
- IRR
- -14.2%
- Equity multiple
- 0.49×
- Total profit
- $-57,017
- Equity at exit
- $59,492
- IRR
- -5.3%
- Equity multiple
- 0.65×
- Total profit
- $-38,830
- Equity at exit
- $34,498
Cash invested: $111,720 (down + closing). Projections, not guarantees.
Landlord ↔ Tenant lean methodology
- Overall (STATE)
- 87 Strongly Landlord-Friendly
- State Texas
- 87 Strongly Landlord-Friendly · R+5
- County
- — inherits STATE
- City
- — inherits STATE
ZIP-level market 78028
- Rents YoY
- 3.0%
- Active inventory
- 753
- Price-to-rent
- 16.7×
Monthly cashflow live
- Estimated rent
- $3,990 high interval (Pro) →
- Mortgage (P&I)
- −$2,092
- Tax from tax record
- −$779 /mo · $9,349/yr
- Insurance
- −$166
- HOA
- −$0
- Vacancy / Maint / Mgmt
- −$838
- Net cashflow
- $114
Break-even live
2-unit breakdown (identical units grouped — click to expand)
| Units | Beds | Baths | Est. rent |
|---|---|---|---|
| 2× units | 2 | 1.5 | $3,990 |
| #1 | 2 | 1.5 | $1,995 |
| #2 | 2 | 1.5 | $1,995 |
| Total (2 units) | $3,990 | ||
UW: 25.0% down · 7.5% · 30yr · 1.5% tax · 5.0% vac · 8.0% maint · 8.0% mgmt
Financing live
Cash to close
- Down payment
- $99,750
- Closing costs
- $11,970
- Reserves months
- —
- Total cash needed
- —
Loan-product check · same deal, 3 products live
Conventional
25% down · 7.5% · 30yr
- Down + closing
- —
- Monthly P&I
- —
- Monthly cashflow
- —
- DSCR
- —
- Eligible?
- —
Personal DTI + credit; lowest rate.
DSCR
20% down · 8.5% · 30yr
- Down + closing
- —
- Monthly P&I
- —
- Monthly cashflow
- —
- DSCR
- —
- Eligible?
- —
No personal income docs; deal must DSCR.
Hard money
10% down · 12.0% · 12mo
- Down + closing
- —
- Monthly P&I
- —
- Monthly cashflow
- —
- DSCR
- —
- Eligible?
- —
Short-term bridge; refi at stabilization.
Rent comps 3 comps
| Address | Beds | Baths | Sqft | Rent | $/sqft | DOM | Units | Dist |
|---|---|---|---|---|---|---|---|---|
| 113 Los Cedros Loop Kerrville, TX | 3.0 | 2.0 | 1780 | $2,300 | $1.29 | 44d | 1 | 0.82mi |
| 705 Lee St Kerrville, TX | 4.0 | 2.0 | 1781 | $2,300 | $1.29 | 43d | 1 | 1.09mi |
| 2026A Junction Hwy Kerrville, TX | 3.0 | 2.0 | 2661 | $2,900 | $1.09 | 43d | 1 | 1.24mi |
Listing history 4 events
-
2026-06-19days on market $399,000 Active 3 DOM
-
2026-06-18days on market $399,000 Active 2 DOM
-
2026-06-17remarks 699-char remark
-
2026-06-17$399,000 Active 1 DOM
ⓘ Source: listings_history table (triggers on properties + properties_extension) + one-shot
backfill from property_details.listing_events for pre-trigger history.
Tax reassessment forecast TX · Resets to sale price
- Current annual tax
- $9,349 · $779/mo
- Projected year-2 tax
- $9,349 · $779/mo
- Expected delta
- $0/yr ($0/mo · 0.0%)
ⓘ Screening estimate from a state-policy table — verify with the county assessor before closing.
Climate risk First Street
- Flood 1/10 Low FEMA zone X (unshaded) · 0% chance over 30 yrs
- Wildfire 5/10 Major
- Heat 6/10 Major 7 d/yr ≥103°F today · 23 d/yr by 30 yrs out
- Wind 6/10 Major 52% chance of damaging wind over 30 yrs
- Air quality 1/10 Low 0 unhealthy d/yr today · 0 by 30 yrs out
Nearby sold comps map
Loading sold comps map…
Walkable amenities ~0.75 mi
Loading nearby amenities…
Taxation est. · year 1
- Rental income
- $47,880
- − Mortgage interest
- −$22,350
- − Property taxes
- −$9,349
- − Insurance
- −$1,995
- − Repairs & maintenance
- −$3,830
- − Management
- −$3,830
- − Depreciation
- −$11,607
- Taxable loss
- −$5,082
- Est. tax savings @ 24.0%
- +$1,220
- After-tax cash flow
- $2,592/yr
For passive investors: Depreciation is non-cash, so a rental often shows a tax loss while cash-flowing — sheltering income. Rental losses are passive: they offset passive income freely, and up to $25,000/yr can offset ordinary (W-2) income if you actively participate and your MAGI is under $100k (phasing out to $0 by $150k); unused losses carry forward. On sale, claimed depreciation is recaptured at up to 25%, and gains may owe capital-gains tax (a 1031 exchange can defer both). Figures are a year-1 estimate at your 24.0% rate — not tax advice; consult a CPA.
Schools (NCES district)
- District
- Kerrville ISD
- NCES district ID
- 4825590
- Math proficiency
- 45% ▼ -10.00%
- Reading proficiency
- 51% ▼ -1.00%
- Median HH income
- $44,050
- Composite
- 40.54/100
- National rank
- #3702
- State rank
- #220 of 826 in TX
Livability — Kerrville
- Score
- 81/100
- State rank
- #25
- US rank
- #1483
Category grades
Schools grade is shown separately in the Schools card above.
Census & demographics
- Census place
- Kerrville, TX
- County
- Kerr County · 41,206 people
- City population
- 41,206
- Metro
- Kerrville, TX
- Population (ZIP)
- 41,206
- Household income
- $66,991
- Rent vs Own
- Severe rent burden
- 1092.0
Population outlook (Kerr County) Hauer SSP2
- Today (2025)
- 54,010 people
- By 2030
- 55,651 · +3.0%
- By 2040
- 58,923 · +9.1%
- By 2050
- 62,117 · +15.0%
- By 2075
- 71,809 · +33.0%
- By 2100
- 77,004 · +42.6%
Race, ethnicity, and origin ACS 2023
- Neighborhood character
- Predominantly White (69%)
- Race & ethnicity
- White 69% Hispanic / Latino 26% Two or more races 12% Black 2%
- Hispanic origin (detail)
- Mexican 22%
- Common ancestry
- Lithuanian 3% Slovak 3% Portuguese 2%
- Foreign-born
- 6% · Canada
- Languages at home
- 89% English-only · Spanish 10%
Political lean MEDSL · Kerr
- 2024 margin
- Solid R (+54.3) · D 22.4% · R 76.8%
- 2008→2024 swing
- -4.8pp toward R · 2008: -49.6pp · 2024: -54.3pp
- All cycles
- 2024: R+54.3 2020: R+51.7 2016: R+56.3 2012: R+59.1 2008: R+49.6
Not yet ingested
- Civics
- —
Market trends
- HPI YoY
- ▼ -260.97%
- Current HPI
- 213.3663
- Rent YoY
- ▲ 3.03%
- Metro
- Kerrville, TX
- State GDP YoY
- ▲ 3.95%
- F500 in state
- 110
Industry mix (Fortune 500 HQ in TX)
| Industry | F500 HQs | Revenue |
|---|---|---|
| Energy | 16 | $1,198B |
|
||
| Technology | 5 | $198B |
|
||
| Engineering / Construction | 4 | $72B |
|
||
| Energy Services | 3 | $60B |
|
||
| Utilities | 3 | $41B |
|
||
| Healthcare | 2 | $330B |
|
||
Price history
+100.5% since first listed4 events — show timeline
- 2026-06-16 Listed $399,000 KVMLS
- 2012-09-05 Sold (Public Records) — Public Records
- 2012-09-05 Sold (MLS) — KVMLS
- 2011-11-25 Listed $199,000 KVMLS
Property tax history
+6.3%/yrLatest (2025): $9,349 · +7.0% YoY. Source: county tax records.
Cash-flow waterfall
monthlySold comps — $/sqft
last 12 mo · ≤1 miLoading sold comps…