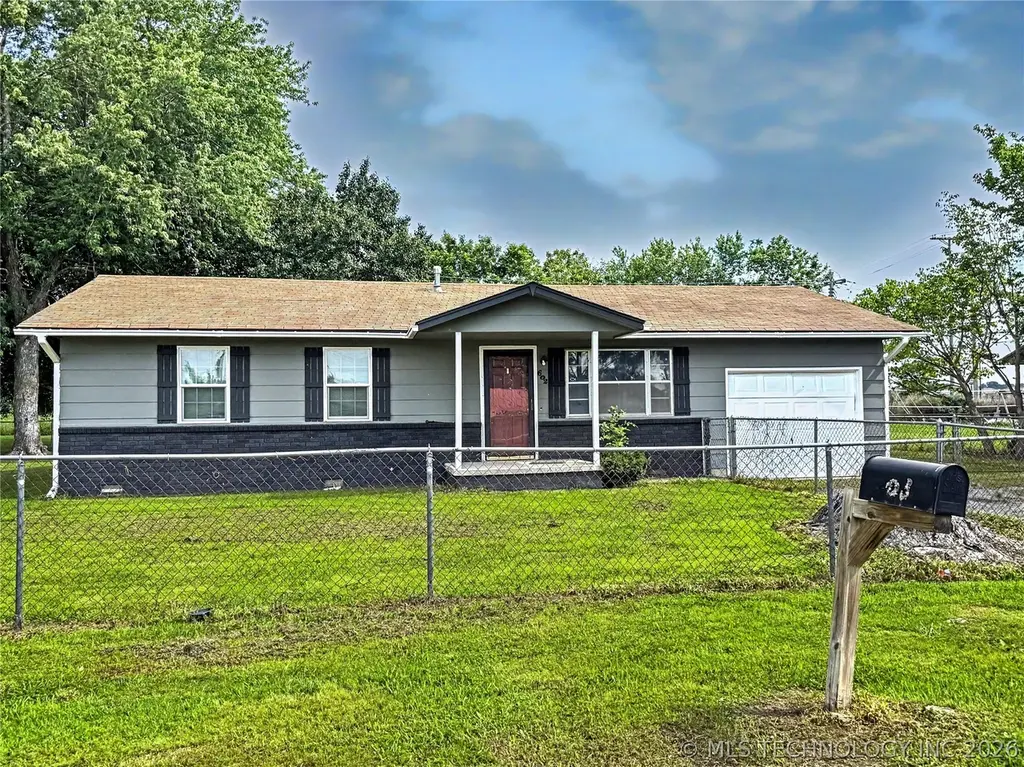
602 Green Country Dr · Park Hill, OK
Flood risk 3/10 · Minor
- FEMA flood zone
- X (unshaded)
- Chance of flooding over 30 yrs
- 0.2%
- Est. flood insurance / yr
- $507 – $1,088
Fire risk 5/10 · Moderate
- Est. fire insurance / yr
- $2,463 – $4,575
Heat risk 6/10 · Moderate
- Hot days now (above 110°F)
- 7 days/yr
- Hot days in 30 yrs
- 20 days/yr
Wind risk 2/10 · Minimal
- Chance of severe wind over 30 yrs
- 4.0%
Air-quality risk 2/10 · Minimal
- Unhealthy air days now
- 1 days/yr
- Unhealthy air days in 30 yrs
- 2 days/yr
Risk factors via First Street. Map © Google.
Why this score? — see what drove the B- grade
The composite is a weighted blend of 9 inputs, each scored 0–100. Each bar is that input's sub-score; the figure is the points it added to the 100-point composite (weight × sub-score).
- Cash flow +26.1/30.0
- ARV discount +15.0/15.0
- DSCR +8.8/10.0
- 1% rule +6.0/10.0
- Rent growth +4.8/5.0
- Livability +3.1/5.0
- Condition / age +2.5/5.0
- Schools +2.1/10.0
- Appreciation +0.0/10.0
$119,900
🖨 Deal sheet 📄 Offer letter ✓ Due diligence
Listing remarks
Charming 3-bedroom, 1-bath home situated on a spacious 0.3189-acre lot with beautiful mature trees that provide shade, privacy, and curb appeal. Offering 1,084 square feet (per CH) of living space, this property combines comfort, functionality, and outdoor enjoyment. Step onto the covered front porch and into a welcoming home designed for everyday living. Central heating and air conditioning provide year-round comfort, while the practical floor plan offers comfortable living spaces and plenty of potential to make it your own. Outside, you'll find a covered patio perfect for relaxing, grilling, or entertaining family and friends. The generous lot provides ample room for outdoor activities, g
Key facts
- Covered front porch
- Covered patio
- Storage shed
Tags
Property features AI
Finance
- HOA & community: Gutters noted as a community feature
Exterior
- Parking: Attached garage (1 car)
- Security: Smoke detector(s); No safety shelter
- Utilities: Electricity available; Natural gas available; Public water; Septic tank
- Home design: Single-story; Faces south; Crawlspace foundation
- Construction: Built from wood frame; Asphalt/fiberglass roof
- Exterior features: Covered patio and porch; Gravel driveway; Rain gutters; Shed(s); Chain link partial fencing; Mature trees
Interior
- Kitchen: Oven; Range; Refrigerator; Gas water heater
- Flooring: Wood veneer
- Bathrooms: 1 full bathroom
- Heating & cooling: Central heating (gas); Central air conditioning
- Interior features: Vinyl and storm windows; Storm door(s); Laminate counters; Ceiling fan(s); Gas range and gas oven connections
- Laundry & utility: Washer hookup; Electric dryer hookup
Neighborhood map
What this means for you Summary
Snapshot
- This is a 3-bed/1.0-bath single-family listed at $120k.
Deal economics
- At list price, monthly cash flow is $302 ($4k/yr) — positive.
- The deal already cash-flows at list — no discount required.
- Meets the 1% rule at list price ($1k rent vs $120k).
- Recommended offer: $118k (1.5% below list) — sets the bar for market timing.
Location & tenants
- Location reads 61/100 on livability (#285 in OK) — a middle-class / working-renter tenant base. Strengths: cost of living A+, housing A+, crime B; Watch: schools F, amenities F, commute F.
- Tahlequah (town): math 27% / reading 25% proficiency, ranked #109 of 270 in OK (top 40%) — low school quality limits family demand, transient renter base, plan for 1-2y turnover; 64% free/reduced lunch — lower-income household profile, screen leases tightly.
- Market conditions: Rents rising fast (+9.2%/yr); 367 active listings in the ZIP; 48 units permitted in Cherokee County in 2024 (0 in 5+ unit buildings).
- This rent runs 31% of the median local income ($51k/yr) — at the standard rent-burdened threshold; future hikes will face affordability resistance.
Forward outlook
- Local home prices are declining (-3.0%/yr); year-one equity from $829 of loan paydown is wiped out by about $4k of value loss. Plan a longer hold.
- Cherokee County population projected at +15% by 2050 — modest demand growth; plan on rents tracking national, not racing it.
- At projected returns (-3.0% appreciation + 8.0% rent growth), your $34k cash investment doubles in ~8 years — after that, you're playing with house money.
Negotiation context
- It's been on market 18 days — a 2% lower offer ($118k) is reasonable based on typical stale-listing flexibility.
- 7 sale attempts since 29y ago with the ask held roughly flat each time — persistent listings suggest the price (not the market) is what's stuck; bring a comps-based counter.
- Current owner paid $42k; list at $120k implies a 182% gain — meaningful room to come down on a strong offer.
Risks & watch-outs
- Climate carrying-cost: moderate wildfire risk; extreme-heat days projected 7→20/yr by 2055 (HVAC capex compounding) — expect insurance premiums to compound above CPI over the hold.
Questions for the listing agent
- Built in 1972 — when were the roof, HVAC, electrical panel, plumbing, and water heater last replaced?
- Is there a deadline driving the sale (1031 exchange, divorce, estate, relocation)? That informs how much negotiation room exists.
- Schools are F-rated, which usually means shorter tenancies and higher turnover. Who's the typical renter profile here, and what's been the actual vacancy rate?
- What's the average days-on-market for RENTAL listings here right now (not sales)? A rising rental-DOM trend means longer vacancies and softer asking-rent achievability than the comps imply.
- What's the recent tenant-quality profile in this submarket — average credit score on applications, eviction rate, late-payment / NSF rate, and stable-employment percentage? A property-management company in the area should have these aggregated.
- How much new for-sale + rental construction is in the pipeline within 1–3 miles? Heavy new supply typically softens prices + rents 12–24 months out; constrained supply supports both.
Investment metrics
- 1% rule
- 1.10% ✓
- Cap rate
- 9.32%
- Cash-on-cash
- 10.80%
- DSCR
- 1.48
- GRM
- 7.6
CMA / ARV
- ARV (on-the-fly)
- $172,356
- Comps found
- 3
Show comp detail 3 sales within ~0.75 mi
| Address | Dist | Beds/Ba | Sqft | Sold | Price | $/sf | Match |
|---|---|---|---|---|---|---|---|
| 729 Meadows Cir | 0.41mi | 3/2.0 | 1,192 (+10%) | 11mo | $189,500 | $159 | 51 |
| 624 Green Country Dr | 0.20mi | 4/2.0 (+1) | 1,200 (+11%) | 18mo | $186,000 | $155 | 48 |
| 4169 Highland Dr | 0.55mi | 3/2.0 | 1,236 (+14%) | 7mo | $230,000 | $186 | 41 |
Match score weights: distance 35% · size 25% · config 20% · recency 20%. Top-matched comps best support the ARV.
Projected returns pro-forma
-3.0% appreciation · 8.0% rent growth · sell at horizon
- IRR
- 4.9%
- Equity multiple
- 1.20×
- Total profit
- $6,724
- Equity at exit
- $17,877
- IRR
- 18.3%
- Equity multiple
- 2.85×
- Total profit
- $62,096
- Equity at exit
- $10,367
Cash invested: $33,572 (down + closing). Projections, not guarantees.
Landlord ↔ Tenant lean methodology
- Overall (STATE)
- 83 Strongly Landlord-Friendly
- State Oklahoma
- 83 Strongly Landlord-Friendly · R+20
- County
- — inherits STATE
- City
- — inherits STATE
ZIP-level market 74464
- Rents YoY
- 9.2%
- Active inventory
- 367
- Price-to-rent
- 7.6×
Monthly cashflow live
- Estimated rent
- $1,314 medium interval (Pro) →
- Mortgage (P&I)
- −$629
- Tax from tax record
- −$57 /mo · $688/yr
- Insurance
- −$50
- HOA
- −$0
- Vacancy / Maint / Mgmt
- −$276
- Net cashflow
- $302
Break-even live
UW: 25.0% down · 7.5% · 30yr · 1.5% tax · 5.0% vac · 8.0% maint · 8.0% mgmt
Financing live
Cash to close
- Down payment
- $29,975
- Closing costs
- $3,597
- Reserves months
- —
- Total cash needed
- —
Loan-product check · same deal, 3 products live
Conventional
25% down · 7.5% · 30yr
- Down + closing
- —
- Monthly P&I
- —
- Monthly cashflow
- —
- DSCR
- —
- Eligible?
- —
Personal DTI + credit; lowest rate.
DSCR
20% down · 8.5% · 30yr
- Down + closing
- —
- Monthly P&I
- —
- Monthly cashflow
- —
- DSCR
- —
- Eligible?
- —
No personal income docs; deal must DSCR.
Hard money
10% down · 12.0% · 12mo
- Down + closing
- —
- Monthly P&I
- —
- Monthly cashflow
- —
- DSCR
- —
- Eligible?
- —
Short-term bridge; refi at stabilization.
Listing history 14 events
-
2026-06-19days on market $119,900 Active 18 DOM
-
2026-06-18days on market $119,900 Active 17 DOM
-
2026-06-17days on market $119,900 Active 16 DOM
-
2026-06-16days on market $119,900 Active 15 DOM
-
2026-06-15days on market $119,900 Active 14 DOM
-
2026-06-14days on market $119,900 Active 12 DOM
-
2026-06-12days on market $119,900 Active 11 DOM
-
2026-06-09days on market $119,900 Active 8 DOM
-
2026-06-08days on market $119,900 Active 7 DOM
-
2026-06-07days on market $119,900 Active 6 DOM
-
2026-06-05days on market $119,900 Active 3 DOM
-
2026-06-03days on market $119,900 Active 2 DOM
-
2026-06-01remarks 699-char remark
-
2026-06-01$119,900 Active 1 DOM
ⓘ Source: listings_history table (triggers on properties + properties_extension) + one-shot
backfill from property_details.listing_events for pre-trigger history.
Tax reassessment forecast OK · Resets to sale price
- Current annual tax
- $688 · $57/mo
- Projected year-2 tax
- $1,079 · $90/mo
- Expected delta
- +$391/yr (+$33/mo · 56.8%)
ⓘ Screening estimate from a state-policy table — verify with the county assessor before closing.
Climate risk First Street
- Flood 3/10 Moderate FEMA zone X (unshaded) · 20% chance over 30 yrs
- Wildfire 5/10 Major
- Heat 6/10 Major 7 d/yr ≥110°F today · 20 d/yr by 30 yrs out
- Wind 2/10 Low 4% chance of damaging wind over 30 yrs
- Air quality 2/10 Low 1 unhealthy d/yr today · 2 by 30 yrs out
Nearby sold comps map
Loading sold comps map…
Walkable amenities ~0.75 mi
Loading nearby amenities…
Taxation est. · year 1
- Rental income
- $15,770
- − Mortgage interest
- −$6,716
- − Property taxes
- −$688
- − Insurance
- −$600
- − Repairs & maintenance
- −$1,262
- − Management
- −$1,262
- − Depreciation
- −$3,488
- Taxable income
- $1,755
- Est. tax owed @ 24.0%
- −$421
- After-tax cash flow
- $3,205/yr
For passive investors: Depreciation is non-cash, so a rental often shows a tax loss while cash-flowing — sheltering income. Rental losses are passive: they offset passive income freely, and up to $25,000/yr can offset ordinary (W-2) income if you actively participate and your MAGI is under $100k (phasing out to $0 by $150k); unused losses carry forward. On sale, claimed depreciation is recaptured at up to 25%, and gains may owe capital-gains tax (a 1031 exchange can defer both). Figures are a year-1 estimate at your 24.0% rate — not tax advice; consult a CPA.
Schools (NCES district)
- District
- Tahlequah
- NCES district ID
- 4029380
- Math proficiency
- 27% ▼ -14.00%
- Reading proficiency
- 25% ▼ -11.00%
- Median HH income
- $32,990
- Composite
- 21.28/100
- National rank
- #8393
- State rank
- #109 of 270 in OK
Livability — Park Hill
- Score
- 61/100
- State rank
- #285
- US rank
- #17549
Category grades
Schools grade is shown separately in the Schools card above.
Census & demographics
- County
- Cherokee County · 31,116 people
- Metro
- Tahlequah, OK
- Population (ZIP)
- 31,116
- Household income
- $51,262
- Rent vs Own
- Severe rent burden
- 1058.0
Population outlook (Cherokee County) Hauer SSP2
- Today (2025)
- 51,747 people
- By 2030
- 53,481 · +3.4%
- By 2040
- 56,503 · +9.2%
- By 2050
- 59,370 · +14.7%
- By 2075
- 67,178 · +29.8%
- By 2100
- 70,900 · +37.0%
Race, ethnicity, and origin ACS 2023
- Neighborhood character
- Highly diverse neighborhood (Simpson 0.82)
- Race & ethnicity
- White 41% Native American 35% Two or more races 16% Hispanic / Latino 10% Black 2%
- Hispanic origin (detail)
- Mexican 8%
- Common ancestry
- Italian 2% Slovak 2% Lithuanian 1%
- Foreign-born
- 4% · Canada
- Languages at home
- 90% English-only · Spanish 6%
Political lean MEDSL · Cherokee
- 2024 margin
- Solid R (+32.6) · D 32.7% · R 65.3% · Other 2.0%
- 2008→2024 swing
- -20.4pp toward R · 2008: -12.2pp · 2024: -32.6pp
- All cycles
- 2024: R+32.6 2020: R+29.3 2016: R+27.5 2012: R+14.1 2008: R+12.2
Not yet ingested
- Civics
- —
Market trends
- HPI YoY
- ▼ -184.14%
- Current HPI
- 226.4004
- Rent YoY
- ▲ 9.23%
- Metro
- Tahlequah, OK
- State GDP YoY
- ▲ 1.55%
- F500 in state
- 6
Industry mix (Fortune 500 HQ in OK)
| Industry | F500 HQs | Revenue |
|---|---|---|
| Energy | 3 | $48B |
|
||
Price history
+163.5% since first listed16 events — show timeline
- 2026-05-31 Listed $119,900 MLS Technology, Inc.
- 2024-06-25 Pending — MLS Technology, Inc.
- 2024-06-25 Listing Removed — MLS Technology, Inc.
- 2024-06-13 Relisted — MLS Technology, Inc.
- 2024-05-31 Pending — MLS Technology, Inc.
- 2024-04-19 Listed $144,900 MLS Technology, Inc.
- 2007-11-20 Listing Removed — MLS Technology, Inc.
- 2007-08-28 Listed $76,900 MLS Technology, Inc.
- 1998-10-02 Listing Removed — MLS Technology, Inc.
- 1998-05-08 Sold (Public Records) $42,500 Public Records
- 1998-05-01 Sold (MLS) $42,500 MLS Technology, Inc.
- 1998-04-19 Listed $39,900 MLS Technology, Inc.
- 1998-03-05 Listing Removed — MLS Technology, Inc.
- 1997-10-19 Listed $39,900 MLS Technology, Inc.
- 1997-09-10 Listing Removed — MLS Technology, Inc.
- 1997-02-21 Listed $45,500 MLS Technology, Inc.
Property tax history
+1.4%/yrLatest (2025): $688 · +3.5% YoY. Source: county tax records.
Cash-flow waterfall
monthlySold comps — $/sqft
last 12 mo · ≤1 miLoading sold comps…