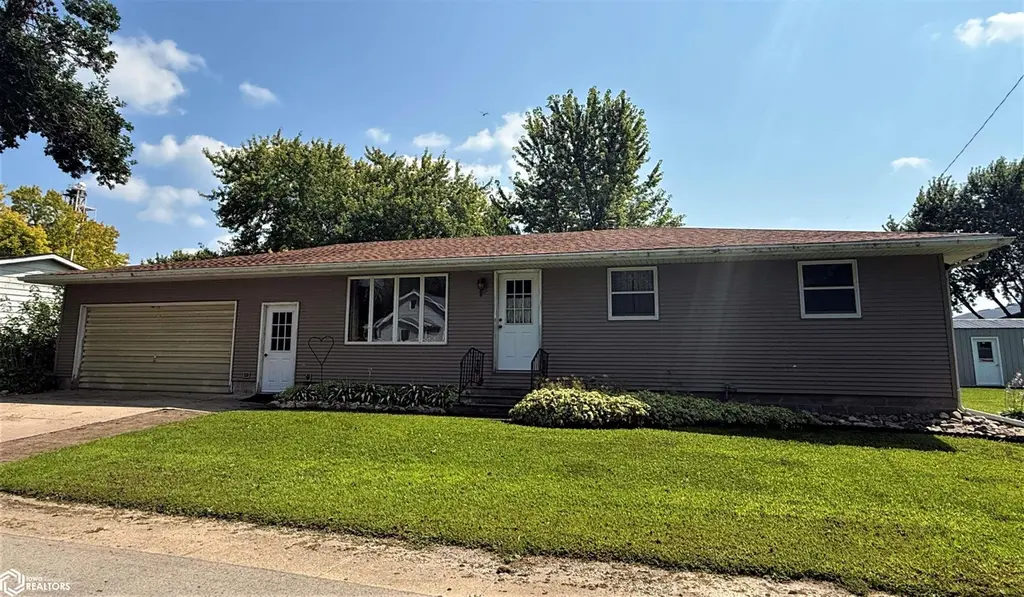
312 6th Ave W · Swea City, IA
Flood risk 1/10 · Minimal
- FEMA flood zone
- X (unshaded)
- Chance of flooding over 30 yrs
- 0.0%
- Est. flood insurance / yr
- $473 – $860
Fire risk 1/10 · Minimal
- Est. fire insurance / yr
- $902 – $1,676
Heat risk 2/10 · Minimal
- Hot days now (above 99°F)
- 7 days/yr
- Hot days in 30 yrs
- 16 days/yr
Wind risk 2/10 · Minimal
- Chance of severe wind over 30 yrs
- —
Air-quality risk 2/10 · Minimal
- Unhealthy air days now
- 1 days/yr
- Unhealthy air days in 30 yrs
- 1 days/yr
Risk factors via First Street. Map © Google.
Why this score? — see what drove the B+ grade
The composite is a weighted blend of 9 inputs, each scored 0–100. Each bar is that input's sub-score; the figure is the points it added to the 100-point composite (weight × sub-score).
- Cash flow +27.9/30.0
- ARV discount +12.2/15.0
- DSCR +9.9/10.0
- Appreciation +8.1/10.0
- 1% rule +7.4/10.0
- Schools +6.0/10.0
- Livability +3.5/5.0
- Rent growth +2.5/5.0
- Condition / age +2.5/5.0
$89,000
🖨 Deal sheet 📄 Offer letter ✓ Due diligence
Listing remarks
Spacious ranch home with endless potential! This property features beautiful stone landscaping, vibrant perennial gardens, and a large yard perfect for outdoor enjoyment. Inside, the home is ready for your personal touch—bring your vision and creativity to make it truly shine. An oversized 2-stall garage offers plenty of space for vehicles, storage, or a workshop. With its great bones and inviting setting, this home is a wonderful opportunity for those looking to invest in a property with charm and room to grow.
Key facts
- Perennial gardens
- Large yard
- Stone landscaping
Tags
Property features AI
Exterior
- Parking: Attached concrete 2-car garage
- Utilities: Public water; Public sewer; Electric service with circuit breakers
- Home design: Single-family residence; Residential property
- Construction: Frame construction with vinyl siding
- Exterior features: Shingle roof; Public maintained road; City street frontage; Lot roughly 0.33 acre (80 x 180)
Interior
- Kitchen: Dishwasher; Refrigerator
- Bathrooms: 1 full bathroom
- Heating & cooling: Central air conditioning; Forced air heating
- Interior features: Dishwasher; Refrigerator; Basement
Neighborhood map
What this means for you Summary
Snapshot
- This is a 3-bed/1.5-bath single-family listed at $89k.
Deal economics
- At list price, monthly cash flow is $275 ($3k/yr) — positive.
- The deal already cash-flows at list — no discount required.
- Meets the 1% rule at list price ($1k rent vs $89k).
- Recommended offer: $78k (12.0% below list) — sets the bar for market timing.
Location & tenants
- Location reads 69/100 on livability (#403 in IA) — a middle-class / working-renter tenant base. Strengths: cost of living A+, housing A+, health & safety A+; Watch: crime C-, amenities F, commute F.
- North Kossuth Community School District (rural): math 66% / reading 77% proficiency, ranked #138 of 289 in IA (top 48%) — strong family-tenant draw, lease renewals of 3-5y typical.
- Market conditions: 6 active listings in the ZIP; 15 units permitted in Kossuth County in 2024 (0 in 5+ unit buildings).
Forward outlook
- In year one you build about $6k of equity ($615 loan paydown + $5k appreciation (6.2% local appreciation)).
- Kossuth County population projected to shrink 6% by 2050 — rents likely to lag national; underwrite the cash flow, not the appreciation.
- At projected returns (6.2% appreciation + 3.0% rent growth), your $25k cash investment doubles in ~3 years — after that, you're playing with house money.
- By year 6, paydown + projected appreciation supports a ~$33k cash-out refi (75% LTV) — recoverable capital for the next deal without selling this one.
Negotiation context
- It's been on market 301 days — a 12% lower offer ($78k) is reasonable based on typical stale-listing flexibility.
- 2 sale attempts; this cycle's ask has dropped $6k (6%) from the opening price — seller is motivated, your offer sets the floor, not the list.
- Current owner paid $35k; list at $89k implies a 154% gain — meaningful room to come down on a strong offer.
Questions for the listing agent
- It's been on market 301 days. Have you received any prior offers? Is the seller open to a 12% concession, seller financing, or rate buy-down credit?
- Built in 1978 — when were the roof, HVAC, electrical panel, plumbing, and water heater last replaced?
- Why hasn't it sold? Are there any deal-killer items the seller is aware of (foundation, flood, title, zoning, code violations)?
- Is there a deadline driving the sale (1031 exchange, divorce, estate, relocation)? That informs how much negotiation room exists.
- Schools are B-rated — typically a magnet for longer-tenancy family renters. What's the average tenant stay here, and is there a school-zone premium baked into asking?
- What's the average days-on-market for RENTAL listings here right now (not sales)? A rising rental-DOM trend means longer vacancies and softer asking-rent achievability than the comps imply.
- What's the recent tenant-quality profile in this submarket — average credit score on applications, eviction rate, late-payment / NSF rate, and stable-employment percentage? A property-management company in the area should have these aggregated.
- How much new for-sale + rental construction is in the pipeline within 1–3 miles? Heavy new supply typically softens prices + rents 12–24 months out; constrained supply supports both.
Investment metrics
- 1% rule
- 1.24% ✓
- Cap rate
- 10.00%
- Cash-on-cash
- 13.23%
- DSCR
- 1.59
- GRM
- 6.7
CMA / ARV
- ARV (on-the-fly)
- $99,258
- Comps found
- 5
Show comp detail 5 sales within ~0.75 mi
| Address | Dist | Beds/Ba | Sqft | Sold | Price | $/sf | Match |
|---|---|---|---|---|---|---|---|
| 303 W 1st Ave | 0.33mi | 2/1.0 (-1) | 1,480 (+6%) | 3mo | $84,800 | $57 | 66 |
| 602 2nd St N | 0.18mi | 3/1.0 | 1,476 (+6%) | 18mo | $105,000 | $71 | 65 |
| 107 4th St N | 0.29mi | 3/1.0 | 1,507 (+8%) | 14mo | $97,500 | $65 | 60 |
| 408 2nd Ave W | 0.29mi | 4/1.0 (+1) | 1,307 (-6%) | 15mo | $99,000 | $76 | 56 |
| 201 Ash Ave W | 0.43mi | 3/1.5 | 1,242 (-11%) | 10mo | $103,000 | $83 | 53 |
Match score weights: distance 35% · size 25% · config 20% · recency 20%. Top-matched comps best support the ARV.
Projected returns pro-forma
6.15% appreciation · 3.0% rent growth · sell at horizon
- IRR
- 26.7%
- Equity multiple
- 2.77×
- Total profit
- $43,996
- Equity at exit
- $56,793
- IRR
- 24.9%
- Equity multiple
- 5.64×
- Total profit
- $115,511
- Equity at exit
- $103,729
Cash invested: $24,920 (down + closing). Projections, not guarantees.
Landlord ↔ Tenant lean methodology
- Overall (STATE)
- 83 Strongly Landlord-Friendly
- State Iowa
- 83 Strongly Landlord-Friendly · R+6
- County
- — inherits STATE
- City
- — inherits STATE
ZIP-level market 50590
- Home prices YoY
- 5.6%
- Active inventory
- 6
- Price-to-rent
- 6.7×
Monthly cashflow live
- Estimated rent
- $1,101 medium interval (Pro) →
- Mortgage (P&I)
- −$467
- Tax from tax record
- −$91 /mo · $1,090/yr
- Insurance
- −$37
- HOA
- −$0
- Vacancy / Maint / Mgmt
- −$231
- Net cashflow
- $275
Break-even live
UW: 25.0% down · 7.5% · 30yr · 1.5% tax · 5.0% vac · 8.0% maint · 8.0% mgmt
Financing live
Cash to close
- Down payment
- $22,250
- Closing costs
- $2,670
- Reserves months
- —
- Total cash needed
- —
Loan-product check · same deal, 3 products live
Conventional
25% down · 7.5% · 30yr
- Down + closing
- —
- Monthly P&I
- —
- Monthly cashflow
- —
- DSCR
- —
- Eligible?
- —
Personal DTI + credit; lowest rate.
DSCR
20% down · 8.5% · 30yr
- Down + closing
- —
- Monthly P&I
- —
- Monthly cashflow
- —
- DSCR
- —
- Eligible?
- —
No personal income docs; deal must DSCR.
Hard money
10% down · 12.0% · 12mo
- Down + closing
- —
- Monthly P&I
- —
- Monthly cashflow
- —
- DSCR
- —
- Eligible?
- —
Short-term bridge; refi at stabilization.
Listing history 20 events
-
2026-06-18days on market $89,000 Active 301 DOM
-
2026-06-17days on market $89,000 Active 300 DOM
-
2026-06-16days on market $89,000 Active 299 DOM
-
2026-06-15days on market $89,000 Active 298 DOM
-
2026-06-13days on market $89,000 Active 296 DOM
-
2026-06-12days on market $89,000 Active 295 DOM
-
2026-06-09days on market $89,000 Active 292 DOM
-
2026-06-08days on market $89,000 Active 291 DOM
-
2026-06-07days on market $89,000 Active 290 DOM
-
2026-06-05days on market $89,000 Active 288 DOM
-
2026-06-04days on market $89,000 Active 286 DOM
-
2026-06-02days on market $89,000 Active 285 DOM
-
2026-06-01days on market $89,000 Active 284 DOM
-
2026-05-31days on market $89,000 Active 283 DOM
-
2026-05-31days on market $89,000 Active 282 DOM
-
2026-05-16status Active
-
2026-04-30status Pending
-
2026-02-12price $89,000
-
2025-08-05$95,000 Active
-
1987-01-16soldstatus $35,000
ⓘ Source: listings_history table (triggers on properties + properties_extension) + one-shot
backfill from property_details.listing_events for pre-trigger history.
Tax reassessment forecast IA · Partial reset (capped growth)
- Current annual tax
- $1,090 · $91/mo
- Projected year-2 tax
- $1,244 · $104/mo
- Expected delta
- +$154/yr (+$13/mo · 14.1%)
ⓘ Screening estimate from a state-policy table — verify with the county assessor before closing.
Climate risk First Street
- Flood 1/10 Low FEMA zone X (unshaded) · 0% chance over 30 yrs
- Wildfire 1/10 Low
- Heat 2/10 Low 7 d/yr ≥99°F today · 16 d/yr by 30 yrs out
- Wind 2/10 Low
- Air quality 2/10 Low 1 unhealthy d/yr today · 1 by 30 yrs out
Nearby sold comps map
Loading sold comps map…
Walkable amenities ~0.75 mi
Loading nearby amenities…
Taxation est. · year 1
- Rental income
- $13,207
- − Mortgage interest
- −$4,985
- − Property taxes
- −$1,090
- − Insurance
- −$445
- − Repairs & maintenance
- −$1,057
- − Management
- −$1,057
- − Depreciation
- −$2,589
- Taxable income
- $1,984
- Est. tax owed @ 24.0%
- −$476
- After-tax cash flow
- $2,821/yr
For passive investors: Depreciation is non-cash, so a rental often shows a tax loss while cash-flowing — sheltering income. Rental losses are passive: they offset passive income freely, and up to $25,000/yr can offset ordinary (W-2) income if you actively participate and your MAGI is under $100k (phasing out to $0 by $150k); unused losses carry forward. On sale, claimed depreciation is recaptured at up to 25%, and gains may owe capital-gains tax (a 1031 exchange can defer both). Figures are a year-1 estimate at your 24.0% rate — not tax advice; consult a CPA.
Schools (NCES district)
- District
- North Kossuth Community School District
- NCES district ID
- 1920830
- Math proficiency
- 66% ▼ -2.00%
- Reading proficiency
- 77% ▲ 19.00%
- Median HH income
- $41,282
- Composite
- 59.74/100
- National rank
- #901
- State rank
- #138 of 289 in IA
Livability — Swea City
- Score
- 69/100
- State rank
- #403
- US rank
- #8592
Category grades
Schools grade is shown separately in the Schools card above.
Census & demographics
- Census place
- Swea City, IA
- Population (ZIP)
- 736
Population outlook (Kossuth County) Hauer SSP2
- Today (2025)
- 14,667 people
- By 2030
- 14,445 · -1.5%
- By 2040
- 14,093 · -3.9%
- By 2050
- 13,825 · -5.7%
- By 2075
- 14,039 · -4.3%
- By 2100
- 13,662 · -6.9%
Race, ethnicity, and origin ACS 2023
- Neighborhood character
- Predominantly White (90%)
- Race & ethnicity
- White 90% Two or more races 3% Hispanic / Latino 2% Native American 1%
- Common ancestry
- Portuguese 10% Italian 1% Iranian 1%
- Foreign-born
- 2%
- Languages at home
- 98% English-only · Other Indo-European 2%
Political lean MEDSL · Kossuth
- 2024 margin
- Solid R (+44.2) · D 27.3% · R 71.4% · Other 1.3%
- 2008→2024 swing
- -47.4pp toward R · 2008: 3.2pp · 2024: -44.2pp
- All cycles
- 2024: R+44.2 2020: R+39.4 2016: R+36.5 2012: R+12.3 2008: D+3.2
Not yet ingested
- Civics
- —
Market trends
- HPI YoY
- ▲ 6.15%
- Current HPI
- 115.7588
- Rent YoY
- —
- Metro
- —
- State GDP YoY
- ▲ 2.48%
- F500 in state
- 4
Industry mix (Fortune 500 HQ in IA)
| Industry | F500 HQs | Revenue |
|---|---|---|
| Financial Services | 1 | $16B |
|
||
| Retail / Convenience | 1 | $15B |
|
||
Price history
+154.3% since first listed5 events — show timeline
- 2026-05-16 Relisted — IAR
- 2026-04-30 Pending — IAR
- 2026-02-12 Price Changed $89,000 IAR
- 2025-08-05 Listed $95,000 IAR
- 1987-01-16 Sold (Public Records) $35,000 Public Records
Property tax history
+3.4%/yrLatest (2025): $1,090 · +1.1% YoY. Source: county tax records.
Cash-flow waterfall
monthlySold comps — $/sqft
last 12 mo · ≤1 miLoading sold comps…