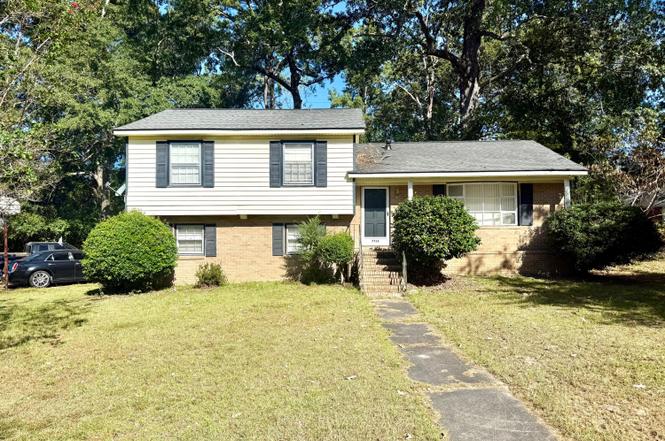
7726 Picardy Pl · North Charleston, SC
Flood risk 1/10 · Minimal
- FEMA flood zone
- X (unshaded)
- Chance of flooding over 30 yrs
- 0.0%
- Est. flood insurance / yr
- $507 – $1,088
Fire risk 4/10 · Minor
- Est. fire insurance / yr
- $783 – $1,453
Heat risk 9/10 · Severe
- Hot days now (above 107°F)
- 7 days/yr
- Hot days in 30 yrs
- 17 days/yr
Wind risk 8/10 · Major
- Chance of severe wind over 30 yrs
- 99.0%
Air-quality risk 2/10 · Minimal
- Unhealthy air days now
- 2 days/yr
- Unhealthy air days in 30 yrs
- 2 days/yr
Risk factors via First Street. Map © Google.
Why this score? — see what drove the C grade
The composite is a weighted blend of 9 inputs, each scored 0–100. Each bar is that input's sub-score; the figure is the points it added to the 100-point composite (weight × sub-score).
- Cash flow +20.2/30.0
- ARV discount +15.0/15.0
- DSCR +6.4/10.0
- Schools +4.3/10.0
- 1% rule +4.0/10.0
- Livability +3.3/5.0
- Rent growth +3.0/5.0
- Condition / age +2.5/5.0
- Appreciation +0.0/10.0
$279,600
🖨 Deal sheet (PDF) 📄 Offer letter ✓ Due diligence
Listing remarks MLS
<B>THIS IS THE BEST VALUE AROUND BY FAR!</B> TRI-LEVEL HOME WITH <U>TONS OF POTENTIAL!!</U>, CLOSE TO SCHOOLS AND SHOPPING, SHORT DRIVE TO BASES AND DOWNTOWN CHARLESTON, OUTSIDE STORAGE BUILDING CONVEYS, FENCED BACKYARD, IDEAL FOR PETS. <B>KITCHEN HAS BRAND NEW DISWASHER, NEWER GAS STOVE, AND THE FRIDGE CONVEYS TO BUYER!</B> , BAY WINDOW IN LIVING ROOM. <B>NEW A/C SYSTEM</B>, <U>HARDWOOD FLOORS UNDER CARPET</U> IN LIVING ROOM AND DINING AREA, LARGE SUNROOM W/SEPERATE HEATING AND AIR AND CEILING FAN. SEPERATE LIBRARY/ OFFICE WITH CUSTOM BOOK SHELVES AND TWO COMPUTER DESKS. NOT TO MENTION THE HUGE LAUNDRY ROOM WITH A LARGE CUSTOME CEADER CLOSET! THIS HOME IS PERFECT FOR A GROWING FAMILY. LOTS OF SPACE TO STRETCH OUT! THERE IS SOMETHING FOR EVERYONE INTHIS HOME! SELLER IS MOTIVATED, AND THIS HOME IS PRICED TO SELL QUICK!
Key facts
- Oversized sunroom
- Bay window
- Fenced backyard
Tags
Property features AI
Finance
- HOA & community: Trash service in community
Exterior
- Parking: Off-street parking
- Utilities: Public sewer; Dominion Energy service
- Home design: Single-family detached residential property; Split-level design; Ground-level entry
- Construction: Architectural roof; Fee simple ownership
- Exterior features: Rain gutters; Metal enclosed fence
Interior
- Kitchen: Gas range
- Bedrooms: 3 bedrooms; Primary bedroom located on the upper level with ceiling fan
- Flooring: Ceramic tile; Vinyl; Wood
- Bathrooms: 2.5 bathrooms
- Heating & cooling: Electric heat; Heat pump
- Interior features: Blown ceilings; Ceiling fans; Eat-in kitchen; Family room; Entrance foyer
- Laundry & utility: Laundry room with electric dryer hookup
Neighborhood map
What this means for you Summary
Snapshot
- This is a 3-bed/2.5-bath single-family listed at $280k.
Deal economics
- At list price, monthly cash flow is $353 ($4k/yr) — positive.
- The deal already cash-flows at list — no discount required.
- To meet the 1% rule (rent ≥ 1% of price), the offer needs to be $253k (9.6% below list).
- Recommended offer: $246k (12.0% below list) — sets the bar for market timing.
- Cap rate 7.8% vs local median 4.0% in North Charleston — top-decile yield for the area; either an underpriced asset or a hidden risk that comps aren't pricing in. Stress-test before assuming the spread holds.
Location & tenants
- Location reads 66/100 on livability (#122 in SC) — a middle-class / working-renter tenant base. Strengths: housing A+, health & safety A+, cost of living A; Watch: employment C-, crime F, amenities F.
- Charleston 01 (urban): math 48% / reading 53% proficiency, ranked #7 of 80 in SC (top 9%) — acceptable for families but not a draw, mixed tenant base, ~2y average lease.
- Zoned schools: Northwoods Middle (math 11% / reading 16%, grade F, #207 of 229 statewide, top 91%, 738 students, 100% FRL); Rb Stall High (math 49% / reading 63%, grade C, #126 of 196 statewide, top 65%, 1,952 students, 100% FRL) — zoned schools average 100% FRL vs 44% district-wide (56 pts higher); higher-poverty schools than district average — tighter screening recommended.
- Zoned-school proficiency averages 35% at this address vs 50% district-wide (-16 pts) — the specific schools serving this property underperform the Charleston 01 average; the district grade overstates school quality for this exact location.
- Market conditions: Rents rising (+1.8%/yr); 129 active listings in the ZIP; 14 comparable units currently listed for rent nearby; rentals at typical pace (median 21d on market — plan ~3-4 weeks tenant-placement turnaround); 4,156 units permitted in Charleston County in 2024 (857 in 5+ unit buildings).
- This rent runs 42% of the median local income ($73k/yr) — at the standard rent-burdened threshold; future hikes will face affordability resistance.
Forward outlook
- Local home prices are declining (-3.0%/yr); year-one equity from $2k of loan paydown is wiped out by about $8k of value loss. Plan a longer hold.
- Charleston County population projected at +44% by 2050 — long-run rental-demand tailwind backs the buy-and-hold thesis.
Negotiation context
- It's been on market 209 days — a 12% lower offer ($246k) is reasonable based on typical stale-listing flexibility.
- 4 sale attempts since 22y ago; this cycle's ask has dropped $20k (7%) from the opening price — seller is motivated, your offer sets the floor, not the list.
- Current owner paid $99k; list at $280k implies a 182% gain — meaningful room to come down on a strong offer.
Risks & watch-outs
- Climate carrying-cost: severe wind risk, 99% chance of damaging wind over 30y; extreme-heat days projected 7→17/yr by 2055 (HVAC capex compounding) — expect insurance premiums to compound above CPI over the hold.
Questions for the listing agent
- It's been on market 209 days. Have you received any prior offers? Is the seller open to a 12% concession, seller financing, or rate buy-down credit?
- Built in 1968 — when were the roof, HVAC, electrical panel, plumbing, and water heater last replaced?
- Why hasn't it sold? Are there any deal-killer items the seller is aware of (foundation, flood, title, zoning, code violations)?
- Is there a deadline driving the sale (1031 exchange, divorce, estate, relocation)? That informs how much negotiation room exists.
- Crime grade is F in this area — have there been break-ins, vandalism, or insurance claims at this property in the last 3 years? What carrier currently insures it and at what premium?
- What's the average days-on-market for RENTAL listings here right now (not sales)? A rising rental-DOM trend means longer vacancies and softer asking-rent achievability than the comps imply.
- What's the recent tenant-quality profile in this submarket — average credit score on applications, eviction rate, late-payment / NSF rate, and stable-employment percentage? A property-management company in the area should have these aggregated.
- How much new for-sale + rental construction is in the pipeline within 1–3 miles? Heavy new supply typically softens prices + rents 12–24 months out; constrained supply supports both.
Investment metrics
- 1% rule
- 0.90% ✗
- Cap rate
- 7.81%
- Cash-on-cash
- 5.41%
- DSCR
- 1.24
- GRM
- 9.2
CMA / ARV
- ARV (on-the-fly)
- $343,186
- Comps found
- 12
Show comp detail 12 sales within ~0.75 mi
| Address | Dist | Beds/Ba | Sqft | Sold | Price | $/sf | Match |
|---|---|---|---|---|---|---|---|
| 3417 Smoketree Ct | 0.20mi | 4/2.5 (+1) | 1,775 (+0%) | 2mo | $405,000 | $228 | 84 |
| 8658 Windsor Hill Blvd | 0.49mi | 3/2.5 | 1,703 (-4%) | 1mo | $395,000 | $232 | 71 |
| 7635 Hillandale Rd | 0.35mi | 3/1.5 | 1,668 (-6%) | 1mo | $275,000 | $165 | 69 |
| 8204 Pleasant Ridge Dr | 0.48mi | 3/2.0 | 1,803 (+2%) | 4mo | $360,000 | $200 | 69 |
| 7654 Peppercorn Ln | 0.21mi | 4/2.0 (+1) | 1,648 (-7%) | 6mo | $250,000 | $152 | 67 |
| 8113 Pleasant Ridge Dr | 0.53mi | 4/2.5 (+1) | 1,779 (+1%) | 7mo | $310,000 | $174 | 63 |
| 4012 Windsor Ward Ln | 0.60mi | 3/2.5 | 1,703 (-4%) | 5mo | $405,000 | $238 | 62 |
| 8105 Halifax Way | 0.53mi | 3/2.5 | 1,884 (+6%) | 5mo | $325,000 | $173 | 60 |
| 3280 Starlett Ave | 0.62mi | 4/1.5 (+1) | 1,785 (+1%) | 2mo | $230,000 | $129 | 59 |
| 3278 Poindexter Rd | 0.67mi | 4/2.0 (+1) | 1,804 (+2%) | 4mo | $360,000 | $200 | 55 |
| 8201 Timberidge Ct | 0.61mi | 4/2.0 (+1) | 1,601 (-10%) | 3mo | $295,000 | $184 | 46 |
| 8248 Timberidge Ct | 0.60mi | 4/2.0 (+1) | 1,574 (-11%) | 3mo | $305,000 | $194 | 44 |
Match score weights: distance 35% · size 25% · config 20% · recency 20%. Top-matched comps best support the ARV.
Projected returns pro-forma
-3.0% appreciation · 1.83% rent growth · sell at horizon
- IRR
- -9.1%
- Equity multiple
- 0.67×
- Total profit
- $-25,898
- Equity at exit
- $41,689
- IRR
- -1.2%
- Equity multiple
- 0.92×
- Total profit
- $-5,948
- Equity at exit
- $24,175
Cash invested: $78,288 (down + closing). Projections, not guarantees.
Landlord ↔ Tenant lean methodology
- Overall (STATE)
- 90 Strongly Landlord-Friendly
- State South Carolina
- 90 Strongly Landlord-Friendly · R+6
- County
- — inherits STATE
- City
- — inherits STATE
ZIP-level market 29420
- Home prices YoY
- -14.6%
- Rents YoY
- 1.8%
- Active inventory
- 129
- Price-to-rent
- 9.2×
Monthly cashflow live
- Estimated rent
- $2,529 high interval (Pro) →
- Mortgage (P&I)
- −$1,466
- Tax from tax record
- −$62 /mo · $742/yr
- Insurance
- −$116
- HOA
- −$0
- Vacancy / Maint / Mgmt
- −$531
- Net cashflow
- $353
Break-even live
Sensitivity live
| Price | -10% $511 | -5% $432 | +0% $353 | +5% $274 | +10% $195 |
|---|---|---|---|---|---|
| Rent | -10% $153 | -5% $253 | +0% $353 | +5% $453 | +10% $553 |
| Rate | -1.0pp $494 | -0.5pp $424 | base $353 | +0.5pp $281 | +1.0pp $207 |
UW: 25.0% down · 7.5% · 30yr · 1.5% tax · 5.0% vac · 8.0% maint · 8.0% mgmt
Financing live
Cash to close
- Down payment
- $69,900
- Closing costs
- $8,388
- Reserves months
- —
- Total cash needed
- —
Loan-product check · same deal, 3 products live
Conventional
25% down · 7.5% · 30yr
- Down + closing
- —
- Monthly P&I
- —
- Monthly cashflow
- —
- DSCR
- —
- Eligible?
- —
Personal DTI + credit; lowest rate.
DSCR
20% down · 8.5% · 30yr
- Down + closing
- —
- Monthly P&I
- —
- Monthly cashflow
- —
- DSCR
- —
- Eligible?
- —
No personal income docs; deal must DSCR.
Hard money
10% down · 12.0% · 12mo
- Down + closing
- —
- Monthly P&I
- —
- Monthly cashflow
- —
- DSCR
- —
- Eligible?
- —
Short-term bridge; refi at stabilization.
Rent comps 14 comps
| Address | Beds | Baths | Sqft | Rent | $/sqft | DOM | Units | Dist |
|---|---|---|---|---|---|---|---|---|
| 7782 Ginger Ln North Charleston, SC | 3.0 | 1.0 | 1300 | $3,680 | $2.83 | 4d | 1 | 0.13mi |
| 7677 Picardy Pl North Charleston, SC | 3.0 | 1.5 | 1300 | $2,500 | $1.92 | 25d | 1 | 0.19mi |
| 8117 Honeysuckle Lake Dr North Charleston, SC | 2.0–3.0 | 1.5 | 1250 | $1,550 | $1.24 | 25d | 1 | 0.43mi |
| 3311 Mountainbrook Ave North Charleston, SC | 1.0–3.0 | 1.5 | 1204 | $1,749 | $1.45 | 4d | 12 | 0.66mi |
| 8350 Sentry Cir North Charleston, SC | 4.0 | 2.5 | 2594 | $2,725 | $1.05 | 25d | 1 | 0.70mi |
| 98 Peppertree Ln North Charleston, SC | 3.0 | 2.0 | 1386 | $2,231 | $1.61 | 25d | 1 | 0.81mi |
| 3058 Nantuckett Ave North Charleston, SC | 3.0 | 2.0 | 1278 | $1,995 | $1.56 | 16d | 1 | 0.90mi |
| 8031 Hyannis Ct North Charleston, SC | 4.0 | 3.0 | 1500 | $2,150 | $1.43 | 20d | 1 | 0.98mi |
| 8180 Windsor Hill Blvd North Charleston, SC | 2.0–3.0 | 1.0–2.0 | 1136 | $1,683 | $1.48 | 25d | 1 | 0.98mi |
| 8486 William Moultrie Dr North Charleston, SC | 3.0 | 2.0 | 1454 | $2,300 | $1.58 | 4d | 1 | 1.05mi |
| 2957 Explorer Dr North Charleston, SC | 3.0 | 3.0 | 1880 | $2,600 | $1.38 | 25d | 1 | 1.23mi |
| 3001 Cypress Lake Rd North Charleston, SC | 1.0–3.0 | 1.0–2.5 | 1008 | $2,600 | $2.58 | 4d | 26 | 1.38mi |
| 3000 Cypress Lk Rd North Charleston, SC | 1.0–3.0 | 1.0–2.0 | 1121 | $2,343 | $2.09 | 4d | 29 | 1.44mi |
| 7853 Lumberton Rd North Charleston, SC | 3.0 | 2.5 | 2063 | $2,450 | $1.19 | 16d | 1 | 1.48mi |
Listing history 28 events
-
2026-06-18days on market $279,600 Active 209 DOM
-
2026-06-17days on market $279,600 Active 208 DOM
-
2026-06-16days on market $279,600 Active 207 DOM
-
2026-06-15pricedays on market $279,600 Active 206 DOM
-
2026-06-10days on market $279,700 Active 201 DOM
-
2026-06-09days on market $279,700 Active 200 DOM
-
2026-06-08days on market $279,700 Active 199 DOM
-
2026-06-07pricedays on market $279,700 Active 198 DOM
-
2026-06-05days on market $279,800 Active 195 DOM
-
2026-06-03days on market $279,800 Active 194 DOM
-
2026-06-01days on market $279,800 Active 192 DOM
-
2026-05-31days on market $279,800 Active 191 DOM
-
2026-05-22price $279,900
-
2026-05-21status Active
-
2026-05-20historical
-
2026-05-15price $284,700
-
2026-05-02price $284,800
-
2026-05-01price $284,900
-
2026-04-11price $289,900
-
2026-03-01price $294,900
-
2025-11-19$299,900 Active
-
2004-11-08soldstatus $99,000
-
2004-10-29soldstatus $99,000 833-char remark
Show marketing remark (833 chars)
<B>THIS IS THE BEST VALUE AROUND BY FAR!</B> TRI-LEVEL HOME WITH <U>TONS OF POTENTIAL!!</U>, CLOSE TO SCHOOLS AND SHOPPING, SHORT DRIVE TO BASES AND DOWNTOWN CHARLESTON, OUTSIDE STORAGE BUILDING CONVEYS, FENCED BACKYARD, IDEAL FOR PETS. <B>KITCHEN HAS BRAND NEW DISWASHER, NEWER GAS STOVE, AND THE FRIDGE CONVEYS TO BUYER!</B> , BAY WINDOW IN LIVING ROOM. <B>NEW A/C SYSTEM</B>, <U>HARDWOOD FLOORS UNDER CARPET</U> IN LIVING ROOM AND DINING AREA, LARGE SUNROOM W/SEPERATE HEATING AND AIR AND CEILING FAN. SEPERATE LIBRARY/ OFFICE WITH CUSTOM BOOK SHELVES AND TWO COMPUTER DESKS. NOT TO MENTION THE HUGE LAUNDRY ROOM WITH A LARGE CUSTOME CEADER CLOSET! THIS HOME IS PERFECT FOR A GROWING FAMILY. LOTS OF SPACE TO STRETCH OUT! THERE IS SOMETHING FOR EVERYONE INTHIS HOME! SELLER IS MOTIVATED, AND THIS HOME IS PRICED TO SELL QUICK!
-
2004-09-17historical
-
2004-09-07$104,500 833-char remark
Show marketing remark (833 chars)
<B>THIS IS THE BEST VALUE AROUND BY FAR!</B> TRI-LEVEL HOME WITH <U>TONS OF POTENTIAL!!</U>, CLOSE TO SCHOOLS AND SHOPPING, SHORT DRIVE TO BASES AND DOWNTOWN CHARLESTON, OUTSIDE STORAGE BUILDING CONVEYS, FENCED BACKYARD, IDEAL FOR PETS. <B>KITCHEN HAS BRAND NEW DISWASHER, NEWER GAS STOVE, AND THE FRIDGE CONVEYS TO BUYER!</B> , BAY WINDOW IN LIVING ROOM. <B>NEW A/C SYSTEM</B>, <U>HARDWOOD FLOORS UNDER CARPET</U> IN LIVING ROOM AND DINING AREA, LARGE SUNROOM W/SEPERATE HEATING AND AIR AND CEILING FAN. SEPERATE LIBRARY/ OFFICE WITH CUSTOM BOOK SHELVES AND TWO COMPUTER DESKS. NOT TO MENTION THE HUGE LAUNDRY ROOM WITH A LARGE CUSTOME CEADER CLOSET! THIS HOME IS PERFECT FOR A GROWING FAMILY. LOTS OF SPACE TO STRETCH OUT! THERE IS SOMETHING FOR EVERYONE INTHIS HOME! SELLER IS MOTIVATED, AND THIS HOME IS PRICED TO SELL QUICK!
-
2004-01-18$112,750
-
1998-08-05soldstatus $78,500
-
1981-01-08soldstatus $52,390
ⓘ Source: listings_history table (triggers on properties + properties_extension) + one-shot
backfill from property_details.listing_events for pre-trigger history.
Tax reassessment forecast SC · Resets to sale price
- Current annual tax
- $742 · $62/mo
- Projected year-2 tax
- $1,594 · $133/mo
- Expected delta
- +$852/yr (+$71/mo · 114.9%)
ⓘ Screening estimate from a state-policy table — verify with the county assessor before closing.
Climate risk First Street
- Flood 1/10 Low FEMA zone X (unshaded) · 0% chance over 30 yrs
- Wildfire 4/10 Moderate
- Heat 9/10 Extreme 7 d/yr ≥107°F today · 17 d/yr by 30 yrs out
- Wind 8/10 Severe 99% chance of damaging wind over 30 yrs
- Air quality 2/10 Low 2 unhealthy d/yr today · 2 by 30 yrs out
Nearby sold comps map
Loading sold comps map…
Walkable amenities ~0.75 mi
Loading nearby amenities…
Taxation est. · year 1
- Rental income
- $30,345
- − Mortgage interest
- −$15,662
- − Property taxes
- −$742
- − Insurance
- −$1,398
- − Repairs & maintenance
- −$2,428
- − Management
- −$2,428
- − Depreciation
- −$8,134
- Taxable loss
- −$446
- Est. tax savings @ 24.0%
- +$107
- After-tax cash flow
- $4,345/yr
For passive investors: Depreciation is non-cash, so a rental often shows a tax loss while cash-flowing — sheltering income. Rental losses are passive: they offset passive income freely, and up to $25,000/yr can offset ordinary (W-2) income if you actively participate and your MAGI is under $100k (phasing out to $0 by $150k); unused losses carry forward. On sale, claimed depreciation is recaptured at up to 25%, and gains may owe capital-gains tax (a 1031 exchange can defer both). Figures are a year-1 estimate at your 24.0% rate — not tax advice; consult a CPA.
Schools (NCES district)
- District
- Charleston 01
- NCES district ID
- 4501440
- Math proficiency
- 48% ▼ -2.00%
- Reading proficiency
- 53% ▬ 0.00%
- Median HH income
- $52,376
- Composite
- 43.41/100
- National rank
- #3018
- State rank
- #7 of 80 in SC
Livability — North Charleston
- Score
- 66/100
- State rank
- #122
- US rank
- #12222
Category grades
Schools grade is shown separately in the Schools card above.
Census & demographics
- Census place
- North Charleston, SC
- County
- Dorchester County · 182,866 people
- City population
- 108,266
- Metro
- Charleston-North Charleston, SC
- Population (ZIP)
- 23,959
- Household income
- $72,661
- Rent vs Own
- Severe rent burden
- 738.0
Population outlook (Charleston County) Hauer SSP2
- Today (2025)
- 480,562 people
- By 2030
- 525,921 · +9.4%
- By 2040
- 612,189 · +27.4%
- By 2050
- 691,627 · +43.9%
- By 2075
- 847,979 · +76.5%
- By 2100
- 926,482 · +92.8%
Race, ethnicity, and origin ACS 2023
- Neighborhood character
- Diverse neighborhood (Simpson 0.66)
- Race & ethnicity
- White 41% Black 39% Hispanic / Latino 11% Asian 5% Two or more races 3%
- Hispanic origin (detail)
- Mexican 6% Puerto Rican 1%
- Common ancestry
- Slovak 2% Italian 2% Lithuanian 1%
- Foreign-born
- 10% · Canada, China, Vietnam
- Languages at home
- 86% English-only · Spanish 10% Chinese 1% Other Asian/Pacific 1%
Political lean MEDSL · Charleston
- 2024 margin
- Lean D (+5.7) · D 51.9% · R 46.3% · Other 1.8%
- 2008→2024 swing
- -2.7pp toward R · 2008: 8.3pp · 2024: 5.7pp
- All cycles
- 2024: D+5.7 2020: D+12.9 2016: D+7.9 2012: D+2.4 2008: D+8.3
Not yet ingested
- Civics
- —
Market trends
- HPI YoY
- ▼ -46.51%
- Current HPI
- 271.2116
- Rent YoY
- ▲ 1.83%
- Metro
- Charleston-North Charleston, SC
- State GDP YoY
- ▲ 4.51%
- F500 in state
- 2
Industry mix (Fortune 500 HQ in SC)
| Industry | F500 HQs | Revenue |
|---|---|---|
| Packaging | 1 | $7B |
|
||
Price history
+434.3% since first listed16 events — show timeline
- 2026-05-22 Price Changed $279,900 Charleston Trident MLS
- 2026-05-21 Relisted — Charleston Trident MLS
- 2026-05-20 Listing Removed — Charleston Trident MLS
- 2026-05-15 Price Changed $284,700 Charleston Trident MLS
- 2026-05-02 Price Changed $284,800 Charleston Trident MLS
- 2026-05-01 Price Changed $284,900 Charleston Trident MLS
- 2026-04-11 Price Changed $289,900 Charleston Trident MLS
- 2026-03-01 Price Changed $294,900 Charleston Trident MLS
- 2025-11-19 Listed $299,900 Charleston Trident MLS
- 2004-11-08 Sold (Public Records) $99,000 Public Records
- 2004-10-29 Sold (MLS) $99,000 Charleston Trident MLS
- 2004-09-17 Listing Removed — Charleston Trident MLS
- 2004-09-07 Listed $104,500 Charleston Trident MLS
- 2004-01-18 Listed $112,750 Charleston Trident MLS
- 1998-08-05 Sold (Public Records) $78,500 Public Records
- 1981-01-08 Sold (Public Records) $52,390 Public Records
Property tax history
-8.9%/yrLatest (2022): $742 · -3.4% YoY. Source: county tax records.
Cash-flow waterfall
monthlySold comps — $/sqft
last 12 mo · ≤1 miLoading sold comps…