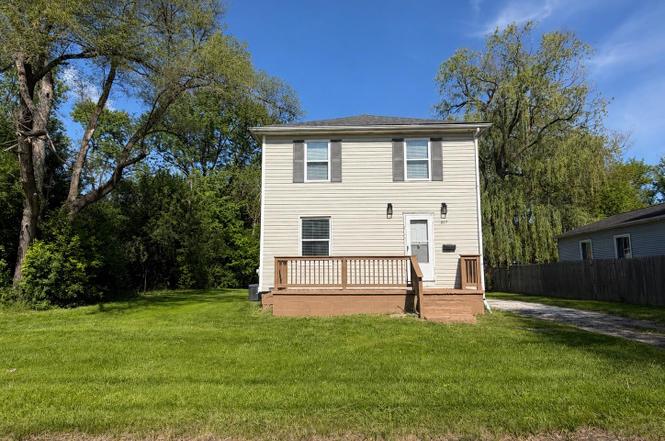
627 Franklin Rd · Pontiac, MI
Flood risk 1/10 · Minimal
- FEMA flood zone
- X (unshaded)
- Chance of flooding over 30 yrs
- 0.0%
- Est. flood insurance / yr
- $473 – $860
Fire risk 1/10 · Minimal
- Est. fire insurance / yr
- $784 – $1,456
Heat risk 2/10 · Minimal
- Hot days now (above 96°F)
- 7 days/yr
- Hot days in 30 yrs
- 15 days/yr
Wind risk 2/10 · Minimal
- Chance of severe wind over 30 yrs
- —
Air-quality risk 3/10 · Minor
- Unhealthy air days now
- 2 days/yr
- Unhealthy air days in 30 yrs
- 4 days/yr
Risk factors via First Street. Map © Google.
Why this score? — see what drove the D+ grade
The composite is a weighted blend of 9 inputs, each scored 0–100. Each bar is that input's sub-score; the figure is the points it added to the 100-point composite (weight × sub-score).
- Cash flow +23.5/30.0
- DSCR +7.6/10.0
- 1% rule +5.3/10.0
- Livability +3.2/5.0
- Rent growth +2.5/5.0
- Condition / age +2.5/5.0
- Schools +1.0/10.0
- ARV discount +0.0/15.0
- Appreciation +0.0/10.0
$150,000
🖨 Deal sheet 📄 Offer letter ✓ Due diligence
Listing remarks MLS
Excellent Potential! Spacious 3 Bed, 1 Bath Colonial (1,126 sqft) w/ functional layout. Basement and Oversized 2 Car Garage. NEWER HVAC '23, Roof '23, Water tank '24. Central AC. All Appliances stay. Generous lot, centrally located near shopping and major roads. Sold As-Is; Immediate Occupancy.
Key facts
- 0.24 acre lot
- 2 garage spots
- Built 1910
Property features AI
Exterior
- Parking: Detached garage with 2 spaces; garage faces side
- Utilities: Public water; Public sewer
- Home design: Single-family residence; Two levels; Ground-level entry with steps
- Construction: Block foundation; Built with vinyl siding
- Exterior features: Asphalt roof; Vinyl siding; Porch; Outdoor lighting; Paved road access; Lot dimensions approximately 73 x 145.6 (0.24 acres)
Interior
- Kitchen: Dishwasher; Disposal; Gas cooktop; Microwave; Free-standing refrigerator
- Bedrooms: 6 total rooms (layout includes bedrooms and living spaces)
- Bathrooms: 1 full bathroom
- Heating & cooling: Forced air heating (natural gas); Central air; Window unit(s)
- Interior features: Lighting; Porch; Back yard fencing; Unfinished basement
- Laundry & utility: Washer; Dryer
Neighborhood map
What this means for you Summary
Snapshot
- This is a 3-bed/1.0-bath single-family listed at $150k.
Deal economics
- At list price, monthly cash flow is $281 ($3k/yr) — positive.
- The deal already cash-flows at list — no discount required.
- Meets the 1% rule at list price ($2k rent vs $150k).
- Recommended offer: $148k (1.5% below list) — sets the bar for market timing.
- Cap rate 8.5% vs local median 6.7% in Pontiac — meaningfully above typical; check what's discounted (condition, days-on-market, listing class) to confirm the premium yield is real.
Location & tenants
- Location reads 64/100 on livability (#499 in MI) — a middle-class / working-renter tenant base. Strengths: commute A+, cost of living A+, housing A+; Watch: health & safety D, schools F, crime F.
- Pontiac City School District (urban): math 8% / reading 17% proficiency, ranked #514 of 540 in MI (top 95%) — low school quality limits family demand, transient renter base, plan for 1-2y turnover; 81% free/reduced lunch — lower-income household profile, screen leases tightly.
- Market conditions: 100 active listings in the ZIP; 11 comparable units currently listed for rent nearby; rentals at typical pace (median 17d on market — plan ~3-4 weeks tenant-placement turnaround); 2,614 units permitted in Oakland County in 2024 (721 in 5+ unit buildings).
- This rent runs 36% of the median local income ($51k/yr) — at the standard rent-burdened threshold; future hikes will face affordability resistance.
Forward outlook
- Local home prices are declining (-3.0%/yr); year-one equity from $1k of loan paydown is wiped out by about $4k of value loss. Plan a longer hold.
- Oakland County population projected at +10% by 2050 — modest demand growth; plan on rents tracking national, not racing it.
Negotiation context
- It's been on market 20 days — a 2% lower offer ($148k) is reasonable based on typical stale-listing flexibility.
- 4 sale attempts since 19y ago with the ask held roughly flat each time — persistent listings suggest the price (not the market) is what's stuck; bring a comps-based counter.
- Current owner paid $15k; list at $150k implies a 900% gain — meaningful room to come down on a strong offer.
Risks & watch-outs
- Watch-outs: built in 1910 — expect roof / HVAC / electrical / plumbing capex.
Questions for the listing agent
- Built in 1910 — when were the roof, HVAC, electrical panel, plumbing, and water heater last replaced?
- Is there a deadline driving the sale (1031 exchange, divorce, estate, relocation)? That informs how much negotiation room exists.
- Schools are F-rated, which usually means shorter tenancies and higher turnover. Who's the typical renter profile here, and what's been the actual vacancy rate?
- Crime grade is F in this area — have there been break-ins, vandalism, or insurance claims at this property in the last 3 years? What carrier currently insures it and at what premium?
- The area grade is low — what's the realistic commute time and amenity access for the typical tenant pool here? Any planned neighborhood developments (good or bad) we should know about?
- What's the average days-on-market for RENTAL listings here right now (not sales)? A rising rental-DOM trend means longer vacancies and softer asking-rent achievability than the comps imply.
- What's the recent tenant-quality profile in this submarket — average credit score on applications, eviction rate, late-payment / NSF rate, and stable-employment percentage? A property-management company in the area should have these aggregated.
- How much new for-sale + rental construction is in the pipeline within 1–3 miles? Heavy new supply typically softens prices + rents 12–24 months out; constrained supply supports both.
Investment metrics
- 1% rule
- 1.03% ✓
- Cap rate
- 8.54%
- Cash-on-cash
- 8.01%
- DSCR
- 1.36
- GRM
- 8.1
CMA / ARV
- ARV (on-the-fly)
- $106,996
- Comps found
- 12
Show comp detail 12 sales within ~0.75 mi
| Address | Dist | Beds/Ba | Sqft | Sold | Price | $/sf | Match |
|---|---|---|---|---|---|---|---|
| 483 Pearsall Ave | 0.13mi | 2/1.5 (-1) | 1,138 (-2%) | 3mo | $139,900 | $123 | 81 |
| 497 Montana Ave | 0.44mi | 4/1.0 (+1) | 1,195 (+3%) | 4mo | $102,000 | $85 | 67 |
| 442 Howland Ave | 0.43mi | 2/1.0 (-1) | 1,159 (-0%) | 11mo | $135,000 | $116 | 66 |
| 604 California Ave | 0.38mi | 3/2.0 | 1,161 (-0%) | 16mo | $117,000 | $101 | 64 |
| 23 Hillsmont Ave | 0.57mi | 3/1.0 | 1,089 (-6%) | 0mo | $100,000 | $92 | 62 |
| 564 Highland Ave | 0.17mi | 3/1.0 | 1,003 (-14%) | 12mo | $68,000 | $68 | 60 |
| 551 Nebraska Ave | 0.40mi | 3/2.0 | 1,247 (+7%) | 11mo | $66,000 | $53 | 56 |
| 273 Dellwood Ave | 0.34mi | 3/1.0 | 1,002 (-14%) | 8mo | $125,000 | $125 | 54 |
| 276 Hughes Ave | 0.67mi | 3/1.0 | 1,184 (+2%) | 16mo | $52,502 | $44 | 53 |
| 608 Nevada Ave | 0.52mi | 3/1.0 | 1,039 (-11%) | 7mo | $130,000 | $125 | 52 |
| 381 South Blvd W | 0.55mi | 3/1.5 | 1,240 (+7%) | 14mo | $95,000 | $77 | 50 |
| 353 South Blvd W | 0.53mi | 2/1.0 (-1) | 1,303 (+12%) | 12mo | $90,000 | $69 | 40 |
Match score weights: distance 35% · size 25% · config 20% · recency 20%. Top-matched comps best support the ARV.
Projected returns pro-forma
-3.0% appreciation · 3.0% rent growth · sell at horizon
- IRR
- -4.1%
- Equity multiple
- 0.85×
- Total profit
- $-6,475
- Equity at exit
- $22,365
- IRR
- 5.5%
- Equity multiple
- 1.41×
- Total profit
- $17,229
- Equity at exit
- $12,969
Cash invested: $42,000 (down + closing). Projections, not guarantees.
Landlord ↔ Tenant lean methodology
- Overall (STATE)
- 62 Landlord-Friendly
- State Michigan
- 62 Landlord-Friendly · EVEN
- County
- — inherits STATE
- City
- — inherits STATE
ZIP-level market 48341
- Active inventory
- 100
- Price-to-rent
- 8.1×
Monthly cashflow live
- Estimated rent
- $1,549 high interval (Pro) →
- Mortgage (P&I)
- −$787
- Tax from tax record
- −$94 /mo · $1,130/yr
- Insurance
- −$62
- HOA
- −$0
- Vacancy / Maint / Mgmt
- −$325
- Net cashflow
- $281
Break-even live
UW: 25.0% down · 7.5% · 30yr · 1.5% tax · 5.0% vac · 8.0% maint · 8.0% mgmt
Financing live
Cash to close
- Down payment
- $37,500
- Closing costs
- $4,500
- Reserves months
- —
- Total cash needed
- —
Loan-product check · same deal, 3 products live
Conventional
25% down · 7.5% · 30yr
- Down + closing
- —
- Monthly P&I
- —
- Monthly cashflow
- —
- DSCR
- —
- Eligible?
- —
Personal DTI + credit; lowest rate.
DSCR
20% down · 8.5% · 30yr
- Down + closing
- —
- Monthly P&I
- —
- Monthly cashflow
- —
- DSCR
- —
- Eligible?
- —
No personal income docs; deal must DSCR.
Hard money
10% down · 12.0% · 12mo
- Down + closing
- —
- Monthly P&I
- —
- Monthly cashflow
- —
- DSCR
- —
- Eligible?
- —
Short-term bridge; refi at stabilization.
Rent comps 11 comps
| Address | Beds | Baths | Sqft | Rent | $/sqft | DOM | Units | Dist |
|---|---|---|---|---|---|---|---|---|
| 594 Colorado Ave Pontiac, MI | 3.0 | 1.0 | 1008 | $1,075 | $1.07 | 24d | 1 | 0.39mi |
| 471 Montana Ave Pontiac, MI | 3.0 | 1.0 | 1017 | $1,599 | $1.57 | 43d | 1 | 0.44mi |
| 611 Montana Ave Pontiac, MI | 3.0 | 1.0 | 1112 | $1,350 | $1.21 | 43d | 1 | 0.53mi |
| 2083 S Telegraph Rd Bloomfield Twp, MI | 1.0–2.0 | 1.0–2.0 | 938 | $2,200 | $2.34 | 1d | 24 | 0.53mi |
| 249 W Wilson Ave Unit 1 Pontiac, MI | 3.0 | 1.0 | 900 | $1,540 | $1.71 | 43d | 1 | 0.73mi |
| 900 Martin Luther King Jr Blvd S Pontiac, MI | 1.0–2.0 | 1.0 | 800 | $1,065 | $1.33 | 5d | 1 | 0.84mi |
| 124 Alice Ave Bloomfield Township, MI | 3.0 | 1.0 | 1440 | $2,000 | $1.39 | 5d | 1 | 0.90mi |
| 1974 Klingensmith Rd #4 Bloomfield Hills, MI | 2.0 | 2.0 | 1219 | $1,995 | $1.64 | 18d | 1 | 1.04mi |
| 442 Central Ave Pontiac, MI | 2.0 | 1.0 | 1500 | $1,250 | $0.83 | 16d | 1 | 1.08mi |
| 442 Central Ave Unit 1 Pontiac, MI | 2.0 | 1.0 | 1500 | $1,500 | $1.00 | 5d | 1 | 1.08mi |
| 489 Central Ave Pontiac, MI | 2.0 | 1.0 | 1140 | $1,195 | $1.05 | 5d | 1 | 1.16mi |
Listing history 21 events
-
2026-06-16statusdays on market $150,000 Pending 20 DOM
-
2026-06-15days on market $150,000 Active Under Contract 19 DOM
-
2026-06-13days on market $150,000 Active Under Contract 17 DOM
-
2026-06-13days on market $150,000 Active Under Contract 16 DOM
-
2026-06-09days on market $150,000 Active Under Contract 13 DOM
-
2026-06-08days on market $150,000 Active Under Contract 12 DOM
-
2026-06-07days on market $150,000 Active Under Contract 11 DOM
-
2026-06-04days on market $150,000 Active Under Contract 8 DOM
-
2026-06-03days on market $150,000 Active Under Contract 7 DOM
-
2026-06-02days on market $150,000 Active Under Contract 6 DOM
-
2026-06-01days on market $150,000 Active Under Contract 5 DOM
-
2026-05-31statusdays on market $150,000 Active Under Contract 4 DOM
-
2026-05-27$150,000 Active
Show marketing remark (295 chars)
Excellent Potential! Spacious 3 Bed, 1 Bath Colonial (1,126 sqft) w/ functional layout. Basement and Oversized 2 Car Garage. NEWER HVAC '23, Roof '23, Water tank '24. Central AC. All Appliances stay. Generous lot, centrally located near shopping and major roads. Sold As-Is; Immediate Occupancy.
-
2026-05-27$150,000 Active 295-char remark
Show marketing remark (295 chars)
Excellent Potential! Spacious 3 Bed, 1 Bath Colonial (1,126 sqft) w/ functional layout. Basement and Oversized 2 Car Garage. NEWER HVAC '23, Roof '23, Water tank '24. Central AC. All Appliances stay. Generous lot, centrally located near shopping and major roads. Sold As-Is; Immediate Occupancy.
-
2007-11-26soldstatus $15,000 114-char remark
Show marketing remark (114 chars)
ABSOLUTELY GORGEOUS HOME WITH LIMITLESS POTENTIAL. CONVENIENT LOCATION, SPACIOUS BEDROOMS. A MUST SEE. SOLD AS IS.
-
2007-11-26soldstatus $15,000
Show marketing remark (114 chars)
ABSOLUTELY GORGEOUS HOME WITH LIMITLESS POTENTIAL. CONVENIENT LOCATION, SPACIOUS BEDROOMS. A MUST SEE. SOLD AS IS.
-
2007-11-02historical 114-char remark
Show marketing remark (114 chars)
ABSOLUTELY GORGEOUS HOME WITH LIMITLESS POTENTIAL. CONVENIENT LOCATION, SPACIOUS BEDROOMS. A MUST SEE. SOLD AS IS.
-
2007-09-20$15,400 114-char remark
Show marketing remark (114 chars)
ABSOLUTELY GORGEOUS HOME WITH LIMITLESS POTENTIAL. CONVENIENT LOCATION, SPACIOUS BEDROOMS. A MUST SEE. SOLD AS IS.
-
2007-09-20$15,400
Show marketing remark (114 chars)
ABSOLUTELY GORGEOUS HOME WITH LIMITLESS POTENTIAL. CONVENIENT LOCATION, SPACIOUS BEDROOMS. A MUST SEE. SOLD AS IS.
-
2006-07-10soldstatus $136,000
-
1994-04-20soldstatus $10,000
ⓘ Source: listings_history table (triggers on properties + properties_extension) + one-shot
backfill from property_details.listing_events for pre-trigger history.
Tax reassessment forecast MI · Partial reset (capped growth)
- Current annual tax
- $1,130 · $94/mo
- Projected year-2 tax
- $1,720 · $143/mo
- Expected delta
- +$590/yr (+$49/mo · 52.2%)
ⓘ Screening estimate from a state-policy table — verify with the county assessor before closing.
Climate risk First Street
- Flood 1/10 Low FEMA zone X (unshaded) · 0% chance over 30 yrs
- Wildfire 1/10 Low
- Heat 2/10 Low 7 d/yr ≥96°F today · 15 d/yr by 30 yrs out
- Wind 2/10 Low
- Air quality 3/10 Moderate 2 unhealthy d/yr today · 4 by 30 yrs out
Nearby sold comps map
Loading sold comps map…
Walkable amenities ~0.75 mi
Loading nearby amenities…
Taxation est. · year 1
- Rental income
- $18,589
- − Mortgage interest
- −$8,402
- − Property taxes
- −$1,130
- − Insurance
- −$750
- − Repairs & maintenance
- −$1,487
- − Management
- −$1,487
- − Depreciation
- −$4,364
- Taxable income
- $969
- Est. tax owed @ 24.0%
- −$233
- After-tax cash flow
- $3,134/yr
For passive investors: Depreciation is non-cash, so a rental often shows a tax loss while cash-flowing — sheltering income. Rental losses are passive: they offset passive income freely, and up to $25,000/yr can offset ordinary (W-2) income if you actively participate and your MAGI is under $100k (phasing out to $0 by $150k); unused losses carry forward. On sale, claimed depreciation is recaptured at up to 25%, and gains may owe capital-gains tax (a 1031 exchange can defer both). Figures are a year-1 estimate at your 24.0% rate — not tax advice; consult a CPA.
Schools (NCES district)
- District
- Pontiac City School District
- NCES district ID
- 2628740
- Math proficiency
- 8% ▼ -5.00%
- Reading proficiency
- 17% ▼ -3.00%
- Median HH income
- $33,888
- Composite
- 10.12/100
- National rank
- #9802
- State rank
- #514 of 540 in MI
Livability — Pontiac
- Score
- 64/100
- State rank
- #499
- US rank
- #14703
Category grades
Schools grade is shown separately in the Schools card above.
Census & demographics
- Census place
- Pontiac, MI
- County
- Oakland County · 1,009,092 people
- City population
- 44,593
- Metro
- Detroit-Warren-Dearborn, MI
- Population (ZIP)
- 18,924
- Household income
- $51,390
- Rent vs Own
- Severe rent burden
- 833.0
Population outlook (Oakland County) Hauer SSP2
- Today (2025)
- 1,335,747 people
- By 2030
- 1,375,100 · +2.9%
- By 2040
- 1,435,385 · +7.5%
- By 2050
- 1,469,250 · +10.0%
- By 2075
- 1,531,946 · +14.7%
- By 2100
- 1,450,485 · +8.6%
Race, ethnicity, and origin ACS 2023
- Neighborhood character
- Diverse neighborhood (Simpson 0.61)
- Race & ethnicity
- Black 57% White 22% Hispanic / Latino 12% Two or more races 11% Asian 3%
- Hispanic origin (detail)
- Mexican 4% Puerto Rican 2%
- Common ancestry
- Slovak 2% Romanian 1% Swiss 1%
- Foreign-born
- 10% · Canada
- Languages at home
- 86% English-only · Spanish 9% Other Indo-European 1% Other Asian/Pacific 1%
Political lean MEDSL · Oakland
- 2024 margin
- D (+10.6) · D 54.4% · R 43.8% · Other 1.9%
- 2008→2024 swing
- -3.9pp toward R · 2008: 14.5pp · 2024: 10.6pp
- All cycles
- 2024: D+10.6 2020: D+14.1 2016: D+8.1 2012: D+8.1 2008: D+14.5
Not yet ingested
- Civics
- —
Market trends
- HPI YoY
- ▼ -204.11%
- Current HPI
- 257.8941
- Rent YoY
- —
- Metro
- Detroit-Warren-Dearborn, MI
- State GDP YoY
- ▲ 1.37%
- F500 in state
- 28
Industry mix (Fortune 500 HQ in MI)
| Industry | F500 HQs | Revenue |
|---|---|---|
| Automotive Parts | 3 | $48B |
|
||
| Automotive | 2 | $372B |
|
||
| Chemicals | 1 | $45B |
|
||
| Automotive Retail | 1 | $29B |
|
||
| Healthcare / Medical Devices | 1 | $23B |
|
||
| Automotive Technology | 1 | $20B |
|
||
Price history
+1400.0% since first listed9 events — show timeline
- 2026-05-27 Listed $150,000 REALCOMP
- 2026-05-27 Listed $150,000 MiRealSource-MiMLS
- 2007-11-26 Sold (MLS) $15,000 REALCOMP
- 2007-11-26 Sold (MLS) $15,000 MiRealSource-MiMLS
- 2007-11-02 Listing Removed — MiRealSource-MiMLS
- 2007-09-20 Listed $15,400 REALCOMP
- 2007-09-20 Listed $15,400 MiRealSource-MiMLS
- 2006-07-10 Sold (Public Records) $136,000 Public Records
- 1994-04-20 Sold (Public Records) $10,000 Public Records
Property tax history
+4.4%/yrLatest (2025): $1,130 · +2.7% YoY. Source: county tax records.
Cash-flow waterfall
monthlySold comps — $/sqft
last 12 mo · ≤1 miLoading sold comps…