2230 Lake Park #54 · San Jacinto, CA
Flood risk 3/10 · Minor
- FEMA flood zone
- X
- Chance of flooding over 30 yrs
- 0.1%
- Est. flood insurance / yr
- $507 – $1,088
Fire risk 9/10 · Severe
- Est. fire insurance / yr
- $659 – $1,223
Heat risk 7/10 · Major
- Hot days now (above 102°F)
- 4 days/yr
- Hot days in 30 yrs
- 11 days/yr
Wind risk 1/10 · Minimal
- Chance of severe wind over 30 yrs
- —
Air-quality risk 6/10 · Moderate
- Unhealthy air days now
- 11 days/yr
- Unhealthy air days in 30 yrs
- 13 days/yr
Risk factors via First Street. Map © Google.
Why this score? — see what drove the B grade
The composite is a weighted blend of 9 inputs, each scored 0–100. Each bar is that input's sub-score; the figure is the points it added to the 100-point composite (weight × sub-score).
- Cash flow +30.0/30.0
- 1% rule +10.0/10.0
- DSCR +10.0/10.0
- ARV discount +9.6/15.0
- Rent growth +3.2/5.0
- Livability +3.2/5.0
- Condition / age +2.2/5.0
- Schools +2.1/10.0
- Appreciation +0.0/10.0
$75,000
🖨 Deal sheet 📄 Offer letter ✓ Due diligence
Listing remarks MLS
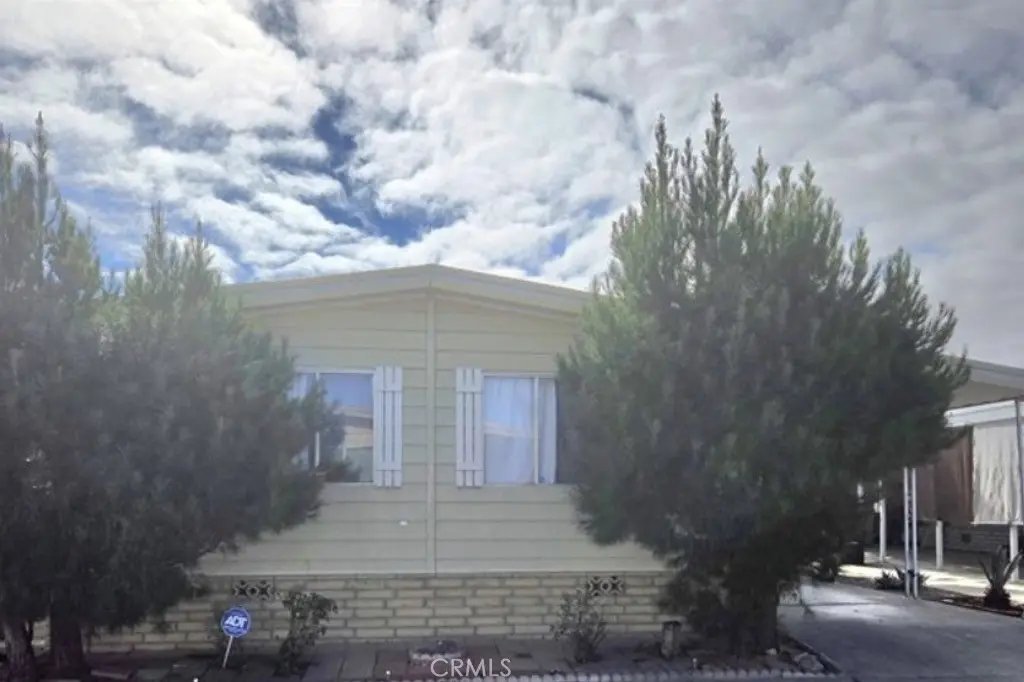
Welcome to Soboba Springs, a desirable 55+ community in San Jacinto. This spacious double-wide mobile home offers approximately 1,300 sq ft of comfortable living space with 2 bedrooms and 2 bathrooms. The home features a large living room and a functional kitchen with plenty of storage, including a cozy coffee nook with a built-in table. An additional room at the back of the kitchen provides flexible space that can be used as a pantry, home office, hobby room, or guest area. The layout is open and practical, making everyday living easy and comfortable. Community amenities include a clubhouse, pool, and social activities, and the location is hard to beat. The Soboba Casino and Event Center is right across the street, offering entertainment and dining, while nearby attractions include Lake Skinner, Diamond Valley Lake, Lake Hemet, and the surrounding mountain areas. Shopping centers, grocery stores, and restaurants are conveniently close. A great opportunity to enjoy relaxed living in a well-located senior community.
Key facts
- Functional kitchen
- Flexible space
- Cozy coffee nook
Tags
Neighborhood map
What this means for you Summary
Snapshot
- This is a 2-bed/2.0-bath manufactured listed at $75k. Condition is rated fair.
Deal economics
- At list price, monthly cash flow is $1k ($17k/yr) — positive.
- The deal already cash-flows at list — no discount required.
- Meets the 1% rule at list price ($2k rent vs $75k).
- Recommended offer: $66k (12.0% below list) — sets the bar for market timing.
- Cap rate 29.0% vs local median 3.8% in San Jacinto — top-decile yield for the area; either an underpriced asset or a hidden risk that comps aren't pricing in. Stress-test before assuming the spread holds.
Location & tenants
- Location reads 63/100 on livability (#467 in CA) — a middle-class / working-renter tenant base. Strengths: housing A+; Watch: employment D+, schools D-, amenities F.
- San Jacinto Unified (suburban): math 13% / reading 36% proficiency, ranked #421 of 517 in CA (top 81%) — low school quality limits family demand, transient renter base, plan for 1-2y turnover; 68% free/reduced lunch — lower-income household profile, screen leases tightly.
- Market conditions: Rents rising (+2.6%/yr); 159 active listings in the ZIP; 9 comparable units currently listed for rent nearby; rentals at typical pace (median 17d on market — plan ~3-4 weeks tenant-placement turnaround); 9,195 units permitted in Riverside County in 2024 (1,512 in 5+ unit buildings).
- This rent runs 43% of the median local income ($68k/yr) — at the standard rent-burdened threshold; future hikes will face affordability resistance.
Forward outlook
- Local home prices are declining (-3.0%/yr); year-one equity from $519 of loan paydown is wiped out by about $2k of value loss. Plan a longer hold.
- Riverside County population projected at +22% by 2050 — long-run rental-demand tailwind backs the buy-and-hold thesis.
- At projected returns (-3.0% appreciation + 2.6% rent growth), your $21k cash investment doubles in ~2 years — after that, you're playing with house money.
Negotiation context
- It's been on market 140 days — a 12% lower offer ($66k) is reasonable based on typical stale-listing flexibility.
- 3 sale attempts since 2y ago; this cycle's ask has dropped $5k (6%) from the opening price — seller is motivated, your offer sets the floor, not the list.
- Current owner paid $60k; 25% above their basis — modest negotiation headroom, anchor on the comps not their cost.
Risks & watch-outs
- Climate carrying-cost: severe wildfire risk; extreme-heat days projected 4→11/yr by 2055 (HVAC capex compounding) — expect insurance premiums to compound above CPI over the hold.
Questions for the listing agent
- It's been on market 140 days. Have you received any prior offers? Is the seller open to a 12% concession, seller financing, or rate buy-down credit?
- Have any recent inspections been done? Can we get a copy of the seller's disclosures and any deferred-maintenance estimates?
- Built in 1971 — when were the roof, HVAC, electrical panel, plumbing, and water heater last replaced?
- Why hasn't it sold? Are there any deal-killer items the seller is aware of (foundation, flood, title, zoning, code violations)?
- Is there a deadline driving the sale (1031 exchange, divorce, estate, relocation)? That informs how much negotiation room exists.
- Schools are D-rated, which usually means shorter tenancies and higher turnover. Who's the typical renter profile here, and what's been the actual vacancy rate?
- What's the average days-on-market for RENTAL listings here right now (not sales)? A rising rental-DOM trend means longer vacancies and softer asking-rent achievability than the comps imply.
- What's the recent tenant-quality profile in this submarket — average credit score on applications, eviction rate, late-payment / NSF rate, and stable-employment percentage? A property-management company in the area should have these aggregated.
- How much new for-sale + rental construction is in the pipeline within 1–3 miles? Heavy new supply typically softens prices + rents 12–24 months out; constrained supply supports both.
Investment metrics
- 1% rule
- 3.27% ✓
- Cap rate
- 29.04%
- Cash-on-cash
- 81.25%
- DSCR
- 4.62
- GRM
- 2.5
CMA / ARV
- ARV (median comp)
- $78,750
- List price
- $75,000
- Delta
- -4.76%
- Verdict
- FAIR
- Comps
- 14 within 1.0 mi
Show comp detail 12 sales within ~0.75 mi
| Address | Dist | Beds/Ba | Sqft | Sold | Price | $/sf | Match |
|---|---|---|---|---|---|---|---|
| 2230 Lake Park Dr #106 | 0.02mi | 2/2.0 | 1,440 (0%) | 2mo | $35,000 | $24 | 97 |
| 2230 Lake Park #127 | 0.18mi | 2/2.0 | 1,440 (0%) | 3mo | $32,000 | $22 | 89 |
| 2230 Lake Park Dr #174 | 0.01mi | 2/2.0 | 1,440 (0%) | 16mo | $142,000 | $99 | 86 |
| 2230 Lake Park Dr #223 | 0.02mi | 2/2.0 | 1,344 (-7%) | 4mo | $77,500 | $58 | 85 |
| 2230 Lake Park Dr #143 | 0.18mi | 2/2.0 | 1,440 (0%) | 14mo | $75,000 | $52 | 80 |
| 2230 Lake Park Dr #133 | 0.02mi | 3/2.0 (+1) | 1,325 (-8%) | 3mo | $195,500 | $148 | 78 |
| 2230 Lake Park #193 | 0.18mi | 2/2.0 | 1,296 (-10%) | 2mo | $118,000 | $91 | 73 |
| 1499 Old Mtn #51 | 0.74mi | 2/2.0 | 1,456 (+1%) | 2mo | $120,000 | $82 | 62 |
| 1499 Old Mountain Ave #93 | 0.70mi | 2/2.0 | 1,440 (0%) | 9mo | $91,500 | $64 | 60 |
| 1499 Old Mountain Ave #30 | 0.74mi | 2/2.0 | 1,440 (0%) | 11mo | $115,000 | $80 | 57 |
| 1499 Old Mountain Ave #145 | 0.74mi | 2/2.0 | 1,440 (0%) | 11mo | $110,000 | $76 | 57 |
| 1499 Old Mtn #88 | 0.74mi | 2/2.0 | 1,344 (-7%) | 0mo | $80,000 | $60 | 54 |
Match score weights: distance 35% · size 25% · config 20% · recency 20%. Top-matched comps best support the ARV.
Projected returns pro-forma
-3.0% appreciation · 2.61% rent growth · sell at horizon
- IRR
- 81.0%
- Equity multiple
- 4.69×
- Total profit
- $77,480
- Equity at exit
- $11,183
- IRR
- 84.3%
- Equity multiple
- 9.59×
- Total profit
- $180,316
- Equity at exit
- $6,485
Cash invested: $21,000 (down + closing). Projections, not guarantees.
Landlord ↔ Tenant lean methodology
- Overall (STATE)
- 18 Strongly Tenant-Friendly
- State California
- 18 Strongly Tenant-Friendly · D+13
- County
- — inherits STATE
- City
- — inherits STATE
ZIP-level market 92583
- Home prices YoY
- -14.8%
- Rents YoY
- 2.6%
- Active inventory
- 159
- Price-to-rent
- 2.5×
Monthly cashflow live
- Estimated rent
- $2,456 high interval (Pro) →
- Mortgage (P&I)
- −$393
- Tax est. 1.5%
- −$94 /mo · $1,125/yr
- Insurance
- −$31
- HOA
- −$0
- Vacancy / Maint / Mgmt
- −$516
- Net cashflow
- $1,422
Break-even live
UW: 25.0% down · 7.5% · 30yr · 1.5% tax · 5.0% vac · 8.0% maint · 8.0% mgmt
Financing live
Cash to close
- Down payment
- $18,750
- Closing costs
- $2,250
- Reserves months
- —
- Total cash needed
- —
Loan-product check · same deal, 3 products live
Conventional
25% down · 7.5% · 30yr
- Down + closing
- —
- Monthly P&I
- —
- Monthly cashflow
- —
- DSCR
- —
- Eligible?
- —
Personal DTI + credit; lowest rate.
DSCR
20% down · 8.5% · 30yr
- Down + closing
- —
- Monthly P&I
- —
- Monthly cashflow
- —
- DSCR
- —
- Eligible?
- —
No personal income docs; deal must DSCR.
Hard money
10% down · 12.0% · 12mo
- Down + closing
- —
- Monthly P&I
- —
- Monthly cashflow
- —
- DSCR
- —
- Eligible?
- —
Short-term bridge; refi at stabilization.
Rent comps 9 comps
| Address | Beds | Baths | Sqft | Rent | $/sqft | DOM | Units | Dist |
|---|---|---|---|---|---|---|---|---|
| 904 Bergamo Ave San Jacinto, CA | 2.0 | 2.0 | 1596 | $2,600 | $1.63 | 10d | 1 | 0.82mi |
| 905 Verona Ave San Jacinto, CA | 2.0 | 2.0 | 1417 | $2,300 | $1.62 | 17d | 1 | 0.85mi |
| 1129 Osprey St San Jacinto, CA | 3.0 | 2.0 | 1582 | $2,700 | $1.71 | 43d | 1 | 0.97mi |
| 492 Foursquare Pl San Jacinto, CA | 3.0 | 2.0 | 1573 | $3,500 | $2.23 | 1d | 1 | 1.25mi |
| 620 E Main St San Jacinto, CA | 2.0 | 2.0 | 900 | $1,600 | $1.78 | 24d | 1 | 1.25mi |
| 1939 Hooper Dr San Jacinto, CA | 2.0 | 2.0 | 1111 | $1,950 | $1.76 | 24d | 1 | 1.37mi |
| 646 Field Maple Pl GLMN HOT SPGS, CA | 3.0–4.0 | 2.0–3.0 | 1825 | $2,850 | $1.56 | 1d | 9 | 1.38mi |
| 1809 Rue Chenin Blanc San Jacinto, CA | 3.0 | 2.0 | 1548 | $2,500 | $1.61 | 5d | 1 | 1.38mi |
| 621 S Mistletoe Ave San Jacinto, CA | 2.0 | 2.0 | 1500 | $2,000 | $1.33 | 43d | 1 | 1.42mi |
Listing history 21 events
-
2026-06-18days on market $75,000 Active 140 DOM
-
2026-06-17days on market $75,000 Active 139 DOM
-
2026-06-16days on market $75,000 Active 138 DOM
-
2026-06-15days on market $75,000 Active 137 DOM
-
2026-06-13days on market $75,000 Active 135 DOM
-
2026-06-13days on market $75,000 Active 134 DOM
-
2026-06-09days on market $75,000 Active 131 DOM
-
2026-06-08days on market $75,000 Active 130 DOM
-
2026-06-07pricedays on market $75,000 Active 129 DOM
-
2026-06-04days on market $79,999 Active 126 DOM
-
2026-06-03days on market $79,999 Active 125 DOM
-
2026-06-02days on market $79,999 Active 124 DOM
-
2026-06-01days on market $79,999 Active 123 DOM
-
2026-05-31days on market $79,999 Active 122 DOM
-
2026-01-29$79,999 Active 1030-char remark
Show marketing remark (1030 chars)
Welcome to Soboba Springs, a desirable 55+ community in San Jacinto. This spacious double-wide mobile home offers approximately 1,300 sq ft of comfortable living space with 2 bedrooms and 2 bathrooms. The home features a large living room and a functional kitchen with plenty of storage, including a cozy coffee nook with a built-in table. An additional room at the back of the kitchen provides flexible space that can be used as a pantry, home office, hobby room, or guest area. The layout is open and practical, making everyday living easy and comfortable. Community amenities include a clubhouse, pool, and social activities, and the location is hard to beat. The Soboba Casino and Event Center is right across the street, offering entertainment and dining, while nearby attractions include Lake Skinner, Diamond Valley Lake, Lake Hemet, and the surrounding mountain areas. Shopping centers, grocery stores, and restaurants are conveniently close. A great opportunity to enjoy relaxed living in a well-located senior community.
-
2026-01-25historical
-
2025-10-25$79,999 Active
-
2024-06-11soldstatus $60,000 Closed Sale
-
2024-05-02status Pending Sale
-
2024-04-23$60,000 Active
-
2024-04-21historical $60,000
ⓘ Source: listings_history table (triggers on properties + properties_extension) + one-shot
backfill from property_details.listing_events for pre-trigger history.
Climate risk First Street
- Flood 3/10 Moderate FEMA zone X · 10% chance over 30 yrs
- Wildfire 9/10 Extreme
- Heat 7/10 Severe 4 d/yr ≥102°F today · 11 d/yr by 30 yrs out
- Wind 1/10 Low
- Air quality 6/10 Major 11 unhealthy d/yr today · 13 by 30 yrs out
Nearby sold comps map
Loading sold comps map…
Walkable amenities ~0.75 mi
Loading nearby amenities…
Taxation est. · year 1
- Rental income
- $29,470
- − Mortgage interest
- −$4,201
- − Property taxes
- −$1,125
- − Insurance
- −$375
- − Repairs & maintenance
- −$2,358
- − Management
- −$2,358
- − Depreciation
- −$2,182
- Taxable income
- $16,872
- Est. tax owed @ 24.0%
- −$4,049
- After-tax cash flow
- $13,012/yr
For passive investors: Depreciation is non-cash, so a rental often shows a tax loss while cash-flowing — sheltering income. Rental losses are passive: they offset passive income freely, and up to $25,000/yr can offset ordinary (W-2) income if you actively participate and your MAGI is under $100k (phasing out to $0 by $150k); unused losses carry forward. On sale, claimed depreciation is recaptured at up to 25%, and gains may owe capital-gains tax (a 1031 exchange can defer both). Figures are a year-1 estimate at your 24.0% rate — not tax advice; consult a CPA.
Condition & rehab AI · 1 photo
This manufactured home requires moderate repairs and maintenance, including new siding, flooring, and painting, to improve its condition and value.
Repairs flagged
- Major exterior siding — Significant wear and tear
- Major flooring — Worn carpet
- Major interior walls — Peeling paint
Value-add opportunities
- Both new exterior siding — Enhances curb appeal and value
- Both new flooring — Improves living space and value
- Both paint interior walls — Enhances interior appearance and value
Renovation cost estimate screening
| Repair item | Severity | Est. cost |
|---|---|---|
| exterior siding · Significant wear and tear | Major | $15,000–50,000 |
| flooring · Worn carpet | Major | $15,000–50,000 |
| interior walls · Peeling paint | Major | $15,000–50,000 |
| Total estimated repair cost · 3 items | $45,000–150,000 |
Value-add ROI direction
- Both new exterior siding — Enhances curb appeal and value ↑
- Both new flooring — Improves living space and value ↑
- Both paint interior walls — Enhances interior appearance and value ↑
ⓘ Cost ranges are severity-bucket heuristics (US national rule-of-thumb). Get contractor quotes + a written scope before underwriting a rehab budget.
Schools (NCES district)
- District
- San Jacinto Unified
- NCES district ID
- 0634440
- Math proficiency
- 13% ▼ -9.00%
- Reading proficiency
- 36% ▬ 0.00%
- Median HH income
- $43,560
- Composite
- 20.94/100
- National rank
- #8478
- State rank
- #421 of 517 in CA
Livability — San Jacinto
- Score
- 63/100
- State rank
- #467
- US rank
- #15889
Category grades
Schools grade is shown separately in the Schools card above.
Census & demographics
- Census place
- San Jacinto, CA
- County
- Riverside County · 2,287,001 people
- City population
- 33,778
- Metro
- Riverside-San Bernardino-Ontario, CA
- Population (ZIP)
- 33,778
- Household income
- $68,351
- Rent vs Own
- Severe rent burden
- 747.0
Population outlook (Riverside County) Hauer SSP2
- Today (2025)
- 2,664,475 people
- By 2030
- 2,802,692 · +5.2%
- By 2040
- 3,050,904 · +14.5%
- By 2050
- 3,256,783 · +22.2%
- By 2075
- 3,655,058 · +37.2%
- By 2100
- 3,766,594 · +41.4%
Race, ethnicity, and origin ACS 2023
- Neighborhood character
- Diverse neighborhood (Simpson 0.57)
- Race & ethnicity
- Hispanic / Latino 60% White 26% Two or more races 23% Black 5% Asian 3% Native American 3%
- Hispanic origin (detail)
- Mexican 52%
- Common ancestry
- Lithuanian 1% Iranian 1% Portuguese 1%
- Foreign-born
- 20% · Canada
- Languages at home
- 56% English-only · Spanish 40% Tagalog/Filipino 2% Other Asian/Pacific 1%
Political lean MEDSL · Riverside
- 2024 margin
- Toss-up / Even · D 48.0% · R 49.3% · Other 2.6%
- 2008→2024 swing
- -3.6pp toward R · 2008: 2.3pp · 2024: -1.3pp
- All cycles
- 2024: R+1.3 2020: D+8.0 2016: D+4.3 2012: R+0.4 2008: D+2.3
Not yet ingested
- Civics
- —
Market trends
- HPI YoY
- ▼ -71.15%
- Current HPI
- 407.8584
- Rent YoY
- ▲ 2.61%
- Metro
- Riverside-San Bernardino-Ontario, CA
- State GDP YoY
- ▲ 3.21%
- F500 in state
- 116
Industry mix (Fortune 500 HQ in CA)
| Industry | F500 HQs | Revenue |
|---|---|---|
| Technology | 27 | $1,492B |
|
||
| Financial Services | 3 | $174B |
|
||
| Retail | 3 | $44B |
|
||
| Insurance | 3 | $26B |
|
||
| Media / Entertainment | 2 | $115B |
|
||
| Pharmaceuticals / Biotech | 2 | $62B |
|
||
Price history
+33.3% since first listed7 events — show timeline
- 2026-01-29 Listed $79,999 CRMLS
- 2026-01-25 Listing Removed — CRMLS
- 2025-10-25 Listed $79,999 CRMLS
- 2024-06-11 Sold (MLS) $60,000 CRMLS
- 2024-05-02 Pending — CRMLS
- 2024-04-23 Listed $60,000 CRMLS
- 2024-04-21 Coming Soon $60,000 CRMLS
Cash-flow waterfall
monthlySold comps — $/sqft
last 12 mo · ≤1 miLoading sold comps…