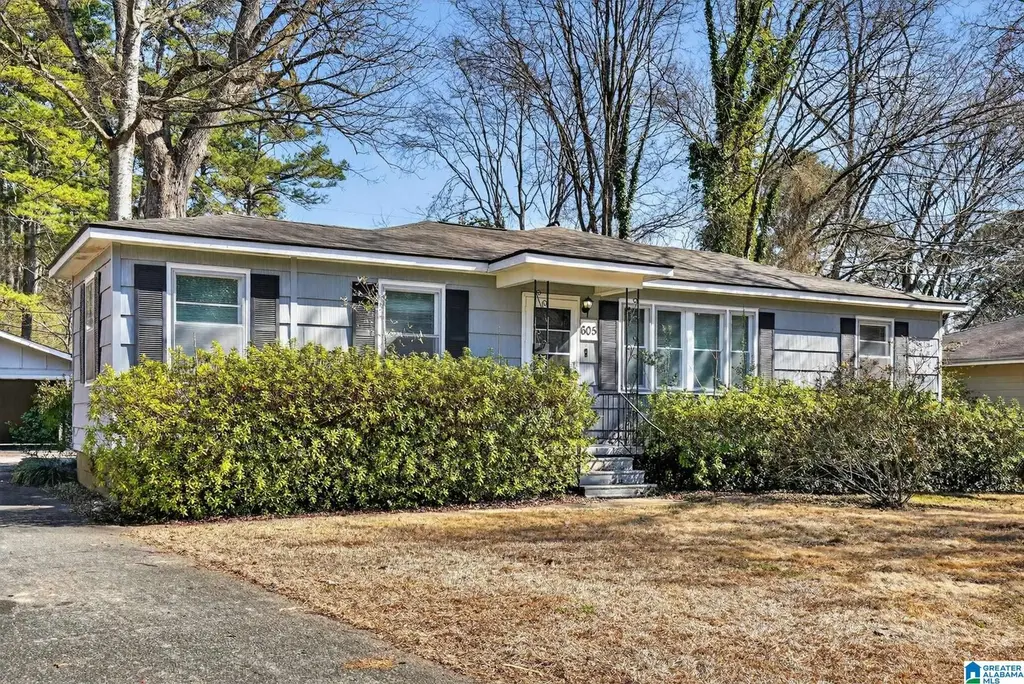
605 Lee Rd · Birmingham, AL
Flood risk 6/10 · Moderate
- FEMA flood zone
- X (unshaded)
- Chance of flooding over 30 yrs
- 0.7%
- Est. flood insurance / yr
- $507 – $1,088
Fire risk 3/10 · Minor
- Est. fire insurance / yr
- $916 – $1,700
Heat risk 6/10 · Moderate
- Hot days now (above 105°F)
- 7 days/yr
- Hot days in 30 yrs
- 19 days/yr
Wind risk 6/10 · Moderate
- Chance of severe wind over 30 yrs
- 27.0%
Air-quality risk 5/10 · Moderate
- Unhealthy air days now
- 7 days/yr
- Unhealthy air days in 30 yrs
- 9 days/yr
Risk factors via First Street. Map © Google.
Why this score? — see what drove the C grade
The composite is a weighted blend of 9 inputs, each scored 0–100. Each bar is that input's sub-score; the figure is the points it added to the 100-point composite (weight × sub-score).
- Cash flow +22.6/30.0
- ARV discount +10.6/15.0
- DSCR +7.2/10.0
- 1% rule +4.7/10.0
- Livability +3.4/5.0
- Rent growth +3.3/5.0
- Condition / age +2.5/5.0
- Schools +0.9/10.0
- Appreciation +0.0/10.0
$129,900
🖨 Deal sheet 📄 Offer letter ✓ Due diligence
Listing remarks MLS
Charming single-story, 3 bed, 2 bath home featuring a spacious front and backyard with mature trees and a covered entry. Inside, hardwood floors flow through the main living areas, complemented by abundant natural light from multiple windows. The living room offers a warm, inviting feel, while the adjacent dining area connects easily to the kitchen. The kitchen showcases wood cabinetry, solid surface countertops, tile backsplash, and black appliances. Additional highlights include generously sized bedrooms, ample closet space, and a bathroom with tiled shower surround and updated vanity. A cozy den with wood-paneled walls and exposed beams provides flexible living space ideal for a variety of needs.
Key facts
- Covered entry
- Wood cabinetry
- Hardwood floors
Tags
Neighborhood map
What this means for you Summary
Snapshot
- This is a 3-bed/2.0-bath single-family listed at $130k.
Deal economics
- At list price, monthly cash flow is $221 ($3k/yr) — positive.
- The deal already cash-flows at list — no discount required.
- To meet the 1% rule (rent ≥ 1% of price), the offer needs to be $126k (3.2% below list).
- Recommended offer: $122k (6.0% below list) — sets the bar for market timing.
- Cap rate 8.3% vs local median 6.2% in Birmingham — top-decile yield for the area; either an underpriced asset or a hidden risk that comps aren't pricing in. Stress-test before assuming the spread holds.
Location & tenants
- Location reads 67/100 on livability (#78 in AL) — a middle-class / working-renter tenant base. Strengths: commute A+, cost of living A+, housing A+; Watch: amenities C-, schools F, crime F.
- Birmingham City (urban): math 4% / reading 20% proficiency, ranked #116 of 129 in AL (top 90%) — low school quality limits family demand, transient renter base, plan for 1-2y turnover; 82% free/reduced lunch — lower-income household profile, screen leases tightly.
- Market conditions: Rents rising (+3.0%/yr); 334 active listings in the ZIP; 38 comparable units currently listed for rent nearby; rentals at typical pace (median 24d on market — plan ~3-4 weeks tenant-placement turnaround); 45% of comp listings sitting > 30 days — soft ceiling on asking rent; 2,114 units permitted in Jefferson County in 2024 (556 in 5+ unit buildings).
Forward outlook
- Local home prices are declining (-3.0%/yr); year-one equity from $898 of loan paydown is wiped out by about $4k of value loss. Plan a longer hold.
- Jefferson County population projected to shrink 4% by 2050 — rents likely to lag national; underwrite the cash flow, not the appreciation.
Negotiation context
- It's been on market 82 days — a 6% lower offer ($122k) is reasonable based on typical stale-listing flexibility.
Risks & watch-outs
- Watch-outs: built in 1954 — expect roof / HVAC / electrical / plumbing capex.
- Climate carrying-cost: major flood risk; major wind risk, 27% chance of damaging wind over 30y; extreme-heat days projected 7→19/yr by 2055 (HVAC capex compounding) — expect insurance premiums to compound above CPI over the hold.
Questions for the listing agent
- It's been on market 82 days. Have you received any prior offers? Is the seller open to a 6% concession, seller financing, or rate buy-down credit?
- Built in 1954 — when were the roof, HVAC, electrical panel, plumbing, and water heater last replaced?
- Why hasn't it sold? Are there any deal-killer items the seller is aware of (foundation, flood, title, zoning, code violations)?
- Is there a deadline driving the sale (1031 exchange, divorce, estate, relocation)? That informs how much negotiation room exists.
- Schools are F-rated, which usually means shorter tenancies and higher turnover. Who's the typical renter profile here, and what's been the actual vacancy rate?
- Crime grade is F in this area — have there been break-ins, vandalism, or insurance claims at this property in the last 3 years? What carrier currently insures it and at what premium?
- What's the average days-on-market for RENTAL listings here right now (not sales)? A rising rental-DOM trend means longer vacancies and softer asking-rent achievability than the comps imply.
- What's the recent tenant-quality profile in this submarket — average credit score on applications, eviction rate, late-payment / NSF rate, and stable-employment percentage? A property-management company in the area should have these aggregated.
- How much new for-sale + rental construction is in the pipeline within 1–3 miles? Heavy new supply typically softens prices + rents 12–24 months out; constrained supply supports both.
Investment metrics
- 1% rule
- 0.97% ✗
- Cap rate
- 8.34%
- Cash-on-cash
- 7.30%
- DSCR
- 1.32
- GRM
- 8.6
CMA / ARV
- ARV (median comp)
- $139,490
- List price
- $129,900
- Delta
- -6.88%
- Verdict
- FAIR
- Comps
- 20 within 1.0 mi
Show comp detail 12 sales within ~0.75 mi
| Address | Dist | Beds/Ba | Sqft | Sold | Price | $/sf | Match |
|---|---|---|---|---|---|---|---|
| 204 Boxwood Cir | 0.27mi | 3/1.0 | 1,252 (-3%) | 4mo | $70,000 | $56 | 75 |
| 321 Joan Ave | 0.57mi | 3/1.0 | 1,294 (+0%) | 2mo | $121,000 | $94 | 68 |
| 216 Westwood Dr | 0.39mi | 3/1.0 | 1,384 (+7%) | 0mo | $78,500 | $57 | 66 |
| 240 Mccormick Ave | 0.49mi | 3/1.0 | 1,262 (-2%) | 6mo | $141,000 | $112 | 64 |
| 328 Pat Ave | 0.57mi | 3/1.0 | 1,244 (-4%) | 1mo | $93,500 | $75 | 62 |
| 321 Glynn Dr | 0.53mi | 3/1.5 | 1,401 (+8%) | 1mo | $140,000 | $100 | 58 |
| 9809 Maple Ln | 0.56mi | 3/1.0 | 1,192 (-8%) | 3mo | $130,000 | $109 | 54 |
| 252 Westwood Dr | 0.48mi | 3/1.5 | 1,124 (-13%) | 6mo | $93,000 | $83 | 49 |
| 932 Charles Ct | 0.53mi | 4/2.0 (+1) | 1,430 (+11%) | 5mo | $140,000 | $98 | 49 |
| 808 Meadowbrook Dr | 0.60mi | 3/1.0 | 1,112 (-14%) | 1mo | $149,900 | $135 | 44 |
| 9828 Red Mill Rd | 0.51mi | 3/1.0 | 1,106 (-14%) | 7mo | $99,900 | $90 | 42 |
| 405 Sunbrook Ave | 0.74mi | 3/1.5 | 1,120 (-13%) | 2mo | $148,000 | $132 | 39 |
Match score weights: distance 35% · size 25% · config 20% · recency 20%. Top-matched comps best support the ARV.
Projected returns pro-forma
-3.0% appreciation · 3.04% rent growth · sell at horizon
- IRR
- -5.1%
- Equity multiple
- 0.81×
- Total profit
- $-6,973
- Equity at exit
- $19,369
- IRR
- 4.5%
- Equity multiple
- 1.33×
- Total profit
- $12,034
- Equity at exit
- $11,231
Cash invested: $36,372 (down + closing). Projections, not guarantees.
Landlord ↔ Tenant lean methodology
- Overall (STATE)
- 90 Strongly Landlord-Friendly
- State Alabama
- 90 Strongly Landlord-Friendly · R+15
- County
- — inherits STATE
- City
- — inherits STATE
ZIP-level market 35215
- Home prices YoY
- -34.4%
- Rents YoY
- 3.0%
- Active inventory
- 334
- Price-to-rent
- 8.6×
Monthly cashflow live
- Estimated rent
- $1,257 high interval (Pro) →
- Mortgage (P&I)
- −$681
- Tax from tax record
- −$36 /mo · $438/yr
- Insurance
- −$54
- HOA
- −$0
- Vacancy / Maint / Mgmt
- −$264
- Net cashflow
- $221
Break-even live
UW: 25.0% down · 7.5% · 30yr · 1.5% tax · 5.0% vac · 8.0% maint · 8.0% mgmt
Financing live
Cash to close
- Down payment
- $32,475
- Closing costs
- $3,897
- Reserves months
- —
- Total cash needed
- —
Loan-product check · same deal, 3 products live
Conventional
25% down · 7.5% · 30yr
- Down + closing
- —
- Monthly P&I
- —
- Monthly cashflow
- —
- DSCR
- —
- Eligible?
- —
Personal DTI + credit; lowest rate.
DSCR
20% down · 8.5% · 30yr
- Down + closing
- —
- Monthly P&I
- —
- Monthly cashflow
- —
- DSCR
- —
- Eligible?
- —
No personal income docs; deal must DSCR.
Hard money
10% down · 12.0% · 12mo
- Down + closing
- —
- Monthly P&I
- —
- Monthly cashflow
- —
- DSCR
- —
- Eligible?
- —
Short-term bridge; refi at stabilization.
Rent comps 38 comps
| Address | Beds | Baths | Sqft | Rent | $/sqft | DOM | Units | Dist |
|---|---|---|---|---|---|---|---|---|
| 201 Rose Dr Birmingham, AL | 3.0 | 1.0 | 972 | $1,100 | $1.13 | 16d | 1 | 0.17mi |
| 9844 Greenlee Rd Birmingham, AL | 3.0 | 1.0 | 1046 | $950 | $0.91 | 44d | 1 | 0.29mi |
| 216 Sanford Dr Birmingham, AL | 3.0 | 1.5 | 1134 | $1,200 | $1.06 | 44d | 1 | 0.32mi |
| 221 Lawson Rd Birmingham, AL | 3.0 | 1.5 | 1102 | $1,325 | $1.20 | 24d | 1 | 0.38mi |
| 529 Robison Dr Birmingham, AL | 2.0 | 1.0 | 960 | $960 | $1.00 | 21d | 1 | 0.39mi |
| 204 McCormick Ave Birmingham, AL | 3.0 | 1.0 | 880 | $980 | $1.11 | 3d | 1 | 0.43mi |
| 417 Price Dr Birmingham, AL | 4.0 | 2.0 | 1584 | $1,395 | $0.88 | 24d | 1 | 0.46mi |
| 921 Charles Ct Birmingham, AL | 4.0 | 2.0 | 1529 | $1,450 | $0.95 | 44d | 1 | 0.47mi |
| 252 Westwood Dr Birmingham, AL | 3.0 | 1.5 | 1124 | $1,400 | $1.25 | 2d | 1 | 0.48mi |
| 209 Tucker Ave Birmingham, AL | 3.0 | 1.0 | 1044 | $1,100 | $1.05 | 44d | 1 | 0.53mi |
| 252 Meadowdale Ave Birmingham, AL | 3.0 | 1.0 | 920 | $995 | $1.08 | 44d | 1 | 0.57mi |
| 316 Pine St Birmingham, AL | 3.0 | 1.0 | 1232 | $1,100 | $0.89 | 44d | 1 | 0.57mi |
| 945 Elizabeth Dr Birmingham, AL | 3.0 | 1.0 | 1227 | $1,125 | $0.92 | 3d | 1 | 0.59mi |
| 932 Five Mile Rd Birmingham, AL | 3.0 | 1.5 | 1200 | $1,175 | $0.98 | 19d | 1 | 0.60mi |
| 426 Buckingham Cir Birmingham, AL | 2.0 | 1.5 | 1080 | $1,013 | $0.94 | 44d | 1 | 0.61mi |
| 957 Hickory Cir Birmingham, AL | 3.0 | 2.0 | 1364 | $1,195 | $0.88 | 3d | 1 | 0.62mi |
| 832 Meadowbrook Dr Birmingham, AL | 3.0 | 2.0 | 1228 | $1,225 | $1.00 | 24d | 1 | 0.63mi |
| 818 Sunset Dr Birmingham, AL | 3.0 | 1.0 | 992 | $1,000 | $1.01 | 44d | 1 | 0.65mi |
| 603 Camp Ct Birmingham, AL | 3.0 | 1.0 | 936 | $1,300 | $1.39 | 44d | 1 | 0.66mi |
| 912 Meadowbrook Dr Birmingham, AL | 3.0 | 1.0 | 1178 | $1,100 | $0.93 | 44d | 1 | 0.67mi |
| 929 Meadowbrook Dr Birmingham, AL | 3.0 | 2.0 | 1649 | $1,200 | $0.73 | 12d | 1 | 0.74mi |
| 940 Meadowbrook Dr Birmingham, AL | 4.0 | 1.0 | 1149 | $1,300 | $1.13 | 44d | 1 | 0.74mi |
| 208 Sam Pate Dr Birmingham, AL | 3.0 | 2.0 | 988 | $1,385 | $1.40 | 2d | 1 | 0.75mi |
| 726 Orchard Rd Birmingham, AL | 3.0 | 1.0 | 1120 | $1,095 | $0.98 | 44d | 1 | 0.82mi |
| 9228 Brookhurst Dr Birmingham, AL | 3.0 | 1.0 | 1146 | $999 | $0.87 | 44d | 1 | 0.87mi |
| 848 Old Trail Rd Birmingham, AL | 2.0 | 1.5 | 930 | $925 | $0.99 | 24d | 1 | 0.92mi |
| 241 Mamie Ln Birmingham, AL | 3.0 | 2.0 | 1242 | $1,495 | $1.20 | 3d | 1 | 0.99mi |
| 736 Gene Reed Rd Birmingham, AL | 3.0 | 2.0 | 1353 | $1,220 | $0.90 | 44d | 1 | 1.05mi |
| 8917 Roebuck Blvd Apt 11 Birmingham, AL | 2.0 | 1.0 | 880 | $725 | $0.82 | 16d | 1 | 1.05mi |
| 520 Camellia Rd Birmingham, AL | 3.0 | 1.0 | 1053 | $1,100 | $1.04 | 3d | 1 | 1.11mi |
| 1112 Violet Dr Birmingham, AL | 3.0 | 2.0 | 1414 | $1,600 | $1.13 | 12d | 1 | 1.15mi |
| 217 Killough Dr Birmingham, AL | 3.0 | 2.0 | 1212 | $1,200 | $0.99 | 14d | 1 | 1.19mi |
| 600 Sundale Dr Birmingham, AL | 2.0 | 1.0 | 950 | $800 | $0.84 | 44d | 1 | 1.20mi |
| 1177 Five Mile Rd Birmingham, AL | 3.0 | 2.0 | 1636 | $1,100 | $0.67 | 44d | 1 | 1.24mi |
| 46 Sunscape Dr Birmingham, AL | 4.0 | 2.0 | 1178 | $1,450 | $1.23 | 44d | 1 | 1.28mi |
| 1128 Lay Dr Birmingham, AL | 3.0 | 1.5 | 1700 | $1,410 | $0.83 | 12d | 1 | 1.29mi |
| 40 Sunscape Dr Birmingham, AL | 3.0 | 2.0 | 1283 | $1,555 | $1.21 | 2d | 1 | 1.30mi |
| 433 Orchid Rd Birmingham, AL | 3.0 | 1.0 | 1162 | $1,255 | $1.08 | 16d | 1 | 1.34mi |
Listing history 2 events
-
2026-05-15price $129,900 708-char remark
Show marketing remark (708 chars)
Charming single-story, 3 bed, 2 bath home featuring a spacious front and backyard with mature trees and a covered entry. Inside, hardwood floors flow through the main living areas, complemented by abundant natural light from multiple windows. The living room offers a warm, inviting feel, while the adjacent dining area connects easily to the kitchen. The kitchen showcases wood cabinetry, solid surface countertops, tile backsplash, and black appliances. Additional highlights include generously sized bedrooms, ample closet space, and a bathroom with tiled shower surround and updated vanity. A cozy den with wood-paneled walls and exposed beams provides flexible living space ideal for a variety of needs.
-
2026-02-28$134,900 Active 708-char remark
Show marketing remark (708 chars)
Charming single-story, 3 bed, 2 bath home featuring a spacious front and backyard with mature trees and a covered entry. Inside, hardwood floors flow through the main living areas, complemented by abundant natural light from multiple windows. The living room offers a warm, inviting feel, while the adjacent dining area connects easily to the kitchen. The kitchen showcases wood cabinetry, solid surface countertops, tile backsplash, and black appliances. Additional highlights include generously sized bedrooms, ample closet space, and a bathroom with tiled shower surround and updated vanity. A cozy den with wood-paneled walls and exposed beams provides flexible living space ideal for a variety of needs.
ⓘ Source: listings_history table (triggers on properties + properties_extension) + one-shot
backfill from property_details.listing_events for pre-trigger history.
Tax reassessment forecast AL · Resets to sale price
- Current annual tax
- $438 · $36/mo
- Projected year-2 tax
- $533 · $44/mo
- Expected delta
- +$95/yr (+$8/mo · 21.6%)
ⓘ Screening estimate from a state-policy table — verify with the county assessor before closing.
Climate risk First Street
- Flood 6/10 Major FEMA zone X (unshaded) · 70% chance over 30 yrs
- Wildfire 3/10 Moderate
- Heat 6/10 Major 7 d/yr ≥105°F today · 19 d/yr by 30 yrs out
- Wind 6/10 Major 27% chance of damaging wind over 30 yrs
- Air quality 5/10 Major 7 unhealthy d/yr today · 9 by 30 yrs out
Nearby sold comps map
Loading sold comps map…
Walkable amenities ~0.75 mi
Loading nearby amenities…
Taxation est. · year 1
- Rental income
- $15,083
- − Mortgage interest
- −$7,276
- − Property taxes
- −$438
- − Insurance
- −$650
- − Repairs & maintenance
- −$1,207
- − Management
- −$1,207
- − Depreciation
- −$3,779
- Taxable income
- $527
- Est. tax owed @ 24.0%
- −$126
- After-tax cash flow
- $2,527/yr
For passive investors: Depreciation is non-cash, so a rental often shows a tax loss while cash-flowing — sheltering income. Rental losses are passive: they offset passive income freely, and up to $25,000/yr can offset ordinary (W-2) income if you actively participate and your MAGI is under $100k (phasing out to $0 by $150k); unused losses carry forward. On sale, claimed depreciation is recaptured at up to 25%, and gains may owe capital-gains tax (a 1031 exchange can defer both). Figures are a year-1 estimate at your 24.0% rate — not tax advice; consult a CPA.
Schools (NCES district)
- District
- Birmingham City
- NCES district ID
- 0100390
- Math proficiency
- 4% ▼ -17.00%
- Reading proficiency
- 20% ▼ -4.00%
- Median HH income
- $31,988
- Composite
- 9.49/100
- National rank
- #9850
- State rank
- #116 of 129 in AL
Livability — Birmingham
- Score
- 67/100
- State rank
- #78
- US rank
- #10412
Category grades
Schools grade is shown separately in the Schools card above.
Census & demographics
- Census place
- Birmingham, AL
- County
- Jefferson County · 527,445 people
- City population
- 210,422
- Metro
- Birmingham-Hoover, AL
- Population (ZIP)
- 43,903
- Household income
- $52,793
- Rent vs Own
- Severe rent burden
- 1729.0
Population outlook (Jefferson County) Hauer SSP2
- Today (2025)
- 669,185 people
- By 2030
- 669,694 · +0.1%
- By 2040
- 661,388 · -1.2%
- By 2050
- 643,086 · -3.9%
- By 2075
- 577,267 · -13.7%
- By 2100
- 474,758 · -29.1%
Race, ethnicity, and origin ACS 2023
- Neighborhood character
- Predominantly Black (75%)
- Race & ethnicity
- Black 75% White 15% Hispanic / Latino 7% Two or more races 3%
- Hispanic origin (detail)
- Mexican 4%
- Common ancestry
- Lithuanian 1% Italian 1% Slovak 1%
- Foreign-born
- 4% · Canada
- Languages at home
- 92% English-only · Spanish 7%
Political lean MEDSL · Jefferson
- 2024 margin
- D (+10.4) · D 54.6% · R 44.2% · Other 1.2%
- 2008→2024 swing
- +5.4pp toward D · 2008: 5.1pp · 2024: 10.4pp
- All cycles
- 2024: D+10.4 2020: D+13.2 2016: D+7.2 2012: D+6.0 2008: D+5.1
Not yet ingested
- Civics
- —
Market trends
- HPI YoY
- ▼ -112.97%
- Current HPI
- 215.0607
- Rent YoY
- ▲ 3.04%
- Metro
- Birmingham-Hoover, AL
- State GDP YoY
- ▲ 2.94%
- F500 in state
- 4
Industry mix (Fortune 500 HQ in AL)
| Industry | F500 HQs | Revenue |
|---|---|---|
| Financial Services | 1 | $8B |
|
||
| Healthcare | 1 | $5B |
|
||
Price history
-3.7% since first listed2 events — show timeline
- 2026-05-15 Price Changed $129,900 Greater Alabama MLS
- 2026-02-28 Listed $134,900 Greater Alabama MLS
Property tax history
+3.5%/yrLatest (2016): $438 · -0.2% YoY. Source: county tax records.
Cash-flow waterfall
monthlySold comps — $/sqft
last 12 mo · ≤1 miLoading sold comps…