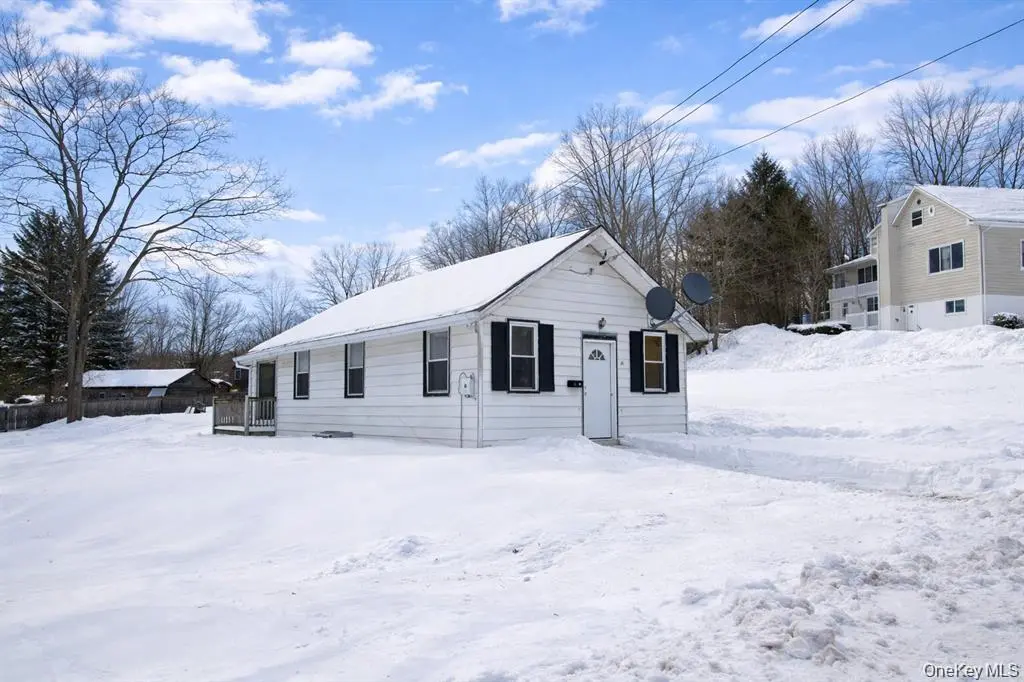
24 Albion St · Liberty, NY
Flood risk 1/10 · Minimal
- FEMA flood zone
- X (unshaded)
- Chance of flooding over 30 yrs
- 0.0%
- Est. flood insurance / yr
- $473 – $860
Fire risk 2/10 · Minimal
- Est. fire insurance / yr
- $691 – $1,283
Heat risk 2/10 · Minimal
- Hot days now (above 90°F)
- 7 days/yr
- Hot days in 30 yrs
- 16 days/yr
Wind risk 2/10 · Minimal
- Chance of severe wind over 30 yrs
- 3.0%
Air-quality risk 2/10 · Minimal
- Unhealthy air days now
- 0 days/yr
- Unhealthy air days in 30 yrs
- 1 days/yr
Risk factors via First Street. Map © Google.
Why this score? — see what drove the C- grade
The composite is a weighted blend of 9 inputs, each scored 0–100. Each bar is that input's sub-score; the figure is the points it added to the 100-point composite (weight × sub-score).
- Cash flow +15.4/30.0
- Appreciation +10.0/10.0
- ARV discount +7.5/15.0
- DSCR +4.7/10.0
- 1% rule +4.6/10.0
- Livability +3.1/5.0
- Schools +2.8/10.0
- Rent growth +2.5/5.0
- Condition / age +2.5/5.0
$165,000
🖨 Deal sheet (PDF) 📄 Offer letter ✓ Due diligence
Listing remarks
Located in Liberty within Sullivan County and served by the Liberty School District, this 2-bedroom, 1-bath Colonial offers 1,092 square feet of comfortable living space on a 14,810 sq ft lot. Priced at $165,000, this property is a strong option for buyers searching for an affordable home with city water and city sewer, public road access, and a manageable yard size. Built in 1960, the home features frame construction with vinyl siding, offering a low-maintenance exterior and classic curb appeal. The first floor includes a living room, kitchen, and hall bath, creating a practical layout that feels open yet defined. If you are looking for a home with laminate flooring and a traditional Colon
Key facts
- Practical layout
- Public road access
- City water
Tags
Property features AI
Exterior
- Parking: Driveway; No carport
- Utilities: Public sewer; Cable available and connected; Electricity available and connected
- Home design: Single-family residence
- Construction: Other construction materials; Other foundation type
- Exterior features: Not waterfront; Driveway
Interior
- Kitchen: No appliances listed
- Bedrooms: Bedroom on the first floor
- Bathrooms: One full bathroom
- Heating & cooling: Baseboard heat; No central cooling
- Interior features: First-floor bedroom; First-floor full bathroom; Unfinished basement; Scuttle attic; Total of 5 rooms
- Laundry & utility: No laundry appliances listed
Neighborhood map
What this means for you Summary
Snapshot
- This is a 2-bed/1.0-bath single-family listed at $165k.
Deal economics
- At list price, monthly cash flow is $63 ($752/yr) — positive.
- The deal already cash-flows at list — no discount required.
- To meet the 1% rule (rent ≥ 1% of price), the offer needs to be $159k (3.7% below list).
- Recommended offer: $159k (3.7% below list) — sets the bar for 1% rule.
- Cap rate 6.7% vs local median 3.8% in Liberty — top-decile yield for the area; either an underpriced asset or a hidden risk that comps aren't pricing in. Stress-test before assuming the spread holds.
Location & tenants
- Location reads 62/100 on livability (#890 in NY) — a middle-class / working-renter tenant base. Strengths: cost of living A+, health & safety A+, housing B+; Watch: crime D+, amenities F, commute F.
- Liberty Central School District (town): math 31% / reading 34% proficiency, ranked #569 of 590 in NY (top 96%) — families likely to look elsewhere, expect single-tenant / working-renter base with shorter leases.
- Zoned schools: Liberty Elementary School (math 27% / reading 42%, grade F, #1,577 of 2,108 statewide, top 77%, 691 students, 64% FRL); Liberty Middle School (math 12% / reading 29%, grade F, #664 of 729 statewide, top 91%, 529 students, 68% FRL); Liberty High School (math 92% / reading 70%, grade A, #495 of 1,100 statewide, top 46%, 596 students, 62% FRL) — zoned schools average 65% FRL vs 48% district-wide (16 pts higher); higher-poverty schools than district average — tighter screening recommended.
- Zoned-school proficiency averages 45% at this address vs 32% district-wide (+13 pts) — the actual schools serving this property are materially stronger than the Liberty Central School District average implies; a family-tenant draw the district grade alone would hide.
- Market conditions: 65 active listings in the ZIP; 4 comparable units currently listed for rent nearby; rentals at typical pace (median 25d on market — plan ~3-4 weeks tenant-placement turnaround); 739 units permitted in Sullivan County in 2024 (5 in 5+ unit buildings).
Forward outlook
- In year one you build about $18k of equity ($1k loan paydown + $16k appreciation (10.0% local appreciation)).
- Sullivan County population projected at -24% by 2050 — secular population decline; favor cash flow + early exit over multi-decade hold.
- At projected returns (10.0% appreciation + 3.0% rent growth), your $46k cash investment doubles in ~3 years — after that, you're playing with house money.
- By year 3, paydown + projected appreciation supports a ~$45k cash-out refi (75% LTV) — recoverable capital for the next deal without selling this one.
Negotiation context
- It's been on market 20 days — a 2% lower offer ($163k) is reasonable based on typical stale-listing flexibility.
- 3 sale attempts since 20y ago with the ask held roughly flat each time — persistent listings suggest the price (not the market) is what's stuck; bring a comps-based counter.
- Current owner paid $35k; list at $165k implies a 371% gain — meaningful room to come down on a strong offer.
Questions for the listing agent
- Built in 1960 — when were the roof, HVAC, electrical panel, plumbing, and water heater last replaced?
- Is there a deadline driving the sale (1031 exchange, divorce, estate, relocation)? That informs how much negotiation room exists.
- Crime grade is D in this area — have there been break-ins, vandalism, or insurance claims at this property in the last 3 years? What carrier currently insures it and at what premium?
- What's the average days-on-market for RENTAL listings here right now (not sales)? A rising rental-DOM trend means longer vacancies and softer asking-rent achievability than the comps imply.
- What's the recent tenant-quality profile in this submarket — average credit score on applications, eviction rate, late-payment / NSF rate, and stable-employment percentage? A property-management company in the area should have these aggregated.
- How much new for-sale + rental construction is in the pipeline within 1–3 miles? Heavy new supply typically softens prices + rents 12–24 months out; constrained supply supports both.
Investment metrics
- 1% rule
- 0.96% ✗
- Cap rate
- 6.75%
- Cash-on-cash
- 1.63%
- DSCR
- 1.07
- GRM
- 8.7
CMA / ARV
No comps found within radius.
Projected returns pro-forma
10.0% appreciation · 3.0% rent growth · sell at horizon
- IRR
- 25.5%
- Equity multiple
- 3.03×
- Total profit
- $93,910
- Equity at exit
- $148,645
- IRR
- 22.4%
- Equity multiple
- 6.92×
- Total profit
- $273,524
- Equity at exit
- $320,559
Cash invested: $46,200 (down + closing). Projections, not guarantees.
Landlord ↔ Tenant lean methodology
- Overall (STATE)
- 15 Strongly Tenant-Friendly
- State New York
- 15 Strongly Tenant-Friendly · D+10
- County
- — inherits STATE
- City
- — inherits STATE
ZIP-level market 12754
- Home prices YoY
- 28.0%
- Active inventory
- 65
- Price-to-rent
- 8.7×
Monthly cashflow live
- Estimated rent
- $1,589 medium interval (Pro) →
- Mortgage (P&I)
- −$865
- Tax from tax record
- −$259 /mo · $3,107/yr
- Insurance
- −$69
- HOA
- −$0
- Vacancy / Maint / Mgmt
- −$334
- Net cashflow
- $63
Break-even live
Sensitivity live
| Price | -10% $156 | -5% $109 | +0% $63 | +5% $16 | +10% $-31 |
|---|---|---|---|---|---|
| Rent | -10% $-63 | -5% $0 | +0% $63 | +5% $125 | +10% $188 |
| Rate | -1.0pp $146 | -0.5pp $105 | base $63 | +0.5pp $20 | +1.0pp $-24 |
UW: 25.0% down · 7.5% · 30yr · 1.5% tax · 5.0% vac · 8.0% maint · 8.0% mgmt
Financing live
Cash to close
- Down payment
- $41,250
- Closing costs
- $4,950
- Reserves months
- —
- Total cash needed
- —
Loan-product check · same deal, 3 products live
Conventional
25% down · 7.5% · 30yr
- Down + closing
- —
- Monthly P&I
- —
- Monthly cashflow
- —
- DSCR
- —
- Eligible?
- —
Personal DTI + credit; lowest rate.
DSCR
20% down · 8.5% · 30yr
- Down + closing
- —
- Monthly P&I
- —
- Monthly cashflow
- —
- DSCR
- —
- Eligible?
- —
No personal income docs; deal must DSCR.
Hard money
10% down · 12.0% · 12mo
- Down + closing
- —
- Monthly P&I
- —
- Monthly cashflow
- —
- DSCR
- —
- Eligible?
- —
Short-term bridge; refi at stabilization.
Rent comps 4 comps
| Address | Beds | Baths | Sqft | Rent | $/sqft | DOM | Units | Dist |
|---|---|---|---|---|---|---|---|---|
| 284 S Main St Apt 2 Liberty, NY | 3.0 | 1.0 | 750 | $1,600 | $2.13 | 24d | 1 | 0.53mi |
| 221 Chestnut St Unit 3 Liberty, NY | 2.0 | 1.0 | 750 | $1,750 | $2.33 | 24d | 1 | 0.69mi |
| 221 Chestnut St Unit 1 Liberty, NY | 2.0 | 1.0 | 600 | $1,450 | $2.42 | 24d | 1 | 0.69mi |
| 56 Golden Park Ln Liberty, NY | 1.0 | 1.0 | 600 | $669 | $1.11 | 15d | 1 | 1.50mi |
Listing history 16 events
-
2026-06-18days on market $165,000 Active 20 DOM
-
2026-06-17days on market $165,000 Active 19 DOM
-
2026-06-16days on market $165,000 Active 18 DOM
-
2026-06-15days on market $165,000 Active 17 DOM
-
2026-06-14days on market $165,000 Active 15 DOM
-
2026-06-13days on market $165,000 Active 14 DOM
-
2026-06-10days on market $165,000 Active 12 DOM
-
2026-06-09days on market $165,000 Active 11 DOM
-
2026-06-08days on market $165,000 Active 10 DOM
-
2026-06-07days on market $165,000 Active 9 DOM
-
2026-06-03days on market $165,000 Active 5 DOM
-
2026-06-02days on market $165,000 Active 4 DOM
-
2026-06-01days on market $165,000 Active 3 DOM
-
2026-05-31days on market $165,000 Active 2 DOM
-
2026-05-31remarks 699-char remark
-
2026-05-31$165,000 Active 1 DOM
ⓘ Source: listings_history table (triggers on properties + properties_extension) + one-shot
backfill from property_details.listing_events for pre-trigger history.
Tax reassessment forecast NY · Partial reset (capped growth)
- Current annual tax
- $3,107 · $259/mo
- Projected year-2 tax
- $3,107 · $259/mo
- Expected delta
- $0/yr ($0/mo · 0.0%)
ⓘ Screening estimate from a state-policy table — verify with the county assessor before closing.
Climate risk First Street
- Flood 1/10 Low FEMA zone X (unshaded) · 0% chance over 30 yrs
- Wildfire 2/10 Low
- Heat 2/10 Low 7 d/yr ≥90°F today · 16 d/yr by 30 yrs out
- Wind 2/10 Low 3% chance of damaging wind over 30 yrs
- Air quality 2/10 Low 0 unhealthy d/yr today · 1 by 30 yrs out
Nearby sold comps map
Loading sold comps map…
Walkable amenities ~0.75 mi
Loading nearby amenities…
Taxation est. · year 1
- Rental income
- $19,073
- − Mortgage interest
- −$9,243
- − Property taxes
- −$3,107
- − Insurance
- −$825
- − Repairs & maintenance
- −$1,526
- − Management
- −$1,526
- − Depreciation
- −$4,800
- Taxable loss
- −$1,954
- Est. tax savings @ 24.0%
- +$469
- After-tax cash flow
- $1,221/yr
For passive investors: Depreciation is non-cash, so a rental often shows a tax loss while cash-flowing — sheltering income. Rental losses are passive: they offset passive income freely, and up to $25,000/yr can offset ordinary (W-2) income if you actively participate and your MAGI is under $100k (phasing out to $0 by $150k); unused losses carry forward. On sale, claimed depreciation is recaptured at up to 25%, and gains may owe capital-gains tax (a 1031 exchange can defer both). Figures are a year-1 estimate at your 24.0% rate — not tax advice; consult a CPA.
Schools (NCES district)
- District
- Liberty Central School District
- NCES district ID
- 3617220
- Math proficiency
- 31% ▼ -8.00%
- Reading proficiency
- 34% ▼ -4.00%
- Median HH income
- $43,542
- Composite
- 27.65/100
- National rank
- #6920
- State rank
- #569 of 590 in NY
Livability — Liberty
- Score
- 62/100
- State rank
- #890
- US rank
- #17254
Category grades
Schools grade is shown separately in the Schools card above.
Census & demographics
- Census place
- Liberty, NY
- City population
- 8,525
- Population (ZIP)
- 8,525
Population outlook (Sullivan County) Hauer SSP2
- Today (2025)
- 68,974 people
- By 2030
- 65,609 · -4.9%
- By 2040
- 58,878 · -14.6%
- By 2050
- 52,500 · -23.9%
- By 2075
- 39,941 · -42.1%
- By 2100
- 28,880 · -58.1%
Race, ethnicity, and origin ACS 2023
- Neighborhood character
- Diverse neighborhood (Simpson 0.56)
- Race & ethnicity
- White 56% Hispanic / Latino 36% Two or more races 8% Black 4% Asian 2% Native American 1%
- Hispanic origin (detail)
- Mexican 3% Puerto Rican 7% Dominican 2%
- Common ancestry
- Romanian 3% Lithuanian 2% Scotch-Irish 1%
- Foreign-born
- 22% · Canada, Dominican Republic, Jamaica
- Languages at home
- 71% English-only · Spanish 25% Other Indo-European 2% French/Haitian/Cajun 1%
Political lean MEDSL · Sullivan
- 2024 margin
- R (+16.7) · D 41.6% · R 58.4%
- 2008→2024 swing
- -26.2pp toward R · 2008: 9.5pp · 2024: -16.7pp
- All cycles
- 2024: R+16.7 2020: R+9.2 2016: R+13.7 2012: D+10.4 2008: D+9.5
Not yet ingested
- Civics
- —
Market trends
- HPI YoY
- ▲ 100.10%
- Current HPI
- 457.3342
- Rent YoY
- —
- Metro
- —
- State GDP YoY
- ▲ 2.60%
- F500 in state
- 92
Industry mix (Fortune 500 HQ in NY)
| Industry | F500 HQs | Revenue |
|---|---|---|
| Financial Services | 10 | $950B |
|
||
| Consumer Goods | 9 | $162B |
|
||
| Insurance | 4 | $225B |
|
||
| Telecommunications | 2 | $144B |
|
||
| Pharmaceuticals | 2 | $112B |
|
||
| Media / Entertainment | 2 | $69B |
|
||
Price history
+288.2% since first listed9 events — show timeline
- 2026-05-29 Listed $165,000 OneKey® MLS as Distributed by MLS Grid
- 2026-05-20 Listing Removed — OneKey® MLS as Distributed by MLS Grid
- 2026-02-19 Listed $165,000 OneKey® MLS as Distributed by MLS Grid
- 2026-02-13 Coming Soon — OneKey® MLS as Distributed by MLS Grid
- 2007-01-23 Sold (MLS) $35,000 HGMLS
- 2006-12-23 Delisted — HGMLS
- 2006-12-08 Listed $30,000 HGMLS
- 1996-03-18 Sold (Public Records) $35,000 Public Records
- 1987-07-07 Sold (Public Records) $42,500 Public Records
Property tax history
-0.9%/yrLatest (2025): $3,107 · +8.4% YoY. Source: county tax records.
Cash-flow waterfall
monthlySold comps — $/sqft
last 12 mo · ≤1 miLoading sold comps…