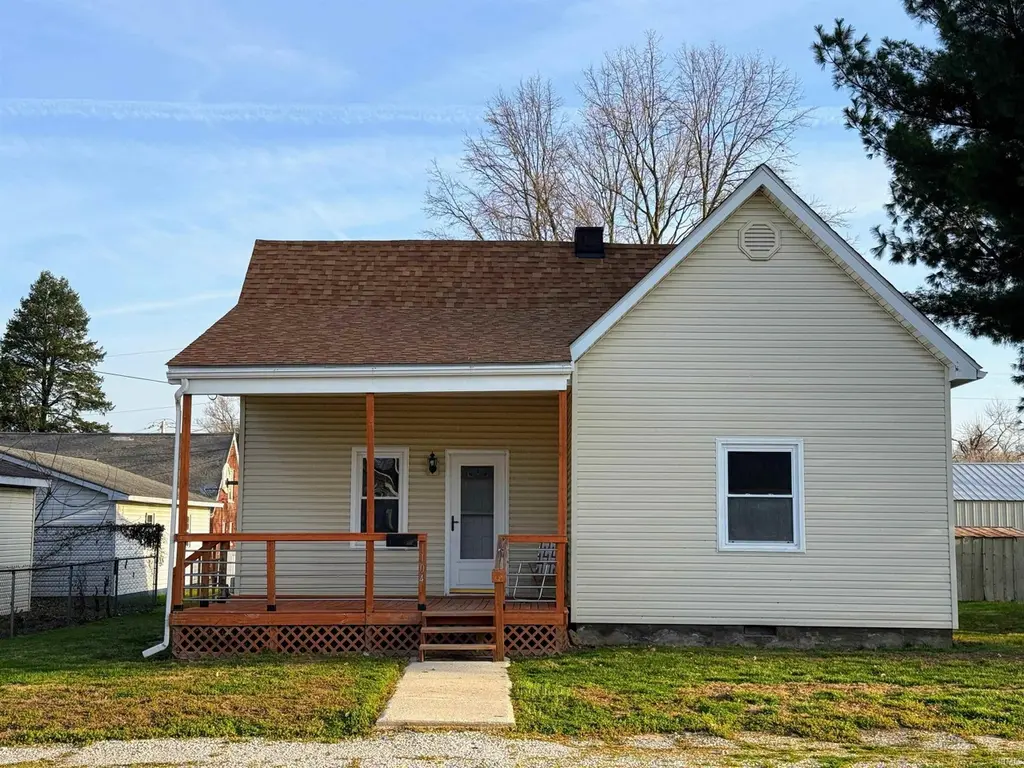
1104 Axtel Ave · Washington, IN
Flood risk 1/10 · Minimal
- FEMA flood zone
- —
- Chance of flooding over 30 yrs
- 0.0%
- Est. flood insurance / yr
- —
Fire risk 1/10 · Minimal
- Est. fire insurance / yr
- $717 – $1,331
Heat risk 5/10 · Moderate
- Hot days now (above 106°F)
- 7 days/yr
- Hot days in 30 yrs
- 19 days/yr
Wind risk 2/10 · Minimal
- Chance of severe wind over 30 yrs
- 2.0%
Air-quality risk 4/10 · Minor
- Unhealthy air days now
- 3 days/yr
- Unhealthy air days in 30 yrs
- 5 days/yr
Risk factors via First Street. Map © Google.
Why this score? — see what drove the D grade
The composite is a weighted blend of 9 inputs, each scored 0–100. Each bar is that input's sub-score; the figure is the points it added to the 100-point composite (weight × sub-score).
- Cash flow +16.9/30.0
- DSCR +5.3/10.0
- Livability +3.6/5.0
- 1% rule +3.3/10.0
- Schools +3.2/10.0
- ARV discount +2.9/15.0
- Rent growth +2.5/5.0
- Condition / age +2.5/5.0
- Appreciation +0.0/10.0
$177,000
🖨 Deal sheet (PDF) 📄 Offer letter ✓ Due diligence
Listing remarks MLS
Step into this beautifully updated 3-bedroom, 2-bath home where modern upgrades meet timeless charm! From the moment you walk in, you’ll love the blend of brand-new laminate flooring, plush new carpet, and original hardwood floors that bring warmth and character throughout. The fully remodeled kitchen features all-new cabinets, countertops, and appliances—perfect for cooking and entertaining. Both bathrooms have been completely updated with fresh, modern finishes. Enjoy peace of mind with new plumbing and water lines, updated wiring, new interior doors, trim, LED lighting, and ceiling fans throughout—every detail has been thoughtfully upgraded! Step outside to relax or entertain on the spacious rear wood deck, overlooking the backyard complete with a 10x12 shed for extra storage. Nestled in a quiet, peaceful neighborhood, this home truly has it all—style, comfort, and convenience.
Key facts
- New plumbing
- Updated wiring
- Remodeled kitchen
Tags
Neighborhood map
What this means for you Summary
Snapshot
- This is a 3-bed/1.0-bath single-family listed at $177k.
Deal economics
- At list price, monthly cash flow is $118 ($1k/yr) — positive.
- The deal already cash-flows at list — no discount required.
- To meet the 1% rule (rent ≥ 1% of price), the offer needs to be $147k (16.9% below list).
- Recommended offer: $147k (16.9% below list) — sets the bar for 1% rule.
- Cap rate 7.1% vs local median 4.9% in Washington — top-decile yield for the area; either an underpriced asset or a hidden risk that comps aren't pricing in. Stress-test before assuming the spread holds.
Location & tenants
- Location reads 72/100 on livability (#110 in IN) — a middle-class / working-renter tenant base. Strengths: cost of living A+, housing A+, health & safety A+; Watch: amenities F, commute F, employment F.
- Washington Community Schools (town): math 36% / reading 38% proficiency, ranked #174 of 301 in IN (top 58%) — families likely to look elsewhere, expect single-tenant / working-renter base with shorter leases.
- Market conditions: 115 active listings in the ZIP; 3 comparable units currently listed for rent nearby; rentals lingering (median 45d on market — plan ~5-8 weeks vacancy on turnover, expect pricing pressure); 100% of comp listings sitting > 30 days — soft ceiling on asking rent; 71 units permitted in Daviess County in 2024 (0 in 5+ unit buildings).
Forward outlook
- Local home prices are declining (-3.0%/yr); year-one equity from $1k of loan paydown is wiped out by about $5k of value loss. Plan a longer hold.
- Daviess County population projected at +6% by 2050 — modest demand growth; plan on rents tracking national, not racing it.
Negotiation context
- It's been on market 85 days — a 6% lower offer ($166k) is reasonable based on typical stale-listing flexibility.
- Current owner paid $60k; list at $177k implies a 195% gain — meaningful room to come down on a strong offer.
Risks & watch-outs
- Watch-outs: built in 1900 — expect roof / HVAC / electrical / plumbing capex.
- Climate carrying-cost: extreme-heat days projected 7→19/yr by 2055 (HVAC capex compounding) — expect insurance premiums to compound above CPI over the hold.
Questions for the listing agent
- It's been on market 85 days. Have you received any prior offers? Is the seller open to a 17% concession, seller financing, or rate buy-down credit?
- Built in 1900 — when were the roof, HVAC, electrical panel, plumbing, and water heater last replaced?
- Why hasn't it sold? Are there any deal-killer items the seller is aware of (foundation, flood, title, zoning, code violations)?
- Is there a deadline driving the sale (1031 exchange, divorce, estate, relocation)? That informs how much negotiation room exists.
- The area grade is low — what's the realistic commute time and amenity access for the typical tenant pool here? Any planned neighborhood developments (good or bad) we should know about?
- What's the average days-on-market for RENTAL listings here right now (not sales)? A rising rental-DOM trend means longer vacancies and softer asking-rent achievability than the comps imply.
- What's the recent tenant-quality profile in this submarket — average credit score on applications, eviction rate, late-payment / NSF rate, and stable-employment percentage? A property-management company in the area should have these aggregated.
- How much new for-sale + rental construction is in the pipeline within 1–3 miles? Heavy new supply typically softens prices + rents 12–24 months out; constrained supply supports both.
Investment metrics
- 1% rule
- 0.83% ✗
- Cap rate
- 7.09%
- Cash-on-cash
- 2.85%
- DSCR
- 1.13
- GRM
- 10.0
CMA / ARV
- ARV (median comp)
- $160,533
- List price
- $177,000
- Delta
- 10.26%
- Verdict
- OVERPRICED
- Comps
- 20 within 1.0 mi
Show comp detail 12 sales within ~0.75 mi
| Address | Dist | Beds/Ba | Sqft | Sold | Price | $/sf | Match |
|---|---|---|---|---|---|---|---|
| 1109 Washington Ave | 0.07mi | 3/2.0 | 1,328 (+5%) | 3mo | $196,000 | $148 | 81 |
| 114 SE 11th St | 0.02mi | 3/2.0 | 1,306 (+4%) | 13mo | $125,000 | $96 | 78 |
| 6 SE 7th St | 0.26mi | 2/1.0 (-1) | 1,339 (+6%) | 6mo | $72,500 | $54 | 68 |
| 415 E William St | 0.54mi | 2/1.0 (-1) | 1,211 (-4%) | 2mo | $138,000 | $114 | 61 |
| 107 NE 2nd St | 0.60mi | 2/1.0 (-1) | 1,228 (-3%) | 2mo | $95,000 | $77 | 60 |
| 500 E Maple St | 0.62mi | 3/1.5 | 1,208 (-4%) | 4mo | $110,000 | $91 | 59 |
| 106 NE 10th St | 0.18mi | 2/1.0 (-1) | 1,088 (-14%) | 6mo | $55,000 | $51 | 59 |
| 1310 E Van Trees St | 0.20mi | 2/2.0 (-1) | 1,134 (-10%) | 9mo | $140,000 | $123 | 57 |
| 310 N Meridian St | 0.74mi | 3/1.5 | 1,229 (-3%) | 5mo | $82,000 | $67 | 55 |
| 601 SE 3rd St | 0.60mi | 3/2.0 | 1,344 (+6%) | 6mo | $222,500 | $166 | 52 |
| 404 NE 19th St | 0.64mi | 3/1.0 | 1,107 (-12%) | 4mo | $148,650 | $134 | 46 |
| 2007 Grand Ave | 0.66mi | 2/1.0 (-1) | 1,100 (-13%) | 11mo | $65,000 | $59 | 34 |
Match score weights: distance 35% · size 25% · config 20% · recency 20%. Top-matched comps best support the ARV.
Projected returns pro-forma
-3.0% appreciation · 3.0% rent growth · sell at horizon
- IRR
- -11.9%
- Equity multiple
- 0.57×
- Total profit
- $-21,264
- Equity at exit
- $26,391
- IRR
- -2.8%
- Equity multiple
- 0.81×
- Total profit
- $-9,209
- Equity at exit
- $15,304
Cash invested: $49,560 (down + closing). Projections, not guarantees.
Landlord ↔ Tenant lean methodology
- Overall (STATE)
- 90 Strongly Landlord-Friendly
- State Indiana
- 90 Strongly Landlord-Friendly · R+11
- County
- — inherits STATE
- City
- — inherits STATE
ZIP-level market 47501
- Home prices YoY
- -23.2%
- Active inventory
- 115
- Price-to-rent
- 10.0×
Monthly cashflow live
- Estimated rent
- $1,470 medium interval (Pro) →
- Mortgage (P&I)
- −$928
- Tax from tax record
- −$42 /mo · $500/yr
- Insurance
- −$74
- HOA
- −$0
- Vacancy / Maint / Mgmt
- −$309
- Net cashflow
- $118
Break-even live
Sensitivity live
| Price | -10% $218 | -5% $168 | +0% $118 | +5% $68 | +10% $18 |
|---|---|---|---|---|---|
| Rent | -10% $2 | -5% $60 | +0% $118 | +5% $176 | +10% $234 |
| Rate | -1.0pp $207 | -0.5pp $163 | base $118 | +0.5pp $72 | +1.0pp $25 |
UW: 25.0% down · 7.5% · 30yr · 1.5% tax · 5.0% vac · 8.0% maint · 8.0% mgmt
Financing live
Cash to close
- Down payment
- $44,250
- Closing costs
- $5,310
- Reserves months
- —
- Total cash needed
- —
Loan-product check · same deal, 3 products live
Conventional
25% down · 7.5% · 30yr
- Down + closing
- —
- Monthly P&I
- —
- Monthly cashflow
- —
- DSCR
- —
- Eligible?
- —
Personal DTI + credit; lowest rate.
DSCR
20% down · 8.5% · 30yr
- Down + closing
- —
- Monthly P&I
- —
- Monthly cashflow
- —
- DSCR
- —
- Eligible?
- —
No personal income docs; deal must DSCR.
Hard money
10% down · 12.0% · 12mo
- Down + closing
- —
- Monthly P&I
- —
- Monthly cashflow
- —
- DSCR
- —
- Eligible?
- —
Short-term bridge; refi at stabilization.
Rent comps 3 comps
| Address | Beds | Baths | Sqft | Rent | $/sqft | DOM | Units | Dist |
|---|---|---|---|---|---|---|---|---|
| 2005 E National Hwy Washington, IN | 1.0–2.0 | 1.0–1.5 | 960 | $1,250 | $1.30 | 44d | 1 | 0.66mi |
| 499 S 100 E Apt 12 Washington, IN | 3.0 | 2.5 | 1500 | $1,500 | $1.00 | 44d | 1 | 0.94mi |
| 8 Longbranch Dr Unit NA Washington, IN | 3.0 | 2.0 | 1340 | $1,700 | $1.27 | 45d | 1 | 0.95mi |
Listing history 20 events
-
2026-06-21days on market $177,000 Active 85 DOM
-
2026-06-18days on market $177,000 Active 83 DOM
-
2026-06-17days on market $177,000 Active 82 DOM
-
2026-06-17price $177,000 Active 81 DOM
-
2026-06-16days on market $182,000 Active 81 DOM
-
2026-06-15days on market $182,000 Active 80 DOM
-
2026-06-13days on market $182,000 Active 78 DOM
-
2026-06-12days on market $182,000 Active 77 DOM
-
2026-06-09days on market $182,000 Active 74 DOM
-
2026-06-08days on market $182,000 Active 73 DOM
-
2026-06-07days on market $182,000 Active 72 DOM
-
2026-06-07days on market $182,000 Active 71 DOM
-
2026-06-04days on market $182,000 Active 68 DOM
-
2026-06-02days on market $182,000 Active 67 DOM
-
2026-06-01days on market $182,000 Active 66 DOM
-
2026-05-31days on market $182,000 Active 65 DOM
-
2026-05-31days on market $182,000 Active 64 DOM
-
2026-04-27price $182,000 917-char remark
Show marketing remark (917 chars)
Step into this beautifully updated 3-bedroom, 2-bath home where modern upgrades meet timeless charm! From the moment you walk in, you’ll love the blend of brand-new laminate flooring, plush new carpet, and original hardwood floors that bring warmth and character throughout. The fully remodeled kitchen features all-new cabinets, countertops, and appliances—perfect for cooking and entertaining. Both bathrooms have been completely updated with fresh, modern finishes. Enjoy peace of mind with new plumbing and water lines, updated wiring, new interior doors, trim, LED lighting, and ceiling fans throughout—every detail has been thoughtfully upgraded! Step outside to relax or entertain on the spacious rear wood deck, overlooking the backyard complete with a 10x12 shed for extra storage. Nestled in a quiet, peaceful neighborhood, this home truly has it all—style, comfort, and convenience.
-
2026-03-27$189,500 Active 917-char remark
Show marketing remark (917 chars)
Step into this beautifully updated 3-bedroom, 2-bath home where modern upgrades meet timeless charm! From the moment you walk in, you’ll love the blend of brand-new laminate flooring, plush new carpet, and original hardwood floors that bring warmth and character throughout. The fully remodeled kitchen features all-new cabinets, countertops, and appliances—perfect for cooking and entertaining. Both bathrooms have been completely updated with fresh, modern finishes. Enjoy peace of mind with new plumbing and water lines, updated wiring, new interior doors, trim, LED lighting, and ceiling fans throughout—every detail has been thoughtfully upgraded! Step outside to relax or entertain on the spacious rear wood deck, overlooking the backyard complete with a 10x12 shed for extra storage. Nestled in a quiet, peaceful neighborhood, this home truly has it all—style, comfort, and convenience.
-
2023-08-22soldstatus $60,000
ⓘ Source: listings_history table (triggers on properties + properties_extension) + one-shot
backfill from property_details.listing_events for pre-trigger history.
Tax reassessment forecast IN · Partial reset (capped growth)
- Current annual tax
- $500 · $42/mo
- Projected year-2 tax
- $1,002 · $84/mo
- Expected delta
- +$502/yr (+$42/mo · 100.5%)
ⓘ Screening estimate from a state-policy table — verify with the county assessor before closing.
Climate risk First Street
- Flood 1/10 Low 0% chance over 30 yrs
- Wildfire 1/10 Low
- Heat 5/10 Major 7 d/yr ≥106°F today · 19 d/yr by 30 yrs out
- Wind 2/10 Low 2% chance of damaging wind over 30 yrs
- Air quality 4/10 Moderate 3 unhealthy d/yr today · 5 by 30 yrs out
Nearby sold comps map
Loading sold comps map…
Walkable amenities ~0.75 mi
Loading nearby amenities…
Taxation est. · year 1
- Rental income
- $17,643
- − Mortgage interest
- −$9,915
- − Property taxes
- −$500
- − Insurance
- −$885
- − Repairs & maintenance
- −$1,411
- − Management
- −$1,411
- − Depreciation
- −$5,149
- Taxable loss
- −$1,629
- Est. tax savings @ 24.0%
- +$391
- After-tax cash flow
- $1,805/yr
For passive investors: Depreciation is non-cash, so a rental often shows a tax loss while cash-flowing — sheltering income. Rental losses are passive: they offset passive income freely, and up to $25,000/yr can offset ordinary (W-2) income if you actively participate and your MAGI is under $100k (phasing out to $0 by $150k); unused losses carry forward. On sale, claimed depreciation is recaptured at up to 25%, and gains may owe capital-gains tax (a 1031 exchange can defer both). Figures are a year-1 estimate at your 24.0% rate — not tax advice; consult a CPA.
Schools (NCES district)
- District
- Washington Community Schools
- NCES district ID
- 1812450
- Math proficiency
- 36% ▼ -1.00%
- Reading proficiency
- 38% ▼ -3.00%
- Median HH income
- $45,422
- Composite
- 31.57/100
- National rank
- #5952
- State rank
- #174 of 301 in IN
Livability — Washington
- Score
- 72/100
- State rank
- #110
- US rank
- #5706
Category grades
Schools grade is shown separately in the Schools card above.
Census & demographics
- Census place
- Washington, IN
- City population
- 18,335
- Population (ZIP)
- 18,335
Population outlook (Daviess County) Hauer SSP2
- Today (2025)
- 33,940 people
- By 2030
- 34,457 · +1.5%
- By 2040
- 35,412 · +4.3%
- By 2050
- 35,803 · +5.5%
- By 2075
- 35,173 · +3.6%
- By 2100
- 29,799 · -12.2%
Race, ethnicity, and origin ACS 2023
- Neighborhood character
- Predominantly White (81%)
- Race & ethnicity
- White 81% Hispanic / Latino 11% Two or more races 8% Black 3%
- Hispanic origin (detail)
- Mexican 9%
- Common ancestry
- Hispanic 4% Lithuanian 2% Slovak 1%
- Foreign-born
- 7% · Canada
- Languages at home
- 89% English-only · Spanish 5% French/Haitian/Cajun 3% German/W. Germanic 1%
Political lean MEDSL · Daviess
- 2024 margin
- Solid R (+64.3) · D 17.1% · R 81.5% · Other 1.4%
- 2008→2024 swing
- -29.1pp toward R · 2008: -35.2pp · 2024: -64.3pp
- All cycles
- 2024: R+64.3 2020: R+62.0 2016: R+62.8 2012: R+50.8 2008: R+35.2
Not yet ingested
- Civics
- —
Market trends
- HPI YoY
- ▼ -64.30%
- Current HPI
- 213.3049
- Rent YoY
- —
- Metro
- —
- State GDP YoY
- ▲ 2.90%
- F500 in state
- 18
Industry mix (Fortune 500 HQ in IN)
| Industry | F500 HQs | Revenue |
|---|---|---|
| Industrial Machinery | 2 | $37B |
|
||
| Healthcare | 1 | $177B |
|
||
| Pharmaceuticals | 1 | $45B |
|
||
| Metals / Steel | 1 | $18B |
|
||
| Agriculture | 1 | $17B |
|
||
| Packaging | 1 | $12B |
|
||
Price history
+203.3% since first listed3 events — show timeline
- 2026-04-27 Price Changed $182,000 IRMLS
- 2026-03-27 Listed $189,500 IRMLS
- 2023-08-22 Sold (Public Records) $60,000 Public Records
Property tax history
+1.1%/yrLatest (2024): $500 · +4.8% YoY. Source: county tax records.
Cash-flow waterfall
monthlySold comps — $/sqft
last 12 mo · ≤1 miLoading sold comps…