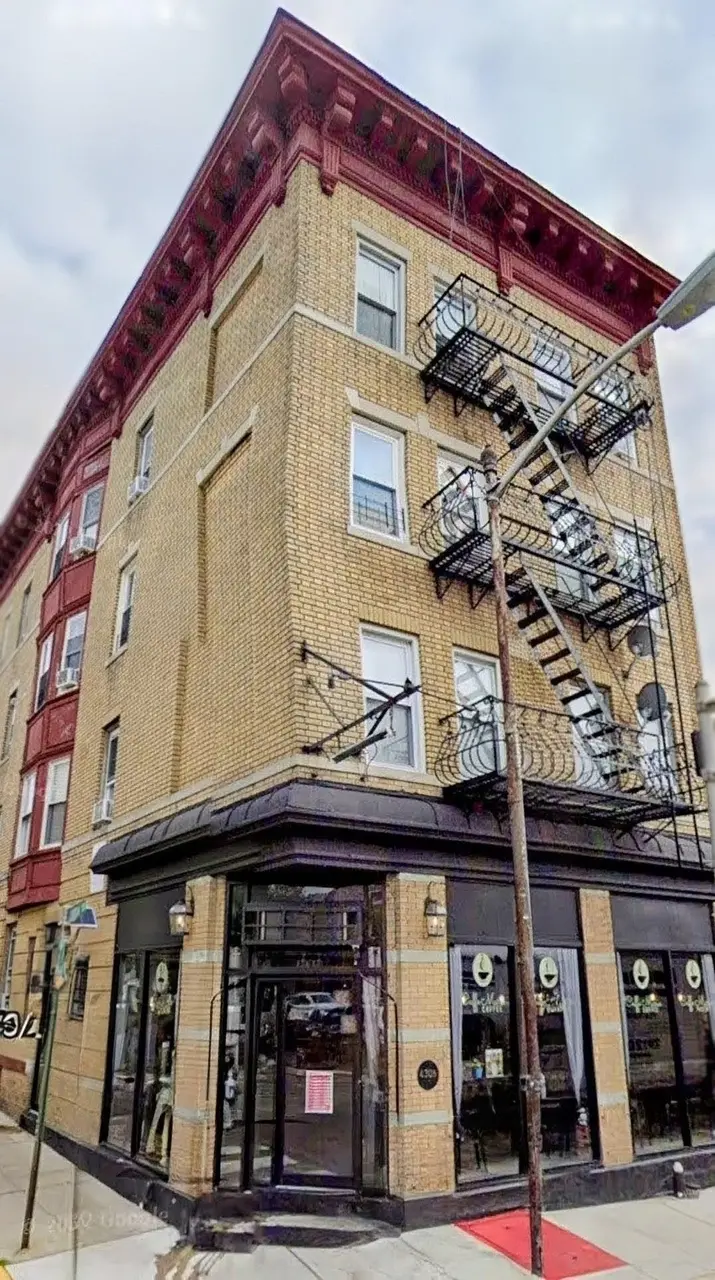
4306 KENNEDY Blvd #6 · Union City, NJ
Flood risk 4/10 · Minor
- FEMA flood zone
- X (unshaded)
- Chance of flooding over 30 yrs
- 0.2%
- Est. flood insurance / yr
- $507 – $1,088
Fire risk 1/10 · Minimal
- Est. fire insurance / yr
- $526 – $976
Heat risk 7/10 · Major
- Hot days now (above 98°F)
- 7 days/yr
- Hot days in 30 yrs
- 15 days/yr
Wind risk 6/10 · Moderate
- Chance of severe wind over 30 yrs
- 27.0%
Air-quality risk 4/10 · Minor
- Unhealthy air days now
- 5 days/yr
- Unhealthy air days in 30 yrs
- 6 days/yr
Risk factors via First Street. Map © Google.
Why this score? — see what drove the B+ grade
The composite is a weighted blend of 9 inputs, each scored 0–100. Each bar is that input's sub-score; the figure is the points it added to the 100-point composite (weight × sub-score).
- Cash flow +30.0/30.0
- 1% rule +10.0/10.0
- DSCR +10.0/10.0
- Appreciation +10.0/10.0
- ARV discount +7.5/15.0
- Livability +3.9/5.0
- Rent growth +2.7/5.0
- Condition / age +2.5/5.0
- Schools +2.2/10.0
$150,000
🖨 Deal sheet 📄 Offer letter ✓ Due diligence
Neighborhood map
What this means for you Summary
Snapshot
- This is a 2-bed/1.0-bath condo listed at $150k.
Deal economics
- At list price, monthly cash flow is $597 ($7k/yr) — positive.
- The deal already cash-flows at list — no discount required.
- Meets the 1% rule at list price ($2k rent vs $150k).
- Cap rate 11.1% vs local median 2.3% in Union City — top-decile yield for the area; either an underpriced asset or a hidden risk that comps aren't pricing in. Stress-test before assuming the spread holds.
Location & tenants
- Location reads 77/100 on livability (#117 in NJ, #2,998 nationally) — a middle-class / working-renter tenant base. Strengths: amenities A+, commute A+, health & safety A; Watch: cost of living F.
- Union City School District (suburban): math 15% / reading 36% proficiency, ranked #399 of 472 in NJ (top 84%) — low school quality limits family demand, transient renter base, plan for 1-2y turnover; 85% free/reduced lunch — lower-income household profile, screen leases tightly.
- Market conditions: Rents flat; 226 active listings in the ZIP; 40 comparable units currently listed for rent nearby; rentals at typical pace (median 22d on market — plan ~3-4 weeks tenant-placement turnaround); 5,310 units permitted in Hudson County in 2024 (4,154 in 5+ unit buildings).
- At $2,480/mo this rent would consume 46% of the median local household income ($64k/yr) (locally 6042% of renters already pay >50% of income on rent) — very limited rent-growth headroom before tenants either downsize or default.
Forward outlook
- In year one you build about $16k of equity ($1k loan paydown + $15k appreciation (10.0% local appreciation)).
- Hudson County population projected at +29% by 2050 — long-run rental-demand tailwind backs the buy-and-hold thesis.
- At projected returns (10.0% appreciation + 0.9% rent growth), your $42k cash investment doubles in ~2 years — after that, you're playing with house money.
- By year 3, paydown + projected appreciation supports a ~$41k cash-out refi (75% LTV) — recoverable capital for the next deal without selling this one.
Negotiation context
- Only 1 days on market — expect competitive offers; lowballing is unlikely to land.
- 2 sale attempts since 2y ago with the ask held roughly flat each time — persistent listings suggest the price (not the market) is what's stuck; bring a comps-based counter.
- Current owner paid $115k; 30% above their basis — modest negotiation headroom, anchor on the comps not their cost.
Risks & watch-outs
- Watch-outs: built in 1927 — expect roof / HVAC / electrical / plumbing capex.
- Climate carrying-cost: major wind risk, 27% chance of damaging wind over 30y; extreme-heat days projected 7→15/yr by 2055 (HVAC capex compounding) — expect insurance premiums to compound above CPI over the hold.
Questions for the listing agent
- Built in 1927 — when were the roof, HVAC, electrical panel, plumbing, and water heater last replaced?
- What does the HOA fee cover, when was the last increase, and are there any pending special assessments or reserve-fund shortfalls?
- Any open or pending special assessments — roof, HVAC, plumbing, elevator, façade? What's the per-unit balance and payoff schedule, and is the seller paying it off at close or rolling it to the buyer?
- Is there a deadline driving the sale (1031 exchange, divorce, estate, relocation)? That informs how much negotiation room exists.
- What's the average days-on-market for RENTAL listings here right now (not sales)? A rising rental-DOM trend means longer vacancies and softer asking-rent achievability than the comps imply.
- What's the recent tenant-quality profile in this submarket — average credit score on applications, eviction rate, late-payment / NSF rate, and stable-employment percentage? A property-management company in the area should have these aggregated.
- How much new apartment / multifamily construction is in the pipeline within 1–3 miles? Heavy new supply (>2% of stock underway) typically softens rents 12–24 months out; light construction supports rent growth.
Investment metrics
- 1% rule
- 1.65% ✓
- Cap rate
- 11.07%
- Cash-on-cash
- 17.07%
- DSCR
- 1.76
- GRM
- 5.0
CMA / ARV
No comps found within radius.
Projected returns pro-forma
10.0% appreciation · 0.89% rent growth · sell at horizon
- IRR
- 35.7%
- Equity multiple
- 3.73×
- Total profit
- $114,822
- Equity at exit
- $135,132
- IRR
- 29.9%
- Equity multiple
- 8.12×
- Total profit
- $299,097
- Equity at exit
- $291,417
Cash invested: $42,000 (down + closing). Projections, not guarantees.
Landlord ↔ Tenant lean methodology
- Overall (STATE)
- 21 Tenant-Leaning
- State New Jersey
- 21 Tenant-Leaning · D+6
- County
- — inherits STATE
- City
- — inherits STATE
ZIP-level market 07087
- Home prices YoY
- 9.6%
- Rents YoY
- 0.9%
- Active inventory
- 226
- Price-to-rent
- 5.0×
Monthly cashflow live
- Estimated rent
- $2,480 high interval (Pro) →
- Mortgage (P&I)
- −$787
- Tax from tax record
- −$232 /mo · $2,779/yr
- Insurance
- −$62
- HOA est. from 2 same-building comps
- −$281
- Vacancy / Maint / Mgmt
- −$521
- Net cashflow
- $597
Break-even live
UW: 25.0% down · 7.5% · 30yr · 1.5% tax · 5.0% vac · 8.0% maint · 8.0% mgmt
Financing live
Cash to close
- Down payment
- $37,500
- Closing costs
- $4,500
- Reserves months
- —
- Total cash needed
- —
Loan-product check · same deal, 3 products live
Conventional
25% down · 7.5% · 30yr
- Down + closing
- —
- Monthly P&I
- —
- Monthly cashflow
- —
- DSCR
- —
- Eligible?
- —
Personal DTI + credit; lowest rate.
DSCR
20% down · 8.5% · 30yr
- Down + closing
- —
- Monthly P&I
- —
- Monthly cashflow
- —
- DSCR
- —
- Eligible?
- —
No personal income docs; deal must DSCR.
Hard money
10% down · 12.0% · 12mo
- Down + closing
- —
- Monthly P&I
- —
- Monthly cashflow
- —
- DSCR
- —
- Eligible?
- —
Short-term bridge; refi at stabilization.
Rent comps 40 comps
| Address | Beds | Baths | Sqft | Rent | $/sqft | DOM | Units | Dist |
|---|---|---|---|---|---|---|---|---|
| 4901 Bergenline Ave West New York, NJ | 1.0–2.0 | 1.0–2.0 | 930 | $4,257 | $4.57 | 3d | 8 | 0.32mi |
| 121 41st St #1 Union City, NJ | 2.0 | 1.0 | 553 | $2,300 | $4.16 | 17d | 1 | 0.36mi |
| 213 48th St Unit 4A Union City, NJ | 1.0 | 1.0 | 360 | $1,825 | $5.07 | 44d | 1 | 0.37mi |
| 210 36th St Unit 3L Union City, NJ | 1.0 | 1.0 | 750 | $2,100 | $2.80 | 7d | 1 | 0.42mi |
| 4701 Park Ave Unit 2B Union City, NJ | 1.0 | 1.0 | 600 | $1,725 | $2.88 | 24d | 1 | 0.48mi |
| 115 37th St Unit 102 Union City, NJ | 1.0 | 1.0 | 600 | $2,500 | $4.17 | 5d | 1 | 0.49mi |
| 4828 Tonnelle Ave North Bergen, NJ | 2.0 | 1.0–2.0 | 868 | $3,047 | $3.51 | 2d | 25 | 0.54mi |
| 5406 Bergenline Ave West New York, NJ | 1.0 | 1.0 | 500 | $1,800 | $3.60 | 22d | 1 | 0.58mi |
| 603 55th St Apt 302 West New York, NJ | 1.0 | 1.0 | 643 | $1,900 | $2.95 | 21d | 1 | 0.58mi |
| 5309 Hudson Ave West New York, NJ | 2.0 | 1.0 | 750 | $2,095 | $2.79 | 3d | 1 | 0.61mi |
| 318 54th St West New York, NJ | 1.0 | 1.0 | 656 | $2,225 | $3.39 | 13d | 2 | 0.62mi |
| 318 54th St West New York, NJ | 1.0 | 1.0 | 618 | $2,225 | $3.60 | 10d | 2 | 0.62mi |
| 4914 Park Ave Unit 2F Weehawken, NJ | 1.0 | 1.0 | 550 | $1,990 | $3.62 | 24d | 1 | 0.62mi |
| 318 54th St Unit 1H West New York, NJ | 1.0 | 1.0 | 637 | $2,250 | $3.53 | 11d | 1 | 0.63mi |
| 407 56th St Unit 308 West New York, NJ | 1.0 | 1.5 | 700 | $2,300 | $3.29 | 24d | 1 | 0.66mi |
| 231 32nd St Unit 412 Weehawken, NJ | 1.0 | 1.0 | 683 | $2,815 | $4.12 | 7d | 1 | 0.67mi |
| 29 51st St Unit D4 Weehawken Township, NJ | 1.0 | 1.0 | 750 | $2,350 | $3.13 | 24d | 1 | 0.67mi |
| 2705 Central Ave Unit 1 Union City, NJ | 2.0 | 1.0 | 500 | $2,300 | $4.60 | 17d | 1 | 0.69mi |
| 2709 Bergenline Ave Unit 3B Union City, NJ | 1.0 | 1.0 | 700 | $1,550 | $2.21 | 22d | 1 | 0.70mi |
| 5665 John F. Kennedy Blvd North Bergen, NJ | 2.0 | 1.0–2.0 | 1011 | $3,395 | $3.36 | 2d | 1 | 0.74mi |
| 5711 Washington St #404 West New York, NJ | 1.0 | 1.0 | 700 | $2,450 | $3.50 | 24d | 1 | 0.75mi |
| 5711 John F. Kennedy Blvd Unit 234 North Bergen, NJ | 1.0 | 1.0 | 736 | $2,515 | $3.42 | 24d | 1 | 0.77mi |
| 5711 John F. Kennedy Blvd Unit 534 North Bergen, NJ | 1.0 | 1.0 | 736 | $2,607 | $3.54 | 24d | 1 | 0.77mi |
| 5711 John F. Kennedy Blvd #203 North Bergen, NJ | 1.0 | 1.0 | 724 | $2,469 | $3.41 | 24d | 1 | 0.77mi |
| 5711 John F. Kennedy Blvd Unit 304 North Bergen, NJ | 1.0 | 1.0 | 736 | $2,483 | $3.37 | 24d | 1 | 0.77mi |
| 5711 John F. Kennedy Blvd Unit 228 North Bergen, NJ | 1.0 | 1.0 | 736 | $2,492 | $3.39 | 24d | 1 | 0.77mi |
| 5711 John F. Kennedy Blvd #404 North Bergen, NJ | 1.0 | 1.0 | 736 | $2,510 | $3.41 | 24d | 1 | 0.77mi |
| 2626 Grand Ave North Bergen, NJ | 1.0 | 1.0 | 736 | $2,522 | $3.42 | 17d | 7 | 0.78mi |
| 5711 John F. Kennedy Blvd #434 North Bergen, NJ | 1.0 | 1.0 | 736 | $2,561 | $3.48 | 24d | 1 | 0.78mi |
| 5414 Park Ave Unit 31 West New York, NJ | 2.0 | 1.0 | 750 | $2,395 | $3.19 | 24d | 1 | 0.78mi |
| 1300 Avenue At Port Imperial Weehawken, NJ | 2.0 | 1.0–2.0 | 915 | $5,924 | $6.47 | 2d | 17 | 0.78mi |
| 303 58th St Unit 14 West New York, NJ | 1.0 | 1.0 | 650 | $1,695 | $2.61 | 2d | 1 | 0.79mi |
| 221 Jane St #1 Weehawken, NJ | 1.0 | 1.0 | 600 | $2,100 | $3.50 | 22d | 1 | 0.81mi |
| 1100 Avenue At Port Imperial Weehawken, NJ | 3.0 | 1.0–2.0 | 924 | $6,058 | $6.55 | 1d | 20 | 0.81mi |
| 5817 Jefferson St Unit 205 West New York, NJ | 1.0 | 1.0 | 750 | $2,250 | $3.00 | 24d | 1 | 0.81mi |
| 5817 Jefferson St #305 West New York, NJ | 1.0 | 1.0 | 750 | $2,250 | $3.00 | 13d | 1 | 0.81mi |
| 1500 Avenue At Port Imperial Weehawken, NJ | 2.0 | 1.0–2.0 | 886 | $5,304 | $5.98 | 2d | 19 | 0.81mi |
| 900 Ave At Port Imperial Blvd Weehawken, NJ | 2.0 | 1.0–2.0 | 791 | $6,320 | $7.98 | 1d | 26 | 0.82mi |
| 117 57th St #2 West New York, NJ | 2.0 | 1.0 | 600 | $2,100 | $3.50 | 22d | 1 | 0.82mi |
| 5903 Jefferson St #302 West New York, NJ | 1.0 | 1.0 | 745 | $2,250 | $3.02 | 24d | 1 | 0.84mi |
HOA detail condo
- Monthly dues
- $0 · $0/yr
- Assessments
- None detected in remarks — confirm with the listing agent.
Listing history 1 events
-
2026-06-15$150,000 Under Contract 1 DOM
ⓘ Source: listings_history table (triggers on properties + properties_extension) + one-shot
backfill from property_details.listing_events for pre-trigger history.
Tax reassessment forecast NJ · Partial reset (capped growth)
- Current annual tax
- $2,779 · $232/mo
- Projected year-2 tax
- $3,257 · $271/mo
- Expected delta
- +$478/yr (+$40/mo · 17.2%)
ⓘ Screening estimate from a state-policy table — verify with the county assessor before closing.
Climate risk First Street
- Flood 4/10 Moderate FEMA zone X (unshaded) · 20% chance over 30 yrs
- Wildfire 1/10 Low
- Heat 7/10 Severe 7 d/yr ≥98°F today · 15 d/yr by 30 yrs out
- Wind 6/10 Major 27% chance of damaging wind over 30 yrs
- Air quality 4/10 Moderate 5 unhealthy d/yr today · 6 by 30 yrs out
Nearby sold comps map
Loading sold comps map…
Walkable amenities ~0.75 mi
Loading nearby amenities…
Taxation est. · year 1
- Rental income
- $29,759
- − Mortgage interest
- −$8,402
- − Property taxes
- −$2,779
- − Insurance
- −$750
- − Repairs & maintenance
- −$2,381
- − Management
- −$2,381
- − HOA
- −$3,372
- − Depreciation
- −$4,364
- Taxable income
- $5,330
- Est. tax owed @ 24.0%
- −$1,279
- After-tax cash flow
- $5,889/yr
For passive investors: Depreciation is non-cash, so a rental often shows a tax loss while cash-flowing — sheltering income. Rental losses are passive: they offset passive income freely, and up to $25,000/yr can offset ordinary (W-2) income if you actively participate and your MAGI is under $100k (phasing out to $0 by $150k); unused losses carry forward. On sale, claimed depreciation is recaptured at up to 25%, and gains may owe capital-gains tax (a 1031 exchange can defer both). Figures are a year-1 estimate at your 24.0% rate — not tax advice; consult a CPA.
Schools (NCES district)
- District
- Union City School District
- NCES district ID
- 3416380
- Math proficiency
- 15% ▼ -19.00%
- Reading proficiency
- 36% ▼ -19.00%
- Median HH income
- $41,210
- Composite
- 21.55/100
- National rank
- #8312
- State rank
- #399 of 472 in NJ
Livability — Union City
- Score
- 77/100
- State rank
- #117
- US rank
- #2998
Category grades
Schools grade is shown separately in the Schools card above.
Census & demographics
- Census place
- Union City, NJ
- County
- Hudson County · 718,323 people
- City population
- 66,463
- Metro
- New York-Newark-Jersey City, NY-NJ-PA
- Population (ZIP)
- 66,463
- Household income
- $64,310
- Rent vs Own
- Severe rent burden
- 6042.0
Population outlook (Hudson County) Hauer SSP2
- Today (2025)
- 771,834 people
- By 2030
- 818,028 · +6.0%
- By 2040
- 907,866 · +17.6%
- By 2050
- 994,480 · +28.8%
- By 2075
- 1,163,301 · +50.7%
- By 2100
- 1,254,703 · +62.6%
Race, ethnicity, and origin ACS 2023
- Neighborhood character
- Predominantly Hispanic (82%)
- Race & ethnicity
- Hispanic / Latino 82% Two or more races 28% White 10% Asian 4% Black 3% Native American 2%
- Hispanic origin (detail)
- Mexican 7% Puerto Rican 8% Cuban 9% Dominican 17%
- Foreign-born
- 55% · Canada, Jamaica, China
- Languages at home
- 18% English-only · Spanish 74% Other Indo-European 2% Arabic 1%
Political lean MEDSL · Hudson
- 2024 margin
- Strong D (+28.1) · D 62.6% · R 34.6% · Other 2.8%
- 2008→2024 swing
- -18.7pp toward R · 2008: 46.7pp · 2024: 28.1pp
- All cycles
- 2024: D+28.1 2020: D+46.2 2016: D+51.8 2012: D+55.7 2008: D+46.7
Not yet ingested
- Civics
- —
Market trends
- HPI YoY
- ▲ 52.10%
- Current HPI
- 597.8126
- Rent YoY
- ▲ 0.89%
- Metro
- New York-Newark-Jersey City, NY-NJ-PA
- State GDP YoY
- ▲ 2.05%
- F500 in state
- 34
Industry mix (Fortune 500 HQ in NJ)
| Industry | F500 HQs | Revenue |
|---|---|---|
| Consumer Goods | 3 | $31B |
|
||
| Pharmaceuticals | 2 | $153B |
|
||
| Technology | 2 | $21B |
|
||
| Insurance | 2 | $20B |
|
||
| Healthcare | 2 | $19B |
|
||
| Financial Services | 1 | $70B |
|
||
Price history
-21.1% since first listed6 events — show timeline
- 2026-06-15 Pending — HCMLS
- 2026-06-14 Listed $150,000 HCMLS
- 2026-04-06 Sold (Public Records) $115,000 Public Records
- 2025-02-01 Listing Removed — HCMLS
- 2024-09-13 Listed $170,000 HCMLS
- 1995-04-27 Sold (Public Records) $190,000 Public Records
Property tax history
+4.7%/yrLatest (2025): $2,779 · +7.7% YoY. Source: county tax records.
Cash-flow waterfall
monthlySold comps — $/sqft
last 12 mo · ≤1 miLoading sold comps…