 🏷️ Likely Rental
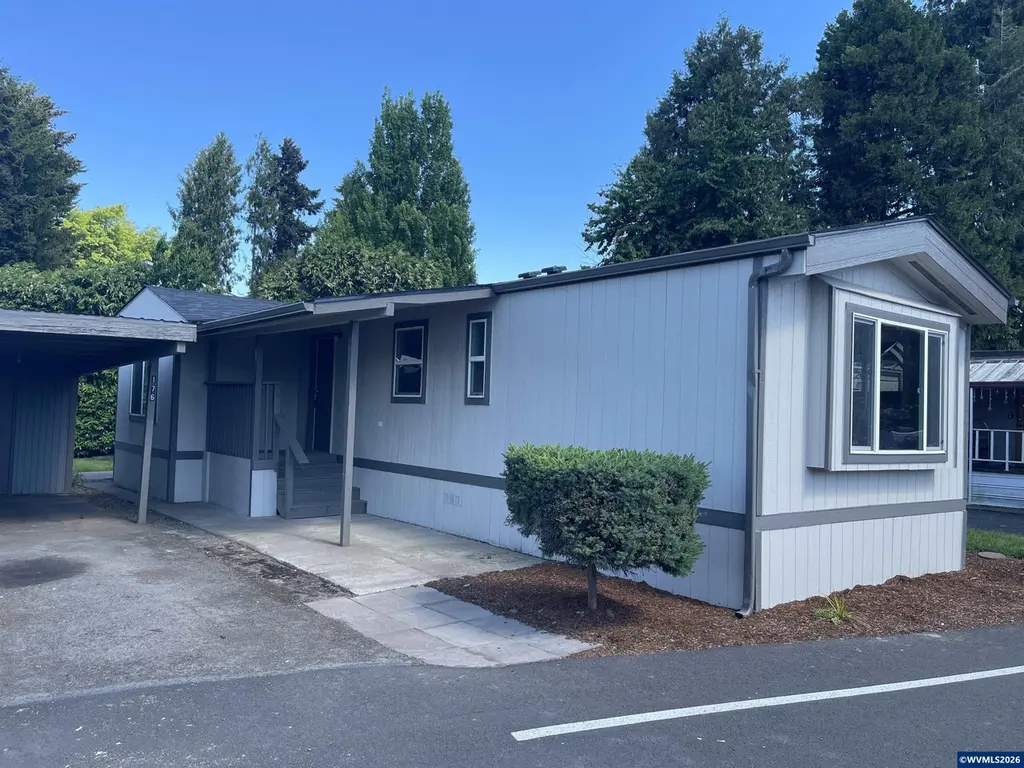
176 47th Ave NE #176 · Four Corners, OR
Flood risk 4/10 · Minor
- FEMA flood zone
- X (unshaded)
- Chance of flooding over 30 yrs
- 0.21%
- Est. flood insurance / yr
- $507 – $1,088
Fire risk 3/10 · Minor
- Est. fire insurance / yr
- $498 – $926
Heat risk 3/10 · Minor
- Hot days now (above 91°F)
- 7 days/yr
- Hot days in 30 yrs
- 14 days/yr
Wind risk 1/10 · Minimal
- Chance of severe wind over 30 yrs
- —
Air-quality risk 9/10 · Severe
- Unhealthy air days now
- 12 days/yr
- Unhealthy air days in 30 yrs
- 13 days/yr
Risk factors via First Street. Map © Google.
Why this score? — see what drove the B grade
The composite is a weighted blend of 9 inputs, each scored 0–100. Each bar is that input's sub-score; the figure is the points it added to the 100-point composite (weight × sub-score).
- Cash flow +30.0/30.0
- 1% rule +10.0/10.0
- DSCR +10.0/10.0
- ARV discount +7.5/15.0
- Condition / age +4.0/5.0
- Livability +3.9/5.0
- Schools +3.7/10.0
- Rent growth +2.3/5.0
- Appreciation +0.0/10.0
$53,990
🖨 Deal sheet 📄 Offer letter ✓ Due diligence
Listing remarks
Your NEW home! This home features a new roof, siding, and finishes inside and out! Spacious bump out living area. Come see what you WON'T have to worry about for a long time! Seller to cover first 3 months space rent! Royal Mobile Estates is a 55+ park with amenities. Large clubhouse that you get to use for free, and you can schedule for your big gatherings or attend the activities already happening. Beautiful grounds with pond for walking and relaxing. Pet friendly with no weight limit on dogs.
Key facts
- New siding
- New exterior paint
- New flooring
Tags
Neighborhood map
What this means for you Summary
Snapshot
- This is a 2-bed/2.0-bath manufactured listed at $54k. Condition is rated good.
Deal economics
- At list price, monthly cash flow is $817 ($10k/yr) — positive.
- The deal already cash-flows at list — no discount required.
- Meets the 1% rule at list price ($2k rent vs $54k).
- Recommended offer: $53k (1.5% below list) — sets the bar for market timing.
- Cap rate 24.4% vs local median 3.9% in Four Corners — top-decile yield for the area; either an underpriced asset or a hidden risk that comps aren't pricing in. Stress-test before assuming the spread holds.
Location & tenants
- Location reads 78/100 on livability (#66 in OR, #2,680 nationally) — a middle-class / working-renter tenant base. Strengths: housing A+, health & safety A+, amenities B+; Watch: schools D-, crime D-.
- Salem-Keizer SD 24J (urban): math 34% / reading 47% proficiency, ranked #103 of 183 in OR (top 56%) — families likely to look elsewhere, expect single-tenant / working-renter base with shorter leases.
- Market conditions: Rents soft (-0.7%/yr); 276 active listings in the ZIP; 40 comparable units currently listed for rent nearby; rentals at typical pace (median 23d on market — plan ~3-4 weeks tenant-placement turnaround); 1,591 units permitted in Marion County in 2024 (716 in 5+ unit buildings).
Forward outlook
- Local home prices are declining (-3.0%/yr); year-one equity from $374 of loan paydown is wiped out by about $2k of value loss. Plan a longer hold.
- Marion County population projected at +17% by 2050 — long-run rental-demand tailwind backs the buy-and-hold thesis.
- At projected returns (-3.0% appreciation + 0.0% rent growth), your $15k cash investment doubles in ~2 years — after that, you're playing with house money.
Negotiation context
- It's been on market 22 days — a 2% lower offer ($53k) is reasonable based on typical stale-listing flexibility.
Questions for the listing agent
- Built in 1975 — when were the roof, HVAC, electrical panel, plumbing, and water heater last replaced?
- Is there a deadline driving the sale (1031 exchange, divorce, estate, relocation)? That informs how much negotiation room exists.
- Schools are D-rated, which usually means shorter tenancies and higher turnover. Who's the typical renter profile here, and what's been the actual vacancy rate?
- Crime grade is D in this area — have there been break-ins, vandalism, or insurance claims at this property in the last 3 years? What carrier currently insures it and at what premium?
- What's the average days-on-market for RENTAL listings here right now (not sales)? A rising rental-DOM trend means longer vacancies and softer asking-rent achievability than the comps imply.
- What's the recent tenant-quality profile in this submarket — average credit score on applications, eviction rate, late-payment / NSF rate, and stable-employment percentage? A property-management company in the area should have these aggregated.
- How much new for-sale + rental construction is in the pipeline within 1–3 miles? Heavy new supply typically softens prices + rents 12–24 months out; constrained supply supports both.
Investment metrics
- 1% rule
- 2.79% ✓
- Cap rate
- 24.44%
- Cash-on-cash
- 64.82%
- DSCR
- 3.88
- GRM
- 3.0
CMA / ARV
- ARV (median comp)
- $113,963
- List price
- $53,990
- Delta
- -39.45%
- Verdict
- UNDERPRICED
- Comps
- 11 within 1.0 mi
Show comp detail 9 sales within ~0.75 mi
| Address | Dist | Beds/Ba | Sqft | Sold | Price | $/sf | Match |
|---|---|---|---|---|---|---|---|
| 176 47th Ave NE | 0.00mi | 2/2.0 | 1,008 (0%) | 9mo | $7,500 | $7 | 92 |
| 287 Broadmore Ave NE #287 | 0.01mi | 2/1.0 | 924 (-8%) | 12mo | $7,700 | $8 | 72 |
| 193 Broadmore Ave NE | 0.07mi | 2/1.0 | 910 (-10%) | 6mo | $60,000 | $66 | 71 |
| 4730 Auburn Rd NE #10 | 0.24mi | 2/2.0 | 1,104 (+10%) | 3mo | $92,500 | $84 | 70 |
| 341 Cornerstone Ct | 0.43mi | 2/2.0 | 1,056 (+5%) | 3mo | $316,000 | $299 | 69 |
| 148 47th Ave NE | 0.06mi | 2/2.0 | 1,128 (+12%) | 11mo | $77,000 | $68 | 69 |
| 4725 Avens Ave | 0.07mi | 1/1.0 (-1) | 924 (-8%) | 10mo | $1,001 | $1 | 66 |
| 4730 Auburn Rd NE #95 | 0.24mi | 2/2.0 | 1,152 (+14%) | 13mo | $52,000 | $45 | 54 |
| 114 Broadmore Ave NE | 0.10mi | 3/2.0 (+1) | 1,152 (+14%) | 23mo | $60,000 | $52 | 47 |
Match score weights: distance 35% · size 25% · config 20% · recency 20%. Top-matched comps best support the ARV.
Projected returns pro-forma
-3.0% appreciation · 0.0% rent growth · sell at horizon
- IRR
- 60.5%
- Equity multiple
- 3.57×
- Total profit
- $38,870
- Equity at exit
- $8,050
- IRR
- 64.2%
- Equity multiple
- 6.55×
- Total profit
- $83,853
- Equity at exit
- $4,668
Cash invested: $15,117 (down + closing). Projections, not guarantees.
Landlord ↔ Tenant lean methodology
- Overall (STATE)
- 28 Tenant-Leaning
- State Oregon
- 28 Tenant-Leaning · D+6
- County
- — inherits STATE
- City
- — inherits STATE
ZIP-level market 97301
- Rents YoY
- -0.7%
- Active inventory
- 276
- Price-to-rent
- 3.0×
Monthly cashflow live
- Estimated rent
- $1,506 high interval (Pro) →
- Mortgage (P&I)
- −$283
- Tax est. 1.5%
- −$67 /mo · $810/yr
- Insurance
- −$22
- HOA
- −$0
- Vacancy / Maint / Mgmt
- −$316
- Net cashflow
- $817
Break-even live
UW: 25.0% down · 7.5% · 30yr · 1.5% tax · 5.0% vac · 8.0% maint · 8.0% mgmt
Financing live
Cash to close
- Down payment
- $13,498
- Closing costs
- $1,620
- Reserves months
- —
- Total cash needed
- —
Loan-product check · same deal, 3 products live
Conventional
25% down · 7.5% · 30yr
- Down + closing
- —
- Monthly P&I
- —
- Monthly cashflow
- —
- DSCR
- —
- Eligible?
- —
Personal DTI + credit; lowest rate.
DSCR
20% down · 8.5% · 30yr
- Down + closing
- —
- Monthly P&I
- —
- Monthly cashflow
- —
- DSCR
- —
- Eligible?
- —
No personal income docs; deal must DSCR.
Hard money
10% down · 12.0% · 12mo
- Down + closing
- —
- Monthly P&I
- —
- Monthly cashflow
- —
- DSCR
- —
- Eligible?
- —
Short-term bridge; refi at stabilization.
Rent comps 40 comps
| Address | Beds | Baths | Sqft | Rent | $/sqft | DOM | Units | Dist |
|---|---|---|---|---|---|---|---|---|
| 138 Bayview Way NE Salem, OR | 2.0 | 1.0 | 850 | $1,395 | $1.64 | 13d | 3 | 0.10mi |
| 4611 State St Unit 4611 Salem, OR | 2.0 | 1.0 | 840 | $1,450 | $1.73 | 23d | 1 | 0.17mi |
| 143 Connecticut Ave SE Unit 145 Salem, OR | 3.0 | 1.0 | 1207 | $1,595 | $1.32 | 13d | 1 | 0.24mi |
| 143 Connecticut Ave SE Unit 143 Salem, OR | 1.0 | 1.0 | 705 | $950 | $1.35 | 13d | 1 | 0.24mi |
| 102 Greencrest St NE Salem, OR | 3.0 | 1.0–2.0 | 914 | $1,918 | $2.10 | 13d | 25 | 0.32mi |
| 4836 Tanglewood Ct SE Salem, OR | 3.0 | 2.0 | 1316 | $2,150 | $1.63 | 23d | 1 | 0.38mi |
| 4433 Mahrt Ave SE Unit 4435-201 Salem, OR | 2.0 | 2.0 | 888 | $1,525 | $1.72 | 23d | 1 | 0.41mi |
| 4433 Mahrt Ave SE Unit 4437-206 Salem, OR | 2.0 | 2.0 | 932 | $1,525 | $1.64 | 43d | 1 | 0.41mi |
| 124 Stafford Ln NE Unit 124-203 Salem, OR | 3.0 | 2.0 | 1052 | $1,595 | $1.52 | 43d | 1 | 0.46mi |
| 133 Stafford Ln NE Unit 133-103 Salem, OR | 2.0 | 1.0 | 827 | $1,195 | $1.44 | 43d | 1 | 0.48mi |
| 4166 State St Salem, OR | 2.0 | 1.0 | 788 | $1,350 | $1.71 | 13d | 1 | 0.61mi |
| 4135 State St Unit 11 Salem, OR | 2.0 | 1.0 | 820 | $1,195 | $1.46 | 43d | 1 | 0.65mi |
| 435 Fountain Valley Way NE Salem, OR | 1.0–2.0 | 1.0–2.0 | 939 | $1,559 | $1.66 | 21d | 5 | 0.74mi |
| 4807 Chinook Ct SE Salem, OR | 3.0 | 1.5 | 1104 | $2,200 | $1.99 | 13d | 1 | 0.74mi |
| 4341 Center St NE Salem, OR | 2.0 | 1.0 | 828 | $1,130 | $1.36 | 43d | 1 | 0.82mi |
| 178 Lancaster Dr SE Salem, OR | 2.0 | 2.0 | 952 | $1,495 | $1.57 | 13d | 1 | 0.83mi |
| 4776 Buffalo Dr SE Salem, OR | 3.0 | 1.0 | 1369 | $2,150 | $1.57 | 43d | 1 | 0.85mi |
| 295 Colt Ln NE Salem, OR | 3.0 | 2.0 | 1052 | $1,575 | $1.50 | 13d | 1 | 0.91mi |
| 1029 Raffon Ct SE Unit AR7171-3 Salem, OR | 2.0 | 1.5 | 927 | $1,700 | $1.83 | 23d | 1 | 0.93mi |
| 3750-3762 Amber St NE Unit 3758-107 Salem, OR | 2.0 | 2.5 | 1150 | $1,595 | $1.39 | 23d | 1 | 0.96mi |
| 3750-3762 Amber St NE Unit 3762-107 Salem, OR | 2.0 | 2.5 | 1150 | $1,595 | $1.39 | 43d | 1 | 0.96mi |
| 3897 Meadowlawn Loop SE Salem, OR | 1.0–3.0 | 1.0–2.0 | 962 | $1,619 | $1.68 | 13d | 26 | 1.00mi |
| 430 Brittany Way NE Unit 369-421 Salem, OR | 2.0 | 2.0 | 920 | $1,400 | $1.52 | 43d | 1 | 1.01mi |
| 3880 Auburn Rd NE Unit 3896 Salem, OR | 2.0 | 1.0 | 850 | $1,450 | $1.71 | 43d | 1 | 1.01mi |
| 3828 Bayonne Dr SE Salem, OR | 2.0 | 1.0 | 980 | $1,299 | $1.33 | 13d | 1 | 1.03mi |
| 3822 Bayonne Dr SE Salem, OR | 2.0 | 1.0 | 980 | $1,299 | $1.33 | 23d | 1 | 1.04mi |
| 5192 Caplinger Rd SE Salem, OR | 1.0–3.0 | 1.0–2.0 | 927 | $1,554 | $1.67 | 13d | 25 | 1.07mi |
| 4976 Turquoise Ave SE Salem, OR | 2.0 | 2.0 | 918 | $1,495 | $1.63 | 13d | 5 | 1.18mi |
| 1447 Connecticut St SE Salem, OR | 3.0 | 2.0 | 1258 | $2,675 | $2.13 | 43d | 1 | 1.23mi |
| 1569 Whitaker Dr SE Salem, OR | 1.0–3.0 | 1.0–2.0 | 933 | $1,799 | $1.93 | 13d | 1 | 1.35mi |
| 4243 Campbell Dr SE Unit 4243 Salem, OR | 3.0 | 1.0 | 936 | $1,550 | $1.66 | 13d | 1 | 1.39mi |
| 721-759 Hawthorne Ave NE Unit 733 Salem, OR | 2.0 | 1.0 | 712 | $995 | $1.40 | 43d | 1 | 1.43mi |
| 793 Hawthorne Ave NE Unit 803 Salem, OR | 2.0 | 1.0 | 750 | $1,225 | $1.63 | 13d | 1 | 1.45mi |
| 793 Hawthorne Ave NE Unit 837 Salem, OR | 2.0 | 1.0 | 750 | $1,125 | $1.50 | 13d | 1 | 1.45mi |
| 4435 Campbell Dr SE Salem, OR | 2.0 | 1.0 | 807 | $1,445 | $1.79 | 23d | 1 | 1.45mi |
| 3695 D St NE Salem, OR | 1.0–2.0 | 1.0–2.0 | 1037 | $1,650 | $1.59 | 43d | 3 | 1.45mi |
| 1415 Lancaster Dr NE Unit 16 Salem, OR | 2.0 | 1.0 | 850 | $1,250 | $1.47 | 43d | 1 | 1.47mi |
| 1415 Lancaster Dr NE Unit 18 Salem, OR | 2.0 | 1.0 | 850 | $1,200 | $1.41 | 43d | 1 | 1.47mi |
| 1415 Lancaster Dr NE Unit 33 Salem, OR | 2.0 | 1.0 | 850 | $1,225 | $1.44 | 43d | 1 | 1.47mi |
| 3293 Center St NE Salem, OR | 2.0 | 1.0 | 800 | $1,145 | $1.43 | 13d | 1 | 1.50mi |
Listing history 15 events
-
2026-06-18days on market $53,990 Active 22 DOM
-
2026-06-17remarks 502-char remark
-
2026-06-17pricedays on market $53,990 Active 21 DOM
-
2026-06-16days on market $54,990 Active 20 DOM
-
2026-06-15days on market $54,990 Active 19 DOM
-
2026-06-14days on market $54,990 Active 17 DOM
-
2026-06-10days on market $54,990 Active 14 DOM
-
2026-06-09days on market $54,990 Active 13 DOM
-
2026-06-08days on market $54,990 Active 12 DOM
-
2026-06-07days on market $54,990 Active 11 DOM
-
2026-06-03days on market $54,990 Active 7 DOM
-
2026-06-02days on market $54,990 Active 6 DOM
-
2026-06-01days on market $54,990 Active 5 DOM
-
2026-05-31days on market $54,990 Active 4 DOM
-
2026-05-30days on market $54,990 Active 3 DOM
ⓘ Source: listings_history table (triggers on properties + properties_extension) + one-shot
backfill from property_details.listing_events for pre-trigger history.
Climate risk First Street
- Flood 4/10 Moderate FEMA zone X (unshaded) · 21% chance over 30 yrs
- Wildfire 3/10 Moderate
- Heat 3/10 Moderate 7 d/yr ≥91°F today · 14 d/yr by 30 yrs out
- Wind 1/10 Low
- Air quality 9/10 Extreme 12 unhealthy d/yr today · 13 by 30 yrs out
Nearby sold comps map
Loading sold comps map…
Walkable amenities ~0.75 mi
Loading nearby amenities…
Taxation est. · year 1
- Rental income
- $18,071
- − Mortgage interest
- −$3,024
- − Property taxes
- −$810
- − Insurance
- −$270
- − Repairs & maintenance
- −$1,446
- − Management
- −$1,446
- − Depreciation
- −$1,571
- Taxable income
- $9,505
- Est. tax owed @ 24.0%
- −$2,281
- After-tax cash flow
- $7,518/yr
For passive investors: Depreciation is non-cash, so a rental often shows a tax loss while cash-flowing — sheltering income. Rental losses are passive: they offset passive income freely, and up to $25,000/yr can offset ordinary (W-2) income if you actively participate and your MAGI is under $100k (phasing out to $0 by $150k); unused losses carry forward. On sale, claimed depreciation is recaptured at up to 25%, and gains may owe capital-gains tax (a 1031 exchange can defer both). Figures are a year-1 estimate at your 24.0% rate — not tax advice; consult a CPA.
Condition & rehab AI · 12 photos
This 1975 manufactured home is in excellent condition with recent updates, making it move-in ready and ideal for both resale and rental.
Value-add opportunities
- Both Landscaping — Enhances curb appeal and adds value
- Both Painting — Fresh paint can make a home more appealing
- Both Lighting — Improved lighting can make a home more inviting
Renovation cost estimate screening
Value-add ROI direction
- Both Landscaping — Enhances curb appeal and adds value ↑
- Both Painting — Fresh paint can make a home more appealing ↑
- Both Lighting — Improved lighting can make a home more inviting ↑
ⓘ Cost ranges are severity-bucket heuristics (US national rule-of-thumb). Get contractor quotes + a written scope before underwriting a rehab budget.
Schools (NCES district)
- District
- Salem-Keizer SD 24J
- NCES district ID
- 4110820
- Math proficiency
- 34% ▼ -1.00%
- Reading proficiency
- 47% ▼ -2.00%
- Median HH income
- $48,632
- Composite
- 37.16/100
- National rank
- #9017
- State rank
- #103 of 183 in OR
Livability — Four Corners
- Score
- 78/100
- State rank
- #66
- US rank
- #2680
Category grades
Schools grade is shown separately in the Schools card above.
Census & demographics
- Census place
- Four Corners, OR
- County
- Marion County · 258,219 people
- Metro
- Salem, OR
- Population (ZIP)
- 57,574
- Household income
- $60,422
- Rent vs Own
- Severe rent burden
- 3089.0
Population outlook (Marion County) Hauer SSP2
- Today (2025)
- 360,940 people
- By 2030
- 375,178 · +3.9%
- By 2040
- 400,914 · +11.1%
- By 2050
- 422,187 · +17.0%
- By 2075
- 460,305 · +27.5%
- By 2100
- 464,025 · +28.6%
Race, ethnicity, and origin ACS 2023
- Neighborhood character
- Diverse neighborhood (Simpson 0.58)
- Race & ethnicity
- White 55% Hispanic / Latino 35% Two or more races 19% Asian 2% Black 2% Native American 1% Pacific Islander 1%
- Hispanic origin (detail)
- Mexican 31%
- Common ancestry
- Italian 4% Portuguese 2% Lithuanian 2%
- Foreign-born
- 17% · Canada, China, Philippines
- Languages at home
- 68% English-only · Spanish 27% Other Asian/Pacific 1% Russian/Polish/Slavic 1%
Political lean MEDSL · Marion
- 2024 margin
- Toss-up / Even · D 47.5% · R 49.5% · Other 3.0%
- 2008→2024 swing
- -4.2pp toward R · 2008: 2.2pp · 2024: -2.0pp
- All cycles
- 2024: R+2.0 2020: D+1.1 2016: R+5.0 2012: R+3.5 2008: D+2.2
Not yet ingested
- Civics
- —
Market trends
- HPI YoY
- ▼ -548.17%
- Current HPI
- 335.8199
- Rent YoY
- ▼ -0.70%
- Metro
- Salem, OR
- State GDP YoY
- ▲ 2.05%
- F500 in state
- 2
Industry mix (Fortune 500 HQ in OR)
| Industry | F500 HQs | Revenue |
|---|---|---|
| Consumer Goods | 1 | $51B |
|
||
Cash-flow waterfall
monthlySold comps — $/sqft
last 12 mo · ≤1 miLoading sold comps…