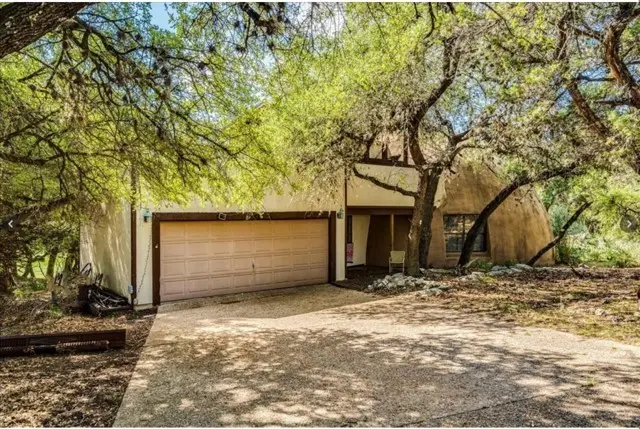
18501 N Venture Dr · Point Venture, TX
Flood risk 1/10 · Minimal
- FEMA flood zone
- X (unshaded)
- Chance of flooding over 30 yrs
- 0.0%
- Est. flood insurance / yr
- $507 – $1,088
Fire risk 1/10 · Minimal
- Est. fire insurance / yr
- $1,222 – $2,270
Heat risk 8/10 · Major
- Hot days now (above 107°F)
- 7 days/yr
- Hot days in 30 yrs
- 21 days/yr
Wind risk 6/10 · Moderate
- Chance of severe wind over 30 yrs
- 73.0%
Air-quality risk 1/10 · Minimal
- Unhealthy air days now
- 0 days/yr
- Unhealthy air days in 30 yrs
- 0 days/yr
Risk factors via First Street. Map © Google.
Why this score? — see what drove the B- grade
The composite is a weighted blend of 9 inputs, each scored 0–100. Each bar is that input's sub-score; the figure is the points it added to the 100-point composite (weight × sub-score).
- Cash flow +28.6/30.0
- 1% rule +10.0/10.0
- DSCR +10.0/10.0
- ARV discount +7.5/15.0
- Schools +3.8/10.0
- Livability +3.4/5.0
- Rent growth +3.2/5.0
- Condition / age +2.5/5.0
- Appreciation +0.0/10.0
$230,000
🖨 Deal sheet 📄 Offer letter ✓ Due diligence
Listing remarks
Seller Financing available! Welcome to your next project nestled in the heart of a vibrant community! This Lakeview Dome House, backing up to a picturesque golf course, offers an incredible opportunity for investors to restore it to its former glory. Located in a highly sought-after area with a serene ambiance, this property promises a lifestyle of tranquility and endless possibilities. Situated in a coveted Lakeview locale, this property offers not only second floor lake views but also proximity to fantastic community amenities. Enjoy effortless resort-style living in a vibrant, amenities-rich lakeside community on Lake Travis. Your POA membership provides incredible value with: • Unl
Key facts
- Golf clubhouse
- Lakeview dome house
- Tennis courts
Tags
Property features AI
Finance
- HOA & community: Homeowners association (PVPOA), $140 monthly covering common area maintenance; Community amenities: clubhouse, golf, lake access, playground, park, pool, tennis courts
Exterior
- Parking: Attached garage; Garage faces front; Driveway parking; Total 4 parking spaces (2 covered)
- Utilities: Electricity connected; Water connected via Municipal Utility District; Sewer connected via Municipal Utility District
- Home design: Two-story home; Resale property; Slab foundation
- Construction: Stucco construction; Built (year from public records)
- Exterior features: Deck; Patio; Water-smart landscaping; Large trees; Sloped lot; On golf course; Xeriscape; Lake Travis view; Has a view; Faces south
Interior
- Bedrooms: 2 bedrooms on the main level
- Bathrooms: 3 full bathrooms
- Heating & cooling: Central heating; Central air conditioning
- Interior features: Skylights; Breakfast bar; High ceilings; Multiple living areas; Main-level primary bedroom
- Laundry & utility: Main-level laundry room
Neighborhood map
What this means for you Summary
Snapshot
- This is a 3-bed/3.0-bath single-family listed at $230k.
Deal economics
- At list price, monthly cash flow is $762 ($9k/yr) — positive.
- The deal already cash-flows at list — no discount required.
- Meets the 1% rule at list price ($4k rent vs $230k).
- Recommended offer: $227k (1.5% below list) — sets the bar for market timing.
- Cap rate 10.3% vs local median 1.9% in Point Venture — top-decile yield for the area; either an underpriced asset or a hidden risk that comps aren't pricing in. Stress-test before assuming the spread holds.
Location & tenants
- Location reads 68/100 on livability (#509 in TX) — a middle-class / working-renter tenant base. Strengths: crime A+, employment A+, housing A+; Watch: schools C-, cost of living D+, amenities F.
- Lago Vista ISD (rural): math 33% / reading 51% proficiency, ranked #269 of 826 in TX (top 33%) — families likely to look elsewhere, expect single-tenant / working-renter base with shorter leases.
- Market conditions: Rents rising (+3.0%/yr); 1092 active listings in the ZIP; 8 comparable units currently listed for rent nearby; rentals at typical pace (median 16d on market — plan ~3-4 weeks tenant-placement turnaround); high-income renter base; 17,121 units permitted in Travis County in 2024 (11,963 in 5+ unit buildings).
- This rent runs 37% of the median local income ($113k/yr) — at the standard rent-burdened threshold; future hikes will face affordability resistance.
Forward outlook
- Local home prices are declining (-3.0%/yr); year-one equity from $2k of loan paydown is wiped out by about $7k of value loss. Plan a longer hold.
- Travis County population projected at +60% by 2050 — long-run rental-demand tailwind backs the buy-and-hold thesis.
- At projected returns (-3.0% appreciation + 3.0% rent growth), your $64k cash investment doubles in ~9 years — after that, you're playing with house money.
Negotiation context
- It's been on market 19 days — a 2% lower offer ($227k) is reasonable based on typical stale-listing flexibility.
- 9 sale attempts since 16y ago with the ask held roughly flat each time — persistent listings suggest the price (not the market) is what's stuck; bring a comps-based counter.
Risks & watch-outs
- Watch-outs: property tax is 3.0% of price.
- Climate carrying-cost: major wind risk, 73% chance of damaging wind over 30y; extreme-heat days projected 7→21/yr by 2055 (HVAC capex compounding) — expect insurance premiums to compound above CPI over the hold.
Questions for the listing agent
- Property tax is high relative to price — has the assessment been appealed recently, and will the sale trigger a re-assessment?
- What does the HOA fee cover, when was the last increase, and are there any pending special assessments or reserve-fund shortfalls?
- Is there a deadline driving the sale (1031 exchange, divorce, estate, relocation)? That informs how much negotiation room exists.
- What's the average days-on-market for RENTAL listings here right now (not sales)? A rising rental-DOM trend means longer vacancies and softer asking-rent achievability than the comps imply.
- What's the recent tenant-quality profile in this submarket — average credit score on applications, eviction rate, late-payment / NSF rate, and stable-employment percentage? A property-management company in the area should have these aggregated.
- How much new for-sale + rental construction is in the pipeline within 1–3 miles? Heavy new supply typically softens prices + rents 12–24 months out; constrained supply supports both.
Investment metrics
- 1% rule
- 1.53% ✓
- Cap rate
- 10.27%
- Cash-on-cash
- 14.20%
- DSCR
- 1.63
- GRM
- 5.4
CMA / ARV
- ARV (on-the-fly)
- $567,312
- Comps found
- 12
Show comp detail 12 sales within ~0.75 mi
| Address | Dist | Beds/Ba | Sqft | Sold | Price | $/sf | Match |
|---|---|---|---|---|---|---|---|
| 18502 Venture Dr | 0.04mi | 3/2.5 | 2,380 (-6%) | 7mo | $543,999 | $229 | 80 |
| 18401 Valley Hill Ln | 0.15mi | 4/2.5 (+1) | 2,369 (-7%) | 3mo | $543,000 | $229 | 72 |
| 18514 Staghorn Dr | 0.13mi | 3/2.5 | 2,371 (-7%) | 11mo | $498,000 | $210 | 71 |
| 204 S Venture Blvd | 0.19mi | 4/2.0 (+1) | 2,340 (-8%) | 1mo | $499,000 | $213 | 68 |
| 18682 Champions Cir | 0.07mi | 4/3.0 (+1) | 2,169 (-15%) | 1mo | $335,000 | $154 | 66 |
| 302 Southwind Rd | 0.23mi | 3/2.5 | 2,223 (-13%) | 5mo | $414,999 | $187 | 62 |
| 112 Venture Blvd S | 0.15mi | 3/2.0 | 2,175 (-14%) | 6mo | $742,000 | $341 | 60 |
| 18924 Peckham Dr | 0.50mi | 3/3.0 | 2,400 (-6%) | 10mo | $689,000 | $287 | 59 |
| 18704 Sugar Maple Dr | 0.47mi | 3/2.5 | 2,700 (+6%) | 10mo | $999,950 | $370 | 58 |
| 18917 Peckham Dr | 0.44mi | 4/3.5 (+1) | 2,652 (+4%) | 10mo | $500,000 | $189 | 57 |
| 429 Summit Ridge Dr N | 0.22mi | 4/3.5 (+1) | 2,866 (+13%) | 11mo | $640,000 | $223 | 53 |
| 18906 Venture Dr | 0.56mi | 3/2.5 | 2,232 (-12%) | 4mo | $498,500 | $223 | 48 |
Match score weights: distance 35% · size 25% · config 20% · recency 20%. Top-matched comps best support the ARV.
Projected returns pro-forma
-3.0% appreciation · 2.98% rent growth · sell at horizon
- IRR
- 4.6%
- Equity multiple
- 1.18×
- Total profit
- $11,506
- Equity at exit
- $34,294
- IRR
- 14.2%
- Equity multiple
- 2.14×
- Total profit
- $73,514
- Equity at exit
- $19,886
Cash invested: $64,400 (down + closing). Projections, not guarantees.
Landlord ↔ Tenant lean methodology
- Overall (STATE)
- 87 Strongly Landlord-Friendly
- State Texas
- 87 Strongly Landlord-Friendly · R+5
- County
- — inherits STATE
- City
- — inherits STATE
ZIP-level market 78645
- Home prices YoY
- -31.6%
- Rents YoY
- 3.0%
- Active inventory
- 1092
- Price-to-rent
- 5.4×
Monthly cashflow live
- Estimated rent
- $3,526 high interval (Pro) →
- Mortgage (P&I)
- −$1,206
- Tax from tax record
- −$581 /mo · $6,976/yr
- Insurance
- −$96
- HOA
- −$140
- Vacancy / Maint / Mgmt
- −$740
- Net cashflow
- $762
Break-even live
UW: 25.0% down · 7.5% · 30yr · 1.5% tax · 5.0% vac · 8.0% maint · 8.0% mgmt
Financing live
Cash to close
- Down payment
- $57,500
- Closing costs
- $6,900
- Reserves months
- —
- Total cash needed
- —
Loan-product check · same deal, 3 products live
Conventional
25% down · 7.5% · 30yr
- Down + closing
- —
- Monthly P&I
- —
- Monthly cashflow
- —
- DSCR
- —
- Eligible?
- —
Personal DTI + credit; lowest rate.
DSCR
20% down · 8.5% · 30yr
- Down + closing
- —
- Monthly P&I
- —
- Monthly cashflow
- —
- DSCR
- —
- Eligible?
- —
No personal income docs; deal must DSCR.
Hard money
10% down · 12.0% · 12mo
- Down + closing
- —
- Monthly P&I
- —
- Monthly cashflow
- —
- DSCR
- —
- Eligible?
- —
Short-term bridge; refi at stabilization.
Rent comps 8 comps
| Address | Beds | Baths | Sqft | Rent | $/sqft | DOM | Units | Dist |
|---|---|---|---|---|---|---|---|---|
| 332 Southwind Rd Lago Vista, TX | 4.0 | 3.0 | 2485 | $3,800 | $1.53 | 23d | 1 | 0.25mi |
| 1517 Osprey Ridge Loop Lago Vista, TX | 4.0 | 3.5 | 3353 | $9,975 | $2.97 | 12d | 1 | 1.15mi |
| 103 Comet Lakeway, TX | 3.0 | 2.0 | 2359 | $2,750 | $1.17 | 43d | 1 | 1.16mi |
| 13 Casa Verde Lakeway, TX | 2.0 | 2.0 | 1784 | $2,250 | $1.26 | 16d | 1 | 1.22mi |
| 208 Crescent Blf Lakeway, TX | 3.0 | 3.0 | 1956 | $2,995 | $1.53 | 11d | 1 | 1.26mi |
| 105 Crescent Blf Lakeway, TX | 3.0 | 3.5 | 2472 | $2,900 | $1.17 | 16d | 1 | 1.35mi |
| 112 Highlander Cv Lakeway, TX | 3.0 | 3.0 | 2480 | $2,900 | $1.17 | 10d | 1 | 1.38mi |
| 110 Oak Glen Cv Austin, TX | 3.0 | 2.5 | 2344 | $3,750 | $1.60 | 1d | 1 | 1.40mi |
HOA detail
- Monthly dues
- $140 · $1,680/yr
Listing history 14 events
-
2026-06-18days on market $230,000 Active 19 DOM
-
2026-06-17days on market $230,000 Active 18 DOM
-
2026-06-16days on market $230,000 Active 17 DOM
-
2026-06-15days on market $230,000 Active 16 DOM
-
2026-06-13days on market $230,000 Active 14 DOM
-
2026-06-09days on market $230,000 Active 10 DOM
-
2026-06-08days on market $230,000 Active 9 DOM
-
2026-06-07days on market $230,000 Active 8 DOM
-
2026-06-04days on market $230,000 Active 5 DOM
-
2026-06-03days on market $230,000 Active 4 DOM
-
2026-06-02days on market $230,000 Active 3 DOM
-
2026-06-01days on market $230,000 Active 2 DOM
-
2026-05-31remarks 694-char remark
-
2026-05-31$230,000 Active 1 DOM
ⓘ Source: listings_history table (triggers on properties + properties_extension) + one-shot
backfill from property_details.listing_events for pre-trigger history.
Tax reassessment forecast TX · Resets to sale price
- Current annual tax
- $6,976 · $581/mo
- Projected year-2 tax
- $6,976 · $581/mo
- Expected delta
- $0/yr ($0/mo · 0.0%)
ⓘ Screening estimate from a state-policy table — verify with the county assessor before closing.
Climate risk First Street
- Flood 1/10 Low FEMA zone X (unshaded) · 0% chance over 30 yrs
- Wildfire 1/10 Low
- Heat 8/10 Severe 7 d/yr ≥107°F today · 21 d/yr by 30 yrs out
- Wind 6/10 Major 73% chance of damaging wind over 30 yrs
- Air quality 1/10 Low 0 unhealthy d/yr today · 0 by 30 yrs out
Nearby sold comps map
Loading sold comps map…
Walkable amenities ~0.75 mi
Loading nearby amenities…
Taxation est. · year 1
- Rental income
- $42,307
- − Mortgage interest
- −$12,884
- − Property taxes
- −$6,976
- − Insurance
- −$1,150
- − Repairs & maintenance
- −$3,385
- − Management
- −$3,385
- − HOA
- −$1,680
- − Depreciation
- −$6,691
- Taxable income
- $6,158
- Est. tax owed @ 24.0%
- −$1,478
- After-tax cash flow
- $7,665/yr
For passive investors: Depreciation is non-cash, so a rental often shows a tax loss while cash-flowing — sheltering income. Rental losses are passive: they offset passive income freely, and up to $25,000/yr can offset ordinary (W-2) income if you actively participate and your MAGI is under $100k (phasing out to $0 by $150k); unused losses carry forward. On sale, claimed depreciation is recaptured at up to 25%, and gains may owe capital-gains tax (a 1031 exchange can defer both). Figures are a year-1 estimate at your 24.0% rate — not tax advice; consult a CPA.
Schools (NCES district)
- District
- Lago Vista ISD
- NCES district ID
- 4826400
- Math proficiency
- 33% ▼ -24.00%
- Reading proficiency
- 51% ▼ -11.00%
- Median HH income
- $73,671
- Composite
- 38.35/100
- National rank
- #4216
- State rank
- #269 of 826 in TX
Livability — Point Venture
- Score
- 68/100
- State rank
- #509
- US rank
- #10087
Category grades
Schools grade is shown separately in the Schools card above.
Census & demographics
- Census place
- Point Venture, TX
- County
- Travis County · 1,299,254 people
- Metro
- Austin-Round Rock-Georgetown, TX
- Population (ZIP)
- 15,256
- Household income
- $113,008
- Rent vs Own
- Severe rent burden
- 20.0
Population outlook (Travis County) Hauer SSP2
- Today (2025)
- 1,545,133 people
- By 2030
- 1,729,269 · +11.9%
- By 2040
- 2,097,596 · +35.8%
- By 2050
- 2,463,890 · +59.5%
- By 2075
- 3,249,374 · +110.3%
- By 2100
- 3,801,868 · +146.1%
Race, ethnicity, and origin ACS 2023
- Neighborhood character
- Predominantly White (73%)
- Race & ethnicity
- White 73% Hispanic / Latino 19% Two or more races 11% Black 2%
- Hispanic origin (detail)
- Mexican 15%
- Common ancestry
- Italian 7% Slovak 4% Lithuanian 4%
- Foreign-born
- 10% · Canada
- Languages at home
- 85% English-only · Spanish 12% Other Indo-European 1% German/W. Germanic 1%
Political lean MEDSL · Travis
- 2024 margin
- Solid D (+39.3) · D 68.8% · R 29.4% · Other 1.8%
- 2008→2024 swing
- +9.9pp toward D · 2008: 29.4pp · 2024: 39.3pp
- All cycles
- 2024: D+39.3 2020: D+45.0 2016: D+38.9 2012: D+23.9 2008: D+29.4
Not yet ingested
- Civics
- —
Market trends
- HPI YoY
- ▼ -98.02%
- Current HPI
- 211.9678
- Rent YoY
- ▲ 2.98%
- Metro
- Austin-Round Rock-Georgetown, TX
- State GDP YoY
- ▲ 3.95%
- F500 in state
- 110
Industry mix (Fortune 500 HQ in TX)
| Industry | F500 HQs | Revenue |
|---|---|---|
| Energy | 16 | $1,198B |
|
||
| Technology | 5 | $198B |
|
||
| Engineering / Construction | 4 | $72B |
|
||
| Energy Services | 3 | $60B |
|
||
| Utilities | 3 | $41B |
|
||
| Healthcare | 2 | $330B |
|
||
Price history
+31.4% since first listed23 events — show timeline
- 2026-05-30 Listed $230,000 Unlock MLS
- 2025-03-28 Listed — Unlock MLS
- 2024-10-31 Listing Removed — LERA
- 2024-06-13 Listed $299,900 LERA
- 2024-06-13 Listed — Unlock MLS
- 2023-07-20 Sold (Public Records) — Public Records
- 2023-07-18 Sold (MLS) — LERA
- 2023-07-18 Sold (MLS) — Unlock MLS
- 2023-06-30 Contingent — Unlock MLS
- 2023-06-14 Price Changed $299,900 Unlock MLS
- 2023-05-25 Listed $299,900 LERA
- 2023-05-25 Listed $325,000 Unlock MLS
- 2010-10-29 Sold (Public Records) — Public Records
- 2010-10-28 Sold (MLS) — Unlock MLS
- 2010-10-07 Delisted — Unlock MLS
- 2010-07-27 Listed $159,000 Unlock MLS
- 2010-07-22 Listing Removed — LERA
- 2010-07-22 Delisted — Unlock MLS
- 2010-02-15 Listed $175,000 LERA
- 2010-02-15 Listed — Unlock MLS
- 2009-12-02 Sold (Public Records) — Public Records
- 1988-03-31 Sold (Public Records) — Public Records
- 1984-05-30 Sold (Public Records) — Public Records
Property tax history
+3.5%/yrLatest (2026): $6,976 · -12.0% YoY. Source: county tax records.
Cash-flow waterfall
monthlySold comps — $/sqft
last 12 mo · ≤1 miLoading sold comps…