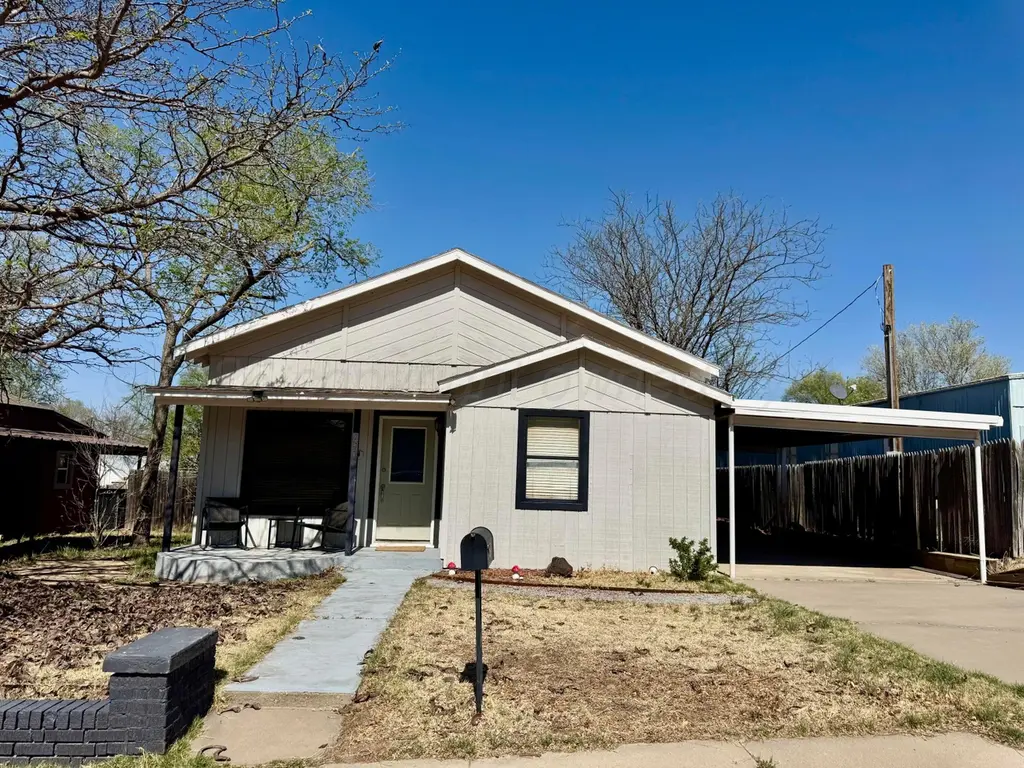
411 E Kingman Ave · Canadian, TX
Flood risk 1/10 · Minimal
- FEMA flood zone
- —
- Chance of flooding over 30 yrs
- 0.0%
- Est. flood insurance / yr
- —
Fire risk 9/10 · Severe
- Est. fire insurance / yr
- $1,222 – $2,270
Heat risk 6/10 · Moderate
- Hot days now (above 103°F)
- 7 days/yr
- Hot days in 30 yrs
- 20 days/yr
Wind risk 2/10 · Minimal
- Chance of severe wind over 30 yrs
- —
Air-quality risk 2/10 · Minimal
- Unhealthy air days now
- 0 days/yr
- Unhealthy air days in 30 yrs
- 1 days/yr
Risk factors via First Street. Map © Google.
Why this score? — see what drove the D grade
The composite is a weighted blend of 9 inputs, each scored 0–100. Each bar is that input's sub-score; the figure is the points it added to the 100-point composite (weight × sub-score).
- ARV discount +10.9/15.0
- Cash flow +8.2/30.0
- Appreciation +7.1/10.0
- Schools +4.0/10.0
- Livability +3.6/5.0
- 1% rule +2.6/10.0
- Rent growth +2.5/5.0
- Condition / age +2.5/5.0
- DSCR +2.2/10.0
$172,000
🖨 Deal sheet (PDF) 📄 Offer letter ✓ Due diligence
Listing remarks MLS
This home features original wood floors. There is a large opening between the living room and kitchen give an open feel. The kitchen is a good size and has lots of cabinet space. In addition, there is a large room on the second level that could be a den or a space suited to your needs. This upstairs room also has a balcony looking out over the backyard.
Key facts
- Built 1960
- Listed 83 days
Neighborhood map
What this means for you Summary
Snapshot
- This is a 4-bed/1.0-bath single-family listed at $172k.
Deal economics
- At list price, monthly cash flow is $-164 ($-2k/yr) — negative.
- To cash-flow at today's rent, offer at most $143k (16.8% below list).
- To meet the 1% rule (rent ≥ 1% of price), the offer needs to be $131k (24.1% below list).
- Recommended offer: $131k (24.1% below list) — sets the bar for 1% rule.
Location & tenants
- Location reads 71/100 on livability (#316 in TX) — a middle-class / working-renter tenant base. Strengths: cost of living A+, housing A+, crime A; Watch: amenities F, commute F, health & safety F.
- Canadian ISD (town): math 44% / reading 48% proficiency, ranked #229 of 826 in TX (top 28%) — families likely to look elsewhere, expect single-tenant / working-renter base with shorter leases.
- Zoned schools: Canadian El (204 students, 50% FRL); Canadian Middle (math 41% / reading 41%, grade F, #613 of 1,662 statewide, top 38%, 191 students, 47% FRL); Canadian H S (math 87% / reading 67%, grade A-, #60 of 1,632 statewide, top 4%, 297 students, 39% FRL).
- Zoned-school proficiency averages 59% at this address vs 46% district-wide (+13 pts) — the actual schools serving this property are materially stronger than the Canadian ISD average implies; a family-tenant draw the district grade alone would hide.
- Market conditions: 26 active listings in the ZIP.
Forward outlook
- In year one you build about $8k of equity ($1k loan paydown + $7k appreciation (4.2% local appreciation)).
- Hemphill County population projected at +62% by 2050 — long-run rental-demand tailwind backs the buy-and-hold thesis.
- By year 5, paydown + projected appreciation supports a ~$36k cash-out refi (75% LTV) — recoverable capital for the next deal without selling this one.
Negotiation context
- It's been on market 83 days — a 6% lower offer ($162k) is reasonable based on typical stale-listing flexibility.
- 3 sale attempts since 12y ago with the ask held roughly flat each time — persistent listings suggest the price (not the market) is what's stuck; bring a comps-based counter.
Risks & watch-outs
- Climate carrying-cost: severe wildfire risk; extreme-heat days projected 7→20/yr by 2055 (HVAC capex compounding) — expect insurance premiums to compound above CPI over the hold.
Questions for the listing agent
- What do current leases actually rent for vs. the listed asking? Can we see a recent rent roll and the last 12 months of T-12 income?
- It's been on market 83 days. Have you received any prior offers? Is the seller open to a 24% concession, seller financing, or rate buy-down credit?
- Built in 1960 — when were the roof, HVAC, electrical panel, plumbing, and water heater last replaced?
- Why hasn't it sold? Are there any deal-killer items the seller is aware of (foundation, flood, title, zoning, code violations)?
- Is there a deadline driving the sale (1031 exchange, divorce, estate, relocation)? That informs how much negotiation room exists.
- Schools are B-rated — typically a magnet for longer-tenancy family renters. What's the average tenant stay here, and is there a school-zone premium baked into asking?
- The area grade is low — what's the realistic commute time and amenity access for the typical tenant pool here? Any planned neighborhood developments (good or bad) we should know about?
- What's the average days-on-market for RENTAL listings here right now (not sales)? A rising rental-DOM trend means longer vacancies and softer asking-rent achievability than the comps imply.
- What's the recent tenant-quality profile in this submarket — average credit score on applications, eviction rate, late-payment / NSF rate, and stable-employment percentage? A property-management company in the area should have these aggregated.
- How much new for-sale + rental construction is in the pipeline within 1–3 miles? Heavy new supply typically softens prices + rents 12–24 months out; constrained supply supports both.
Investment metrics
- 1% rule
- 0.76% ✗
- Cap rate
- 5.15%
- Cash-on-cash
- -4.08%
- DSCR
- 0.82
- GRM
- 11.0
CMA / ARV
- ARV (median comp)
- $185,903
- List price
- $172,000
- Delta
- -7.48%
- Verdict
- FAIR
- Comps
- 1 within 2.0 mi
Projected returns pro-forma
4.18% appreciation · 3.0% rent growth · sell at horizon
- IRR
- 7.2%
- Equity multiple
- 1.44×
- Total profit
- $21,288
- Equity at exit
- $89,006
- IRR
- 9.5%
- Equity multiple
- 2.61×
- Total profit
- $77,580
- Equity at exit
- $147,030
Cash invested: $48,160 (down + closing). Projections, not guarantees.
Landlord ↔ Tenant lean methodology
- Overall (STATE)
- 87 Strongly Landlord-Friendly
- State Texas
- 87 Strongly Landlord-Friendly · R+5
- County
- — inherits STATE
- City
- — inherits STATE
ZIP-level market 79014
- Home prices YoY
- 3.8%
- Active inventory
- 26
- Price-to-rent
- 11.0×
Monthly cashflow live
- Estimated rent
- $1,306 medium interval (Pro) →
- Mortgage (P&I)
- −$902
- Tax from tax record
- −$222 /mo · $2,662/yr
- Insurance
- −$72
- HOA
- −$0
- Vacancy / Maint / Mgmt
- −$274
- Net cashflow
- $-164
Break-even live
Sensitivity live
| Price | -10% $-66 | -5% $-115 | +0% $-164 | +5% $-212 | +10% $-261 |
|---|---|---|---|---|---|
| Rent | -10% $-267 | -5% $-215 | +0% $-164 | +5% $-112 | +10% $-60 |
| Rate | -1.0pp $-77 | -0.5pp $-120 | base $-164 | +0.5pp $-208 | +1.0pp $-254 |
UW: 25.0% down · 7.5% · 30yr · 1.5% tax · 5.0% vac · 8.0% maint · 8.0% mgmt
Financing live
Cash to close
- Down payment
- $43,000
- Closing costs
- $5,160
- Reserves months
- —
- Total cash needed
- —
Loan-product check · same deal, 3 products live
Conventional
25% down · 7.5% · 30yr
- Down + closing
- —
- Monthly P&I
- —
- Monthly cashflow
- —
- DSCR
- —
- Eligible?
- —
Personal DTI + credit; lowest rate.
DSCR
20% down · 8.5% · 30yr
- Down + closing
- —
- Monthly P&I
- —
- Monthly cashflow
- —
- DSCR
- —
- Eligible?
- —
No personal income docs; deal must DSCR.
Hard money
10% down · 12.0% · 12mo
- Down + closing
- —
- Monthly P&I
- —
- Monthly cashflow
- —
- DSCR
- —
- Eligible?
- —
Short-term bridge; refi at stabilization.
Listing history 23 events
-
2026-06-21days on market $172,000 Active 83 DOM
-
2026-06-21days on market $172,000 Active 82 DOM
-
2026-06-18days on market $172,000 Active 80 DOM
-
2026-06-17days on market $172,000 Active 79 DOM
-
2026-06-16days on market $172,000 Active 78 DOM
-
2026-06-15days on market $172,000 Active 77 DOM
-
2026-06-13days on market $172,000 Active 75 DOM
-
2026-06-12days on market $172,000 Active 74 DOM
-
2026-06-09days on market $172,000 Active 71 DOM
-
2026-06-08days on market $172,000 Active 70 DOM
-
2026-06-08days on market $172,000 Active 69 DOM
-
2026-06-07days on market $172,000 Active 68 DOM
-
2026-06-03days on market $172,000 Active 65 DOM
-
2026-06-02days on market $172,000 Active 64 DOM
-
2026-06-01days on market $172,000 Active 63 DOM
-
2026-05-31days on market $172,000 Active 62 DOM
-
2026-03-30$172,000 Active 355-char remark
Show marketing remark (355 chars)
This home features original wood floors. There is a large opening between the living room and kitchen give an open feel. The kitchen is a good size and has lots of cabinet space. In addition, there is a large room on the second level that could be a den or a space suited to your needs. This upstairs room also has a balcony looking out over the backyard.
-
2015-02-27soldstatus 315-char remark
Show marketing remark (315 chars)
This home located on the brick streets of the original town just oozes charm. Has had baths and kitchen updated. Lovely wood floors. 4 or 5 bedrooms with 3 levels, dining and kitchen together, master bdrm on top floor has its own balcony. Sits on a deep lot. Convenient to all amenities of lovely downtown Canadian.
-
2015-02-27soldstatus
Show marketing remark (315 chars)
This home located on the brick streets of the original town just oozes charm. Has had baths and kitchen updated. Lovely wood floors. 4 or 5 bedrooms with 3 levels, dining and kitchen together, master bdrm on top floor has its own balcony. Sits on a deep lot. Convenient to all amenities of lovely downtown Canadian.
-
2015-01-26$85,900 315-char remark
Show marketing remark (315 chars)
This home located on the brick streets of the original town just oozes charm. Has had baths and kitchen updated. Lovely wood floors. 4 or 5 bedrooms with 3 levels, dining and kitchen together, master bdrm on top floor has its own balcony. Sits on a deep lot. Convenient to all amenities of lovely downtown Canadian.
-
2014-12-12$85,900
-
2007-01-12soldstatus
-
1998-08-17soldstatus
ⓘ Source: listings_history table (triggers on properties + properties_extension) + one-shot
backfill from property_details.listing_events for pre-trigger history.
Tax reassessment forecast TX · Resets to sale price
- Current annual tax
- $2,662 · $222/mo
- Projected year-2 tax
- $3,148 · $262/mo
- Expected delta
- +$486/yr (+$40/mo · 18.2%)
ⓘ Screening estimate from a state-policy table — verify with the county assessor before closing.
Climate risk First Street
- Flood 1/10 Low 0% chance over 30 yrs
- Wildfire 9/10 Extreme
- Heat 6/10 Major 7 d/yr ≥103°F today · 20 d/yr by 30 yrs out
- Wind 2/10 Low
- Air quality 2/10 Low 0 unhealthy d/yr today · 1 by 30 yrs out
Nearby sold comps map
Loading sold comps map…
Walkable amenities ~0.75 mi
Loading nearby amenities…
Taxation est. · year 1
- Rental income
- $15,674
- − Mortgage interest
- −$9,635
- − Property taxes
- −$2,662
- − Insurance
- −$860
- − Repairs & maintenance
- −$1,254
- − Management
- −$1,254
- − Depreciation
- −$5,004
- Taxable loss
- −$4,995
- Est. tax savings @ 24.0%
- +$1,199
- After-tax cash flow
- $-765/yr
For passive investors: Depreciation is non-cash, so a rental often shows a tax loss while cash-flowing — sheltering income. Rental losses are passive: they offset passive income freely, and up to $25,000/yr can offset ordinary (W-2) income if you actively participate and your MAGI is under $100k (phasing out to $0 by $150k); unused losses carry forward. On sale, claimed depreciation is recaptured at up to 25%, and gains may owe capital-gains tax (a 1031 exchange can defer both). Figures are a year-1 estimate at your 24.0% rate — not tax advice; consult a CPA.
Schools (NCES district)
- District
- Canadian ISD
- NCES district ID
- 4812700
- Math proficiency
- 44% ▼ -21.00%
- Reading proficiency
- 48% ▼ -10.00%
- Median HH income
- $58,018
- Composite
- 40.23/100
- National rank
- #3776
- State rank
- #229 of 826 in TX
Livability — Canadian
- Score
- 71/100
- State rank
- #316
- US rank
- #7053
Category grades
Schools grade is shown separately in the Schools card above.
Census & demographics
- Census place
- Canadian, TX
- Population (ZIP)
- 3,252
Population outlook (Hemphill County) Hauer SSP2
- Today (2025)
- 5,290 people
- By 2030
- 5,848 · +10.5%
- By 2040
- 7,117 · +34.5%
- By 2050
- 8,567 · +61.9%
- By 2075
- 12,560 · +137.4%
- By 2100
- 15,571 · +194.3%
Race, ethnicity, and origin ACS 2023
- Neighborhood character
- Majority White (63%)
- Race & ethnicity
- White 63% Hispanic / Latino 34% Two or more races 11%
- Hispanic origin (detail)
- Mexican 33%
- Common ancestry
- Slovak 3% Serbian 1% Iranian 1%
- Foreign-born
- 15% · Canada
- Languages at home
- 69% English-only · Spanish 31%
Political lean MEDSL · Hemphill
- 2024 margin
- Solid R (+75.8) · D 11.8% · R 87.6%
- 2008→2024 swing
- -3.9pp toward R · 2008: -71.9pp · 2024: -75.8pp
- All cycles
- 2024: R+75.8 2020: R+74.4 2016: R+75.8 2012: R+73.3 2008: R+71.9
Not yet ingested
- Civics
- —
Market trends
- HPI YoY
- ▲ 4.18%
- Current HPI
- 114.0348
- Rent YoY
- —
- Metro
- —
- State GDP YoY
- ▲ 3.95%
- F500 in state
- 110
Industry mix (Fortune 500 HQ in TX)
| Industry | F500 HQs | Revenue |
|---|---|---|
| Energy | 16 | $1,198B |
|
||
| Technology | 5 | $198B |
|
||
| Engineering / Construction | 4 | $72B |
|
||
| Energy Services | 3 | $60B |
|
||
| Utilities | 3 | $41B |
|
||
| Healthcare | 2 | $330B |
|
||
Price history
+100.2% since first listed7 events — show timeline
- 2026-03-30 Listed $172,000 AARMLS
- 2015-02-27 Sold (MLS) — PBOR
- 2015-02-27 Sold (MLS) — AARMLS
- 2015-01-26 Listed $85,900 AARMLS
- 2014-12-12 Listed $85,900 PBOR
- 2007-01-12 Sold (Public Records) — Public Records
- 1998-08-17 Sold (Public Records) — Public Records
Property tax history
+1.6%/yrLatest (2025): $2,662 · -0.3% YoY. Source: county tax records.
Cash-flow waterfall
monthlySold comps — $/sqft
last 12 mo · ≤1 miLoading sold comps…