 Duplex
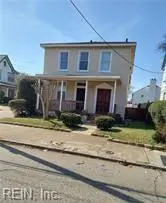
301 Washington St · Hampton, VA
Flood risk 9/10 · Severe
- FEMA flood zone
- AE
- Chance of flooding over 30 yrs
- 0.99%
- Est. flood insurance / yr
- $2,026 – $9,024
Fire risk 1/10 · Minimal
- Est. fire insurance / yr
- $666 – $1,236
Heat risk 9/10 · Severe
- Hot days now (above 104°F)
- 7 days/yr
- Hot days in 30 yrs
- 16 days/yr
Wind risk 8/10 · Major
- Chance of severe wind over 30 yrs
- 80.0%
Air-quality risk 2/10 · Minimal
- Unhealthy air days now
- 2 days/yr
- Unhealthy air days in 30 yrs
- 2 days/yr
Risk factors via First Street. Map © Google.
Why this score? — see what drove the B+ grade
The composite is a weighted blend of 9 inputs, each scored 0–100. Each bar is that input's sub-score; the figure is the points it added to the 100-point composite (weight × sub-score).
- Cash flow +30.0/30.0
- ARV discount +15.0/15.0
- DSCR +10.0/10.0
- 1% rule +8.5/10.0
- Schools +5.5/10.0
- Rent growth +3.9/5.0
- Livability +3.8/5.0
- Condition / age +2.5/5.0
- Appreciation +0.0/10.0
$259,900
🖨 Deal sheet 📄 Offer letter ✓ Due diligence
Multi-family units
County records classify this as Multi-Family (2-4 Unit). Listing-text estimate: 2 units. confirmed
Listing remarks MLS
DON'T MISS THE OPPORTUNITY TO LIVE AND/OR INVEST IN THE HISTORICAL AREA OF DOWNTOWN. INCOME PRODUCING IN HAMPTON. THIS MASSIVE DUPLEX HAS OVER 2400 SQUARE FEET AND 2 CAR OFF STREET PARKING. THIS CORNER LOT HOME WITH A LITTLE LOVE AND CARE COULD BE INCOME PRODUCING AND A HUMBLE ABODE.
Key facts
- 4,230 sq ft lot
- Built 1892
- Listed 96 days
Neighborhood map
What this means for you Summary
Snapshot
- This is a 2 × 2-bed/1.0-bath units multifamily listed at $260k.
Deal economics
- At list price, monthly cash flow is $633 ($8k/yr) — positive. Per door: $317/mo.
- The deal already cash-flows at list — no discount required.
- Meets the 1% rule at list price ($4k rent vs $260k).
- Recommended offer: $237k (9.0% below list) — sets the bar for market timing.
- Cap rate 11.3% vs local median 4.5% in Hampton — top-decile yield for the area; either an underpriced asset or a hidden risk that comps aren't pricing in. Stress-test before assuming the spread holds.
Location & tenants
- Location reads 75/100 on livability (#133 in VA, #4,302 nationally) — a middle-class / working-renter tenant base. Strengths: housing A+, health & safety A+, cost of living A; Watch: crime C-, amenities D+, commute F.
- Hampton City Public School District (urban): math 60% / reading 70% proficiency, ranked #40 of 131 in VA (top 30%) — acceptable for families but not a draw, mixed tenant base, ~2y average lease.
- Market conditions: Rents rising fast (+5.4%/yr); 232 active listings in the ZIP; 7 comparable units currently listed for rent nearby; rentals lingering (median 44d on market — plan ~5-8 weeks vacancy on turnover, expect pricing pressure); 57% of comp listings sitting > 30 days — soft ceiling on asking rent; 68 units permitted in Hampton city in 2024 (0 in 5+ unit buildings).
- At $3,516/mo this rent would consume 59% of the median local household income ($71k/yr) (locally 2130% of renters already pay >50% of income on rent) — very limited rent-growth headroom before tenants either downsize or default.
Forward outlook
- Local home prices are declining (-3.0%/yr); year-one equity from $2k of loan paydown is wiped out by about $8k of value loss. Plan a longer hold.
- Hampton County population projected at -13% by 2050 — secular population decline; favor cash flow + early exit over multi-decade hold.
- At projected returns (-3.0% appreciation + 5.4% rent growth), your $73k cash investment doubles in ~8 years — after that, you're playing with house money.
Negotiation context
- It's been on market 96 days — a 9% lower offer ($237k) is reasonable based on typical stale-listing flexibility.
- Current owner paid $182k; 43% above their basis — modest negotiation headroom, anchor on the comps not their cost.
Risks & watch-outs
- Watch-outs: flood insurance adds $460/mo; built in 1892 — expect roof / HVAC / electrical / plumbing capex.
- Climate carrying-cost: in FEMA flood zone AE (mandatory federal flood insurance); severe wind risk, 80% chance of damaging wind over 30y; extreme-heat days projected 7→16/yr by 2055 (HVAC capex compounding) — expect insurance premiums to compound above CPI over the hold.
Questions for the listing agent
- It's been on market 96 days. Have you received any prior offers? Is the seller open to a 9% concession, seller financing, or rate buy-down credit?
- Can we see the unit-by-unit rent roll, current vacancy, and any below-market leases? What's the average tenancy length?
- What capital expenditures (roof, boiler, parking lot, exteriors) have been made in the last 5 years, and what's planned in the next 2?
- Built in 1892 — when were the roof, HVAC, electrical panel, plumbing, and water heater last replaced?
- What's the actual annual flood-insurance premium (NFIP or private), and is the property in a SFHA with mandatory coverage?
- Why hasn't it sold? Are there any deal-killer items the seller is aware of (foundation, flood, title, zoning, code violations)?
- Is there a deadline driving the sale (1031 exchange, divorce, estate, relocation)? That informs how much negotiation room exists.
- Schools are B-rated — typically a magnet for longer-tenancy family renters. What's the average tenant stay here, and is there a school-zone premium baked into asking?
- What's the average days-on-market for RENTAL listings here right now (not sales)? A rising rental-DOM trend means longer vacancies and softer asking-rent achievability than the comps imply.
- What's the recent tenant-quality profile in this submarket — average credit score on applications, eviction rate, late-payment / NSF rate, and stable-employment percentage? A property-management company in the area should have these aggregated.
- How much new apartment / multifamily construction is in the pipeline within 1–3 miles? Heavy new supply (>2% of stock underway) typically softens rents 12–24 months out; light construction supports rent growth.
Investment metrics
- 1% rule
- 1.35% ✓
- Cap rate
- 11.34%
- Cash-on-cash
- 18.03%
- DSCR
- 1.80
- GRM
- 6.2
CMA / ARV
- ARV (median comp)
- $375,822
- List price
- $259,900
- Delta
- -30.84%
- Verdict
- UNDERPRICED
- Comps
- 4 within 2.0 mi
Projected returns pro-forma
-3.0% appreciation · 5.44% rent growth · sell at horizon
- IRR
- 2.5%
- Equity multiple
- 1.10×
- Total profit
- $7,316
- Equity at exit
- $38,752
- IRR
- 14.7%
- Equity multiple
- 2.34×
- Total profit
- $97,521
- Equity at exit
- $22,471
Cash invested: $72,772 (down + closing). Projections, not guarantees.
Landlord ↔ Tenant lean methodology
- Overall (STATE)
- 55 Moderately Landlord-Leaning
- State Virginia
- 55 Moderately Landlord-Leaning · D+2
- County
- — inherits STATE
- City
- — inherits STATE
ZIP-level market 23669
- Rents YoY
- 5.4%
- Active inventory
- 232
- Price-to-rent
- 12.3×
Monthly cashflow live
- Estimated rent
- $3,516 high interval (Pro) →
- Mortgage (P&I)
- −$1,363
- Tax from tax record
- −$213 /mo · $2,555/yr
- Insurance
- −$108
- Flood insurance flood zone
- −$460 /mo · $5,525/yr
- HOA
- −$0
- Vacancy / Maint / Mgmt
- −$738
- Net cashflow
- $633
Break-even live
2-unit breakdown (identical units grouped — click to expand)
| Units | Beds | Baths | Est. rent |
|---|---|---|---|
| 2× units | 2 | 1 | $3,516 |
| #1 | 2 | 1 | $1,758 |
| #2 | 2 | 1 | $1,758 |
| Total (2 units) | $3,516 | ||
UW: 25.0% down · 7.5% · 30yr · 1.5% tax · 5.0% vac · 8.0% maint · 8.0% mgmt
Financing live
Cash to close
- Down payment
- $64,975
- Closing costs
- $7,797
- Reserves months
- —
- Total cash needed
- —
Loan-product check · same deal, 3 products live
Conventional
25% down · 7.5% · 30yr
- Down + closing
- —
- Monthly P&I
- —
- Monthly cashflow
- —
- DSCR
- —
- Eligible?
- —
Personal DTI + credit; lowest rate.
DSCR
20% down · 8.5% · 30yr
- Down + closing
- —
- Monthly P&I
- —
- Monthly cashflow
- —
- DSCR
- —
- Eligible?
- —
No personal income docs; deal must DSCR.
Hard money
10% down · 12.0% · 12mo
- Down + closing
- —
- Monthly P&I
- —
- Monthly cashflow
- —
- DSCR
- —
- Eligible?
- —
Short-term bridge; refi at stabilization.
Rent comps 7 comps
| Address | Beds | Baths | Sqft | Rent | $/sqft | DOM | Units | Dist |
|---|---|---|---|---|---|---|---|---|
| 606 Washington St Hampton, VA | 3.0 | 2.5 | 2370 | $2,600 | $1.10 | 21d | 1 | 0.24mi |
| 709 E Pembroke Ave Unit B Hampton, VA | 2.0 | 1.5 | 1664 | $1,349 | $0.81 | 23d | 1 | 0.58mi |
| 4407 Victoria Blvd Hampton, VA | 3.0 | 4.0 | 2400 | $2,400 | $1.00 | 14d | 1 | 0.71mi |
| 27 Capps Qtrs #1 Hampton, VA | 3.0 | 2.5 | 1734 | $2,200 | $1.27 | 43d | 1 | 0.87mi |
| 703 N Back River Rd Hampton, VA | 3.0 | 2.5 | 2062 | $2,475 | $1.20 | 43d | 1 | 0.93mi |
| 5 Lacrosse St Hampton, VA | 3.0 | 2.5 | 1612 | $2,500 | $1.55 | 43d | 1 | 1.26mi |
| 23 Regal Way Hampton, VA | 3.0 | 2.5 | 2482 | $2,900 | $1.17 | 43d | 1 | 1.35mi |
Listing history 9 events
-
2026-06-08statusdays on market $259,900 Under Contract 96 DOM
-
2026-06-07days on market $259,900 Active 95 DOM
-
2026-06-03days on market $259,900 Active 91 DOM
-
2026-06-02days on market $259,900 Active 90 DOM
-
2026-06-01days on market $259,900 Active 89 DOM
-
2026-05-31days on market $259,900 Active 88 DOM
-
2026-03-04$259,900 Active 286-char remark
Show marketing remark (286 chars)
DON'T MISS THE OPPORTUNITY TO LIVE AND/OR INVEST IN THE HISTORICAL AREA OF DOWNTOWN. INCOME PRODUCING IN HAMPTON. THIS MASSIVE DUPLEX HAS OVER 2400 SQUARE FEET AND 2 CAR OFF STREET PARKING. THIS CORNER LOT HOME WITH A LITTLE LOVE AND CARE COULD BE INCOME PRODUCING AND A HUMBLE ABODE.
-
2007-09-28soldstatus $182,000
-
1994-02-01soldstatus $52,000
ⓘ Source: listings_history table (triggers on properties + properties_extension) + one-shot
backfill from property_details.listing_events for pre-trigger history.
Tax reassessment forecast VA · Resets to sale price
- Current annual tax
- $2,555 · $213/mo
- Projected year-2 tax
- $2,555 · $213/mo
- Expected delta
- $0/yr ($0/mo · 0.0%)
ⓘ Screening estimate from a state-policy table — verify with the county assessor before closing.
Climate risk First Street
- Flood 9/10 Extreme FEMA zone AE · 99% chance over 30 yrs
- Wildfire 1/10 Low
- Heat 9/10 Extreme 7 d/yr ≥104°F today · 16 d/yr by 30 yrs out
- Wind 8/10 Severe 80% chance of damaging wind over 30 yrs
- Air quality 2/10 Low 2 unhealthy d/yr today · 2 by 30 yrs out
Nearby sold comps map
Loading sold comps map…
Walkable amenities ~0.75 mi
Loading nearby amenities…
Taxation est. · year 1
- Rental income
- $42,192
- − Mortgage interest
- −$14,558
- − Property taxes
- −$2,555
- − Insurance
- −$6,824
- − Repairs & maintenance
- −$3,375
- − Management
- −$3,375
- − Depreciation
- −$7,561
- Taxable income
- $3,943
- Est. tax owed @ 24.0%
- −$946
- After-tax cash flow
- $6,651/yr
For passive investors: Depreciation is non-cash, so a rental often shows a tax loss while cash-flowing — sheltering income. Rental losses are passive: they offset passive income freely, and up to $25,000/yr can offset ordinary (W-2) income if you actively participate and your MAGI is under $100k (phasing out to $0 by $150k); unused losses carry forward. On sale, claimed depreciation is recaptured at up to 25%, and gains may owe capital-gains tax (a 1031 exchange can defer both). Figures are a year-1 estimate at your 24.0% rate — not tax advice; consult a CPA.
Schools (NCES district)
- District
- Hampton City Public School District
- NCES district ID
- 5101800
- Math proficiency
- 60% ▼ -21.00%
- Reading proficiency
- 70% ▼ -4.00%
- Median HH income
- $50,089
- Composite
- 55.19/100
- National rank
- #1272
- State rank
- #40 of 131 in VA
Livability — Hampton
- Score
- 75/100
- State rank
- #133
- US rank
- #4302
Category grades
Schools grade is shown separately in the Schools card above.
Census & demographics
- Census place
- Hampton, VA
- County
- Hampton City · 132,421 people
- City population
- 132,421
- Metro
- Virginia Beach-Norfolk-Newport News, VA-NC
- Population (ZIP)
- 39,884
- Household income
- $71,222
- Rent vs Own
- Severe rent burden
- 2130.0
Population outlook (Hampton County) Hauer SSP2
- Today (2025)
- 134,055 people
- By 2030
- 131,753 · -1.7%
- By 2040
- 125,017 · -6.7%
- By 2050
- 116,825 · -12.9%
- By 2075
- 97,033 · -27.6%
- By 2100
- 76,188 · -43.2%
Race, ethnicity, and origin ACS 2023
- Neighborhood character
- Diverse neighborhood (Simpson 0.63)
- Race & ethnicity
- Black 46% White 39% Two or more races 9% Hispanic / Latino 6% Asian 2%
- Hispanic origin (detail)
- Mexican 1% Puerto Rican 2%
- Common ancestry
- Slovak 2% Italian 1% Romanian 1%
- Foreign-born
- 4% · Canada
- Languages at home
- 95% English-only · Spanish 3% Other Asian/Pacific 1%
Political lean MEDSL · Hampton
- 2024 margin
- Solid D (+39.9) · D 69.2% · R 29.4% · Other 1.4%
- 2008→2024 swing
- +1.0pp no change · 2008: 38.9pp · 2024: 39.9pp
- All cycles
- 2024: D+39.9 2020: D+42.2 2016: D+37.8 2012: D+45.4 2008: D+38.9
Not yet ingested
- Civics
- —
Market trends
- HPI YoY
- ▼ -150.40%
- Current HPI
- 276.4636
- Rent YoY
- ▲ 5.44%
- Metro
- Virginia Beach-Norfolk-Newport News, VA-NC
- State GDP YoY
- ▲ 2.40%
- F500 in state
- 50
Industry mix (Fortune 500 HQ in VA)
| Industry | F500 HQs | Revenue |
|---|---|---|
| Aerospace / Defense | 4 | $236B |
|
||
| Technology / Defense | 3 | $32B |
|
||
| Financial Services | 2 | $176B |
|
||
| Utilities | 2 | $27B |
|
||
| Insurance | 2 | $25B |
|
||
| Technology | 2 | $15B |
|
||
Price history
+399.8% since first listed3 events — show timeline
- 2026-03-04 Listed $259,900 REINMLS
- 2007-09-28 Sold (Public Records) $182,000 Public Records
- 1994-02-01 Sold (Public Records) $52,000 Public Records
Property tax history
+7.7%/yrLatest (2025): $2,555 · -0.3% YoY. Source: county tax records.
Cash-flow waterfall
monthlySold comps — $/sqft
last 12 mo · ≤1 miLoading sold comps…