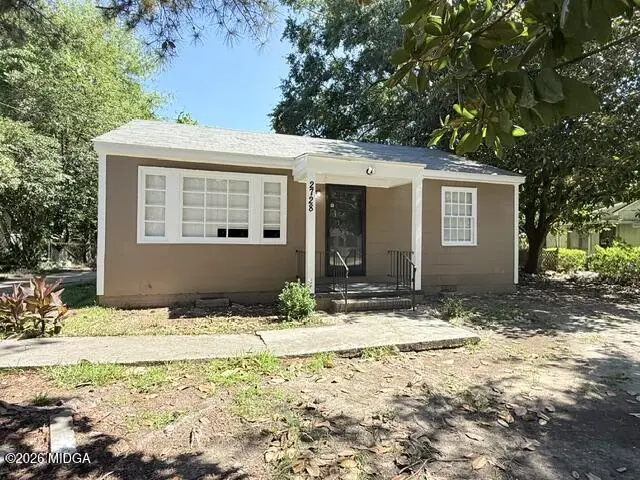
2728 Alden St · Macon-Bibb County, GA
Flood risk 1/10 · Minimal
- FEMA flood zone
- X (unshaded)
- Chance of flooding over 30 yrs
- 0.0%
- Est. flood insurance / yr
- $507 – $1,088
Fire risk 3/10 · Minor
- Est. fire insurance / yr
- $963 – $1,789
Heat risk 7/10 · Major
- Hot days now (above 109°F)
- 7 days/yr
- Hot days in 30 yrs
- 18 days/yr
Wind risk 6/10 · Moderate
- Chance of severe wind over 30 yrs
- 72.0%
Air-quality risk 3/10 · Minor
- Unhealthy air days now
- 3 days/yr
- Unhealthy air days in 30 yrs
- 4 days/yr
Risk factors via First Street. Map © Google.
Why this score? — see what drove the D grade
The composite is a weighted blend of 9 inputs, each scored 0–100. Each bar is that input's sub-score; the figure is the points it added to the 100-point composite (weight × sub-score).
- Cash flow +18.0/30.0
- ARV discount +7.5/15.0
- DSCR +5.7/10.0
- Rent growth +3.8/5.0
- 1% rule +3.6/10.0
- Livability +2.5/5.0
- Condition / age +2.5/5.0
- Schools +1.2/10.0
- Appreciation +0.0/10.0
$129,900
🖨 Deal sheet 📄 Offer letter ✓ Due diligence
Listing remarks MLS
Investor's Special in need of some TLC. Looking for a Fixer Upper to turn into a comfortable home for a First Time Buyer or just a home Owner. Come and see what this property has to offer.
Key facts
- 0.34 acre lot
- Built 1951
- Listed 11 days
Tags
Property features AI
Exterior
- Parking: Driveway
- Utilities: Public water; Public sewer; Electricity available; Natural gas available; Cable available; Phone available; Water available; Sewer available
- Home design: Single-family residence; One story; Fixer condition; No shared/common walls
- Construction: Frame and other construction materials; Block foundation; Shingle roof; Built on one level
- Exterior features: Private yard; Street lights in the community; TV antenna and satellite dish
Interior
- Flooring: Hardwood
- Bathrooms: 1 full bathroom; 1 half bathroom
- Heating & cooling: Hot water heating (natural gas); Ceiling fans; Has cooling
- Interior features: Hardwood floors; Crawl space basement; 5 total rooms
- Laundry & utility: Laundry located in the kitchen
Neighborhood map
What this means for you Summary
Snapshot
- This is a 2-bed/1.0-bath single-family listed at $130k.
Deal economics
- At list price, monthly cash flow is $113 ($1k/yr) — positive.
- The deal already cash-flows at list — no discount required.
- To meet the 1% rule (rent ≥ 1% of price), the offer needs to be $112k (13.8% below list).
- Recommended offer: $112k (13.8% below list) — sets the bar for 1% rule.
- Cap rate 7.3% vs local median 5.4% in Macon-Bibb County — top-decile yield for the area; either an underpriced asset or a hidden risk that comps aren't pricing in. Stress-test before assuming the spread holds.
Location & tenants
- Location reads: area grade D — affects rentability + tenant quality, not the cash-flow math above.
- Bibb County (urban): math 11% / reading 18% proficiency, ranked #161 of 174 in GA (top 92%) — low school quality limits family demand, transient renter base, plan for 1-2y turnover; 75% free/reduced lunch — lower-income household profile, screen leases tightly.
- Zoned schools: Veterans Elementary School (math 3% / reading 9%, grade F, #1,154 of 1,228 statewide, top 94%, 697 students, 100% FRL); Ballard Hudson Middle School (math 4% / reading 9%, grade F, #457 of 470 statewide, top 98%, 744 students, 100% FRL); Southwest High School (math 2% / reading 17%, grade F, #365 of 424 statewide, top 88%, 800 students, 100% FRL) — zoned schools average 100% FRL vs 75% district-wide (25 pts higher); higher-poverty schools than district average — tighter screening recommended.
- Market conditions: Rents rising fast (+5.0%/yr); 207 active listings in the ZIP; 22 comparable units currently listed for rent nearby; rentals lingering (median 44d on market — plan ~5-8 weeks vacancy on turnover, expect pricing pressure); 64% of comp listings sitting > 30 days — soft ceiling on asking rent; lower-income renter base — watch delinquency; 154 units permitted in Bibb County in 2024 (0 in 5+ unit buildings).
- This rent runs 45% of the median local income ($30k/yr) — at the standard rent-burdened threshold; future hikes will face affordability resistance.
Forward outlook
- Local home prices are declining (-3.0%/yr); year-one equity from $898 of loan paydown is wiped out by about $4k of value loss. Plan a longer hold.
- Bibb County population projected at -12% by 2050 — secular population decline; favor cash flow + early exit over multi-decade hold.
Negotiation context
- Only 11 days on market — expect competitive offers; lowballing is unlikely to land.
- 3 sale attempts since 4y ago with the ask held roughly flat each time — persistent listings suggest the price (not the market) is what's stuck; bring a comps-based counter.
- Current owner paid $36k; list at $130k implies a 261% gain — meaningful room to come down on a strong offer.
Risks & watch-outs
- Watch-outs: built in 1951 — expect roof / HVAC / electrical / plumbing capex.
- Climate carrying-cost: major wind risk, 72% chance of damaging wind over 30y; extreme-heat days projected 7→18/yr by 2055 (HVAC capex compounding) — expect insurance premiums to compound above CPI over the hold.
Questions for the listing agent
- Built in 1951 — when were the roof, HVAC, electrical panel, plumbing, and water heater last replaced?
- Is there a deadline driving the sale (1031 exchange, divorce, estate, relocation)? That informs how much negotiation room exists.
- The area grade is low — what's the realistic commute time and amenity access for the typical tenant pool here? Any planned neighborhood developments (good or bad) we should know about?
- What's the average days-on-market for RENTAL listings here right now (not sales)? A rising rental-DOM trend means longer vacancies and softer asking-rent achievability than the comps imply.
- What's the recent tenant-quality profile in this submarket — average credit score on applications, eviction rate, late-payment / NSF rate, and stable-employment percentage? A property-management company in the area should have these aggregated.
- How much new for-sale + rental construction is in the pipeline within 1–3 miles? Heavy new supply typically softens prices + rents 12–24 months out; constrained supply supports both.
Investment metrics
- 1% rule
- 0.86% ✗
- Cap rate
- 7.34%
- Cash-on-cash
- 3.72%
- DSCR
- 1.17
- GRM
- 9.7
CMA / ARV
- ARV (on-the-fly)
- $79,424
- Comps found
- 12
Show comp detail 12 sales within ~0.75 mi
| Address | Dist | Beds/Ba | Sqft | Sold | Price | $/sf | Match |
|---|---|---|---|---|---|---|---|
| 2545 Greenwood Ter | 0.34mi | 3/2.0 (+1) | 1,212 (+4%) | 3mo | $125,000 | $103 | 66 |
| 3913 Blair Ct | 0.50mi | 3/1.0 (+1) | 1,110 (-5%) | 3mo | $113,000 | $102 | 61 |
| 5780 Edwina Dr | 0.53mi | 3/1.0 (+1) | 1,200 (+3%) | 6mo | $125,000 | $104 | 60 |
| 2715 Barrett Ave | 0.09mi | 3/2.0 (+1) | 1,322 (+13%) | 8mo | $6,200 | $5 | 58 |
| 2704 Reynolds Dr | 0.29mi | 3/1.0 (+1) | 1,036 (-11%) | 7mo | $70,000 | $68 | 57 |
| 2422 Adger Rd | 0.74mi | 3/1.0 (+1) | 1,104 (-6%) | 3mo | $125,000 | $113 | 48 |
| 2738 Village Green Ln | 0.68mi | 3/1.0 (+1) | 1,056 (-10%) | 1mo | $35,000 | $33 | 46 |
| 2665 Chatsworth Ct | 0.59mi | 3/1.5 (+1) | 1,056 (-10%) | 4mo | $50,000 | $47 | 46 |
| 5756 Edwina Dr | 0.49mi | 3/1.5 (+1) | 1,000 (-14%) | 5mo | $132,000 | $132 | 42 |
| 5897 Leone Dr W | 0.72mi | 3/1.5 (+1) | 1,055 (-10%) | 4mo | $35,000 | $33 | 40 |
| 2844 Shamrock Ln | 0.65mi | 3/1.0 (+1) | 1,000 (-14%) | 2mo | $47,000 | $47 | 38 |
| 5885 Leone Dr W | 0.70mi | 3/1.0 (+1) | 1,000 (-14%) | 4mo | $35,000 | $35 | 35 |
Match score weights: distance 35% · size 25% · config 20% · recency 20%. Top-matched comps best support the ARV.
Projected returns pro-forma
-3.0% appreciation · 5.03% rent growth · sell at horizon
- IRR
- -8.5%
- Equity multiple
- 0.68×
- Total profit
- $-11,589
- Equity at exit
- $19,369
- IRR
- 3.1%
- Equity multiple
- 1.24×
- Total profit
- $8,900
- Equity at exit
- $11,231
Cash invested: $36,372 (down + closing). Projections, not guarantees.
Landlord ↔ Tenant lean methodology
- Overall (STATE)
- 90 Strongly Landlord-Friendly
- State Georgia
- 90 Strongly Landlord-Friendly · R+3
- County
- — inherits STATE
- City
- — inherits STATE
ZIP-level market 31206
- Rents YoY
- 5.0%
- Active inventory
- 207
- Price-to-rent
- 9.7×
Monthly cashflow live
- Estimated rent
- $1,120 high interval (Pro) →
- Mortgage (P&I)
- −$681
- Tax from tax record
- −$37 /mo · $438/yr
- Insurance
- −$54
- HOA
- −$0
- Vacancy / Maint / Mgmt
- −$235
- Net cashflow
- $113
Break-even live
UW: 25.0% down · 7.5% · 30yr · 1.5% tax · 5.0% vac · 8.0% maint · 8.0% mgmt
Financing live
Cash to close
- Down payment
- $32,475
- Closing costs
- $3,897
- Reserves months
- —
- Total cash needed
- —
Loan-product check · same deal, 3 products live
Conventional
25% down · 7.5% · 30yr
- Down + closing
- —
- Monthly P&I
- —
- Monthly cashflow
- —
- DSCR
- —
- Eligible?
- —
Personal DTI + credit; lowest rate.
DSCR
20% down · 8.5% · 30yr
- Down + closing
- —
- Monthly P&I
- —
- Monthly cashflow
- —
- DSCR
- —
- Eligible?
- —
No personal income docs; deal must DSCR.
Hard money
10% down · 12.0% · 12mo
- Down + closing
- —
- Monthly P&I
- —
- Monthly cashflow
- —
- DSCR
- —
- Eligible?
- —
Short-term bridge; refi at stabilization.
Rent comps 22 comps
| Address | Beds | Baths | Sqft | Rent | $/sqft | DOM | Units | Dist |
|---|---|---|---|---|---|---|---|---|
| 5487 Bloomfield Rd Macon, GA | 3.0 | 2.0 | 1050 | $1,200 | $1.14 | 21d | 1 | 0.15mi |
| 5711 Sterling Pl Macon, GA | 3.0 | 1.0 | 864 | $1,500 | $1.74 | 21d | 1 | 0.41mi |
| 5708 Edwina Dr Macon, GA | 3.0 | 1.0 | 925 | $1,275 | $1.38 | 43d | 1 | 0.42mi |
| 4069 Blair Ct Macon, GA | 3.0 | 1.0 | 864 | $850 | $0.98 | 43d | 1 | 0.49mi |
| 2961 Deeb Dr Macon, GA | 3.0 | 1.0 | 1000 | $1,000 | $1.00 | 43d | 1 | 0.51mi |
| 5771 Satterfield Dr Macon, GA | 3.0 | 1.0 | 888 | $1,250 | $1.41 | 43d | 1 | 0.52mi |
| 2641 Leone Dr N Macon, GA | 3.0 | 1.0 | 864 | $1,100 | $1.27 | 43d | 1 | 0.57mi |
| 5161 Nisbet Dr Macon, GA | 2.0 | 1.5 | 1040 | $975 | $0.94 | 43d | 1 | 0.58mi |
| 2916 Walmar Dr Macon, GA | 3.0 | 2.0 | 1300 | $1,275 | $0.98 | 43d | 1 | 0.60mi |
| 2665 Chatsworth Ct Macon, GA | 3.0 | 1.5 | 1056 | $1,175 | $1.11 | 43d | 1 | 0.62mi |
| 4331 Ashland Dr Macon, GA | 3.0 | 1.0 | 864 | $1,025 | $1.19 | 43d | 1 | 0.62mi |
| 2459 Vivian Dr Macon, GA | 3.0 | 1.0 | 792 | $850 | $1.07 | 13d | 1 | 0.63mi |
| 4386 Thrasher Cir Macon, GA | 3.0 | 2.0 | 1120 | $1,400 | $1.25 | 43d | 1 | 0.69mi |
| 2477 Thrasher Ave Macon, GA | 3.0 | 1.0 | 960 | $825 | $0.86 | 13d | 1 | 0.69mi |
| 2423 Thrasher Ave Macon, GA | 3.0 | 1.0 | 1056 | $725 | $0.69 | 43d | 1 | 0.79mi |
| 4995 Bloomfield Rd Macon, GA | 2.0 | 1.5 | 900 | $997 | $1.11 | 21d | 1 | 0.88mi |
| 4455 Fairfax Dr Macon, GA | 3.0 | 2.0 | 1352 | $1,225 | $0.91 | 43d | 1 | 1.04mi |
| 4685 Pinedale Dr Macon, GA | 3.0 | 1.5 | 1404 | $1,450 | $1.03 | 13d | 1 | 1.06mi |
| 4406 Chambers Rd Apt E16 Macon, GA | 2.0 | 1.0 | 925 | $899 | $0.97 | 21d | 1 | 1.11mi |
| 4406 Chambers Rd Unit B-06 Macon, GA | 2.0 | 1.0 | 925 | $899 | $0.97 | 43d | 1 | 1.11mi |
| 1000 Crystal Lake Cir Macon, GA | 3.0 | 2.0 | 1312 | $1,063 | $0.81 | 43d | 1 | 1.18mi |
| 3257 Ohara Dr S Macon, GA | 3.0 | 1.0 | 1352 | $1,125 | $0.83 | 21d | 1 | 1.35mi |
Listing history 9 events
-
2026-06-19days on market $129,900 Active 11 DOM
-
2026-06-18days on market $129,900 Active 10 DOM
-
2026-06-17days on market $129,900 Active 9 DOM
-
2026-06-16days on market $129,900 Active 8 DOM
-
2026-06-15days on market $129,900 Active 7 DOM
-
2026-06-14days on market $129,900 Active 5 DOM
-
2026-06-13days on market $129,900 Active 4 DOM
-
2026-06-10days on market $129,900 Active 2 DOM
-
2026-06-09$129,900 Active 1 DOM
ⓘ Source: listings_history table (triggers on properties + properties_extension) + one-shot
backfill from property_details.listing_events for pre-trigger history.
Tax reassessment forecast GA · Resets to sale price
- Current annual tax
- $438 · $37/mo
- Projected year-2 tax
- $1,195 · $100/mo
- Expected delta
- +$757/yr (+$63/mo · 172.7%)
ⓘ Screening estimate from a state-policy table — verify with the county assessor before closing.
Climate risk First Street
- Flood 1/10 Low FEMA zone X (unshaded) · 0% chance over 30 yrs
- Wildfire 3/10 Moderate
- Heat 7/10 Severe 7 d/yr ≥109°F today · 18 d/yr by 30 yrs out
- Wind 6/10 Major 72% chance of damaging wind over 30 yrs
- Air quality 3/10 Moderate 3 unhealthy d/yr today · 4 by 30 yrs out
Nearby sold comps map
Loading sold comps map…
Walkable amenities ~0.75 mi
Loading nearby amenities…
Taxation est. · year 1
- Rental income
- $13,439
- − Mortgage interest
- −$7,276
- − Property taxes
- −$438
- − Insurance
- −$650
- − Repairs & maintenance
- −$1,075
- − Management
- −$1,075
- − Depreciation
- −$3,779
- Taxable loss
- −$855
- Est. tax savings @ 24.0%
- +$205
- After-tax cash flow
- $1,559/yr
For passive investors: Depreciation is non-cash, so a rental often shows a tax loss while cash-flowing — sheltering income. Rental losses are passive: they offset passive income freely, and up to $25,000/yr can offset ordinary (W-2) income if you actively participate and your MAGI is under $100k (phasing out to $0 by $150k); unused losses carry forward. On sale, claimed depreciation is recaptured at up to 25%, and gains may owe capital-gains tax (a 1031 exchange can defer both). Figures are a year-1 estimate at your 24.0% rate — not tax advice; consult a CPA.
Schools (NCES district)
- District
- Bibb County
- NCES district ID
- 1300420
- Math proficiency
- 11% ▼ -14.00%
- Reading proficiency
- 18% ▼ -11.00%
- Median HH income
- $37,426
- Composite
- 12.13/100
- National rank
- #9654
- State rank
- #161 of 174 in GA
Livability — Macon-Bibb County
No livability data for this city. (Only ~50 U.S. cities are tracked.)
Census & demographics
- Census place
- Macon-Bibb County, GA
- County
- Bibb County · 164,332 people
- City population
- 143,186
- Metro
- Macon-Bibb County, GA
- Population (ZIP)
- 24,310
- Household income
- $30,042
- Rent vs Own
- Severe rent burden
- 1335.0
Population outlook (Bibb County) Hauer SSP2
- Today (2025)
- 148,772 people
- By 2030
- 145,904 · -1.9%
- By 2040
- 139,404 · -6.3%
- By 2050
- 131,603 · -11.5%
- By 2075
- 111,050 · -25.4%
- By 2100
- 83,346 · -44.0%
Race, ethnicity, and origin ACS 2023
- Neighborhood character
- Predominantly Black (76%)
- Race & ethnicity
- Black 76% White 12% Hispanic / Latino 8% Two or more races 4%
- Hispanic origin (detail)
- Mexican 5% Puerto Rican 1%
- Common ancestry
- Lithuanian 1% Italian 1%
- Foreign-born
- 4% · Canada
- Languages at home
- 91% English-only · Spanish 8%
Political lean MEDSL · Bibb
- 2024 margin
- Strong D (+22.4) · D 61.0% · R 38.5%
- 2008→2024 swing
- +4.4pp toward D · 2008: 18.0pp · 2024: 22.4pp
- All cycles
- 2024: D+22.4 2020: D+23.8 2016: D+20.2 2012: D+20.0 2008: D+18.0
Not yet ingested
- Civics
- —
Market trends
- HPI YoY
- ▼ -80.17%
- Current HPI
- 148.6765
- Rent YoY
- ▲ 5.03%
- Metro
- Macon-Bibb County, GA
- State GDP YoY
- ▲ 2.66%
- F500 in state
- 28
Industry mix (Fortune 500 HQ in GA)
| Industry | F500 HQs | Revenue |
|---|---|---|
| Paper / Packaging | 2 | $29B |
|
||
| Retail | 1 | $160B |
|
||
| Transportation / Logistics | 1 | $91B |
|
||
| Airlines | 1 | $62B |
|
||
| Consumer Goods | 1 | $47B |
|
||
| Utilities | 1 | $25B |
|
||
Price history
+312.4% since first listed7 events — show timeline
- 2026-06-08 Listed $129,900 MGMLS
- 2022-09-28 Sold (MLS) $36,000 MGMLS
- 2022-09-28 Sold (MLS) $36,000 GAMLS
- 2022-09-21 Pending — GAMLS
- 2022-09-12 Listed $41,000 MGMLS
- 2022-08-19 Listed $41,000 GAMLS
- 2004-07-15 Sold (Public Records) $31,500 Public Records
Property tax history
+6.6%/yrLatest (2025): $438 · -1.3% YoY. Source: county tax records.
Cash-flow waterfall
monthlySold comps — $/sqft
last 12 mo · ≤1 miLoading sold comps…