 🏗️ New Construction
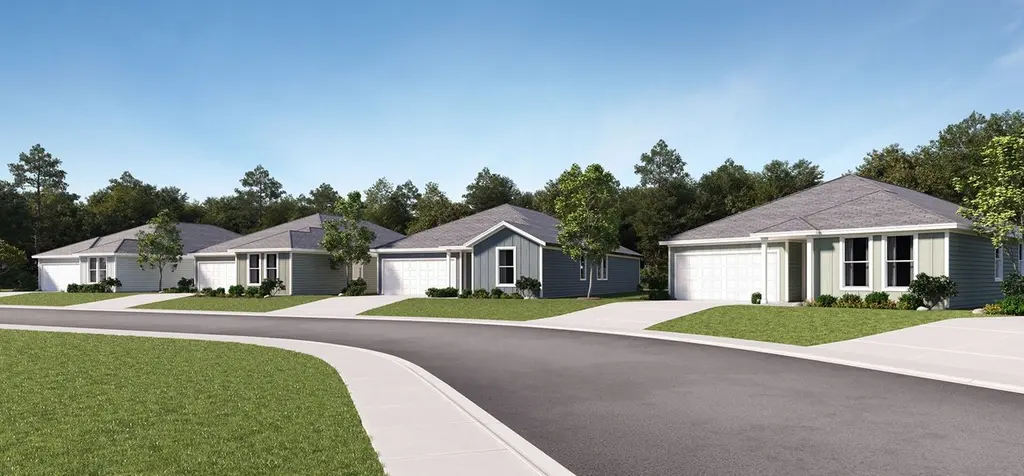
Littleton Plan · Springfield, FL
Flood risk No data
- FEMA flood zone
- —
- Chance of flooding over 30 yrs
- —
- Est. flood insurance / yr
- —
Fire risk No data
- Est. fire insurance / yr
- —
Heat risk No data
- Hot days now (above threshold)
- —
- Hot days in 30 yrs
- —
Wind risk No data
- Chance of severe wind over 30 yrs
- —
Air-quality risk No data
- Unhealthy air days now
- —
- Unhealthy air days in 30 yrs
- —
Risk factors via First Street. Map © Google.
Why this score? — see what drove the F grade
The composite is a weighted blend of 9 inputs, each scored 0–100. Each bar is that input's sub-score; the figure is the points it added to the 100-point composite (weight × sub-score).
- Cash flow +7.5/30.0
- ARV discount +7.5/15.0
- Schools +4.3/10.0
- Livability +3.0/5.0
- Rent growth +2.8/5.0
- Condition / age +2.5/5.0
- 1% rule +2.2/10.0
- DSCR +1.6/10.0
- Appreciation +0.0/10.0
$284,990
🖨 Deal sheet (PDF) 📄 Offer letter ✓ Due diligence
Listing remarks MLS
On the first floor of this spacious two-story home is a convenient and modern layout seamlessly connecting the kitchen, dining room and family room together. In a private corner is the tranquil owner's suite with an attached bathroom and walk-in closet. Upstairs is a sprawling central game room made for gatherings of all sizes, along with three secondary bedrooms to provide sleeping accommodations to family members and guests.
Key facts
- Local boutiques
- Large retailers
- Ample shopping
Tags
Neighborhood map
What this means for you Summary
Snapshot
- This is a 4-bed/2.5-bath single-family listed at $285k.
Deal economics
- At list price, monthly cash flow is $-381 ($-5k/yr) — negative.
- To cash-flow at today's rent, offer at most $253k (11.2% below list).
- To meet the 1% rule (rent ≥ 1% of price), the offer needs to be $221k (22.3% below list).
- Recommended offer: $221k (22.3% below list) — sets the bar for 1% rule.
Location & tenants
- Location reads 59/100 on livability (#826 in FL) — a working-class tenant base; expect higher turnover. Strengths: cost of living A+, housing A+, health & safety A+; Watch: employment D, crime F, amenities F.
- Bay (suburban): math 51% / reading 51% proficiency, ranked #29 of 73 in FL (top 40%) — acceptable for families but not a draw, mixed tenant base, ~2y average lease.
- Zoned schools: Cedar Grove Elementary School (math 18% / reading 18%, grade F, #2,115 of 2,144 statewide, top 99%, 562 students, 76% FRL); Merritt Brown Middle School (math 38% / reading 38%, grade F, #388 of 571 statewide, top 69%, 701 students, 55% FRL); Bay High School (math 37% / reading 34%, grade F, #367 of 667 statewide, top 57%, 1,255 students, 53% FRL).
- Zoned-school proficiency averages 30% at this address vs 51% district-wide (-20 pts) — the specific schools serving this property underperform the Bay average; the district grade overstates school quality for this exact location.
- Market conditions: Rents rising (+1.1%/yr); 983 active listings in the ZIP; 7 comparable units currently listed for rent nearby; rentals at typical pace (median 23d on market — plan ~3-4 weeks tenant-placement turnaround); 2,473 units permitted in Bay County in 2024 (559 in 5+ unit buildings).
- This rent runs 36% of the median local income ($75k/yr) — at the standard rent-burdened threshold; future hikes will face affordability resistance.
Forward outlook
- Local home prices are declining (-3.0%/yr); year-one equity from $2k of loan paydown is wiped out by about $9k of value loss. Plan a longer hold.
- Bay County population projected at +24% by 2050 — long-run rental-demand tailwind backs the buy-and-hold thesis.
Negotiation context
- It's been on market 125 days — a 12% lower offer ($251k) is reasonable based on typical stale-listing flexibility.
- 2 sale attempts; this cycle's ask has dropped $25k (8%) from the opening price — seller is motivated, your offer sets the floor, not the list.
Questions for the listing agent
- What do current leases actually rent for vs. the listed asking? Can we see a recent rent roll and the last 12 months of T-12 income?
- It's been on market 125 days. Have you received any prior offers? Is the seller open to a 22% concession, seller financing, or rate buy-down credit?
- Why hasn't it sold? Are there any deal-killer items the seller is aware of (foundation, flood, title, zoning, code violations)?
- Is there a deadline driving the sale (1031 exchange, divorce, estate, relocation)? That informs how much negotiation room exists.
- Schools are D-rated, which usually means shorter tenancies and higher turnover. Who's the typical renter profile here, and what's been the actual vacancy rate?
- Crime grade is F in this area — have there been break-ins, vandalism, or insurance claims at this property in the last 3 years? What carrier currently insures it and at what premium?
- The area grade is low — what's the realistic commute time and amenity access for the typical tenant pool here? Any planned neighborhood developments (good or bad) we should know about?
- What's the average days-on-market for RENTAL listings here right now (not sales)? A rising rental-DOM trend means longer vacancies and softer asking-rent achievability than the comps imply.
- What's the recent tenant-quality profile in this submarket — average credit score on applications, eviction rate, late-payment / NSF rate, and stable-employment percentage? A property-management company in the area should have these aggregated.
- How much new for-sale + rental construction is in the pipeline within 1–3 miles? Heavy new supply typically softens prices + rents 12–24 months out; constrained supply supports both.
Investment metrics
- 1% rule
- 0.72% ✗
- Cap rate
- 4.81%
- Cash-on-cash
- -5.30%
- DSCR
- 0.76
- GRM
- 11.6
CMA / ARV
- ARV (median comp)
- $308,240
- List price
- $284,990
- Delta
- -7.54%
- Verdict
- FAIR
- Comps
- 20 within 1.0 mi
Show comp detail 12 sales within ~0.75 mi
| Address | Dist | Beds/Ba | Sqft | Sold | Price | $/sf | Match |
|---|---|---|---|---|---|---|---|
| 3930 Lombard St | 0.10mi | 4/2.5 | 1,891 (0%) | 3mo | $299,990 | $159 | 93 |
| 3812 Wall Street St Unit HS 97 | 0.26mi | 4/2.5 | 1,891 (0%) | 2mo | $288,290 | $152 | 87 |
| 3912 Alwyn Cashe Ave #66 | 0.14mi | 3/2.0 (-1) | 1,891 (0%) | 2mo | $279,990 | $148 | 85 |
| 3928 Alwyn Cashe Ave #70 | 0.12mi | 4/2.0 | 2,000 (+6%) | 1mo | $289,990 | $145 | 82 |
| 3940 Alwyn Cashe Ave #73 | 0.11mi | 4/2.0 | 2,000 (+6%) | 2mo | $304,990 | $152 | 82 |
| 3961 Alwyn Cashe Ave #49 | 0.08mi | 3/2.0 (-1) | 1,744 (-8%) | 0mo | $306,490 | $176 | 76 |
| 3908 Alwyn Cashe Ave #65 | 0.15mi | 3/2.0 (-1) | 1,744 (-8%) | 2mo | $259,990 | $149 | 72 |
| 3665 Cedar Park Dr | 0.40mi | 4/2.0 | 1,751 (-7%) | 1mo | $369,000 | $211 | 66 |
| 3103 Justine Ct | 0.43mi | 3/2.0 (-1) | 1,962 (+4%) | 1mo | $449,900 | $229 | 66 |
| 3695 Cedar Park Dr | 0.44mi | 3/2.0 (-1) | 1,803 (-5%) | 2mo | $379,900 | $211 | 63 |
| 3950 Red Deer Cir | 0.61mi | 4/2.5 | 1,650 (-13%) | 0mo | $329,900 | $200 | 50 |
| 3946 Red Deer Cir | 0.60mi | 4/2.5 | 1,650 (-13%) | 1mo | $329,900 | $200 | 50 |
Match score weights: distance 35% · size 25% · config 20% · recency 20%. Top-matched comps best support the ARV.
Projected returns pro-forma
-3.0% appreciation · 1.12% rent growth · sell at horizon
- IRR
- -27.4%
- Equity multiple
- 0.09×
- Total profit
- $-78,300
- Equity at exit
- $45,960
- IRR
- -34.0%
- Equity multiple
- -0.34×
- Total profit
- $-115,549
- Equity at exit
- $26,651
Cash invested: $86,307 (down + closing). Projections, not guarantees.
Landlord ↔ Tenant lean methodology
- Overall (STATE)
- 87 Strongly Landlord-Friendly
- State Florida
- 87 Strongly Landlord-Friendly · R+3
- County
- — inherits STATE
- City
- — inherits STATE
ZIP-level market 32404
- Home prices YoY
- -16.1%
- Rents YoY
- 1.1%
- Active inventory
- 983
- Price-to-rent
- 10.7×
Monthly cashflow live
- Estimated rent
- $2,214 high interval (Pro) →
- Mortgage (P&I)
- −$1,616
- Tax est. 1.5%
- −$385 /mo · $4,624/yr
- Insurance
- −$128
- HOA
- −$0
- Vacancy / Maint / Mgmt
- −$465
- Net cashflow
- $-381
Break-even live
Sensitivity live
| Price | -10% $-168 | -5% $-275 | +0% $-381 | +5% $-488 | +10% $-594 |
|---|---|---|---|---|---|
| Rent | -10% $-556 | -5% $-469 | +0% $-381 | +5% $-294 | +10% $-206 |
| Rate | -1.0pp $-226 | -0.5pp $-303 | base $-381 | +0.5pp $-461 | +1.0pp $-542 |
UW: 25.0% down · 7.5% · 30yr · 1.5% tax · 5.0% vac · 8.0% maint · 8.0% mgmt
Financing live
Cash to close
- Down payment
- $77,060
- Closing costs
- $9,247
- Reserves months
- —
- Total cash needed
- —
Loan-product check · same deal, 3 products live
Conventional
25% down · 7.5% · 30yr
- Down + closing
- —
- Monthly P&I
- —
- Monthly cashflow
- —
- DSCR
- —
- Eligible?
- —
Personal DTI + credit; lowest rate.
DSCR
20% down · 8.5% · 30yr
- Down + closing
- —
- Monthly P&I
- —
- Monthly cashflow
- —
- DSCR
- —
- Eligible?
- —
No personal income docs; deal must DSCR.
Hard money
10% down · 12.0% · 12mo
- Down + closing
- —
- Monthly P&I
- —
- Monthly cashflow
- —
- DSCR
- —
- Eligible?
- —
Short-term bridge; refi at stabilization.
Rent comps 7 comps
| Address | Beds | Baths | Sqft | Rent | $/sqft | DOM | Units | Dist |
|---|---|---|---|---|---|---|---|---|
| 3884 Red Deer Cir Panama City, FL | 4.0 | 2.0 | 1972 | $2,200 | $1.12 | 23d | 1 | 0.61mi |
| 3525 T St Panama City, FL | 3.0 | 2.0 | 1250 | $1,600 | $1.28 | 23d | 1 | 0.78mi |
| 2601 Avondale Ct Panama City, FL | 3.0 | 2.5 | 1371 | $1,700 | $1.24 | 15d | 1 | 0.93mi |
| 3733 Avon Rd Panama City, FL | 3.0 | 2.0 | 1251 | $1,900 | $1.52 | 23d | 1 | 0.94mi |
| 4012 Millicent Ln Panama City, FL | 4.0 | 2.0 | 1787 | $1,950 | $1.09 | 23d | 1 | 1.26mi |
| 4113 Brighton Blvd Panama City, FL | 4.0 | 2.0 | 1787 | $2,300 | $1.29 | 15d | 1 | 1.30mi |
| 3545 Brentwood Pl Panama City, FL | 3.0 | 2.0 | 1617 | $2,200 | $1.36 | 23d | 1 | 1.31mi |
Listing history 24 events
-
2026-06-21days on market $284,990 Active 125 DOM
-
2026-06-19days on market $284,990 Active 123 DOM
-
2026-06-18days on market $284,990 Active 122 DOM
-
2026-06-17days on market $284,990 Active 121 DOM
-
2026-06-16days on market $284,990 Active 120 DOM
-
2026-06-15days on market $284,990 Active 119 DOM
-
2026-06-14days on market $284,990 Active 117 DOM
-
2026-06-13days on market $284,990 Active 116 DOM
-
2026-06-10days on market $284,990 Active 114 DOM
-
2026-06-09days on market $284,990 Active 113 DOM
-
2026-06-08days on market $284,990 Active 112 DOM
-
2026-06-07days on market $284,990 Active 111 DOM
-
2026-06-05days on market $284,990 Active 108 DOM
-
2026-06-03days on market $284,990 Active 107 DOM
-
2026-06-02days on market $284,990 Active 106 DOM
-
2026-06-01days on market $284,990 Active 105 DOM
-
2026-05-31pricedays on market $284,990 Active 104 DOM
-
2026-05-30days on market $309,990 Active 103 DOM
-
2026-02-19price $309,990 430-char remark
Show marketing remark (382 chars)
The Majors Collection is a new series of single-family homes for sale at the Magnolia Ridge masterplan in Panama City Beach, FL. Residents will enjoy convenient access to the turquoise waters of the Gulf, with convenient proximity to ample shopping at local boutiques, farmers markets and large retailers. The community is located only a mile from I-10 for easy commutes and travel.
-
2026-02-19price $309,990 382-char remark
Show marketing remark (382 chars)
The Majors Collection is a new series of single-family homes for sale at the Magnolia Ridge masterplan in Panama City Beach, FL. Residents will enjoy convenient access to the turquoise waters of the Gulf, with convenient proximity to ample shopping at local boutiques, farmers markets and large retailers. The community is located only a mile from I-10 for easy commutes and travel.
-
2026-02-18price $314,990 382-char remark
Show marketing remark (430 chars)
On the first floor of this spacious two-story home is a convenient and modern layout seamlessly connecting the kitchen, dining room and family room together. In a private corner is the tranquil owner's suite with an attached bathroom and walk-in closet. Upstairs is a sprawling central game room made for gatherings of all sizes, along with three secondary bedrooms to provide sleeping accommodations to family members and guests.
-
2026-02-18price $334,990 430-char remark
Show marketing remark (430 chars)
On the first floor of this spacious two-story home is a convenient and modern layout seamlessly connecting the kitchen, dining room and family room together. In a private corner is the tranquil owner's suite with an attached bathroom and walk-in closet. Upstairs is a sprawling central game room made for gatherings of all sizes, along with three secondary bedrooms to provide sleeping accommodations to family members and guests.
-
2026-02-16$309,990 Active 382-char remark
Show marketing remark (382 chars)
The Majors Collection is a new series of single-family homes for sale at the Magnolia Ridge masterplan in Panama City Beach, FL. Residents will enjoy convenient access to the turquoise waters of the Gulf, with convenient proximity to ample shopping at local boutiques, farmers markets and large retailers. The community is located only a mile from I-10 for easy commutes and travel.
-
2025-10-24$329,990 Active 430-char remark
Show marketing remark (430 chars)
On the first floor of this spacious two-story home is a convenient and modern layout seamlessly connecting the kitchen, dining room and family room together. In a private corner is the tranquil owner's suite with an attached bathroom and walk-in closet. Upstairs is a sprawling central game room made for gatherings of all sizes, along with three secondary bedrooms to provide sleeping accommodations to family members and guests.
ⓘ Source: listings_history table (triggers on properties + properties_extension) + one-shot
backfill from property_details.listing_events for pre-trigger history.
Nearby sold comps map
Loading sold comps map…
Walkable amenities ~0.75 mi
Loading nearby amenities…
Taxation est. · year 1
- Rental income
- $26,568
- − Mortgage interest
- −$17,266
- − Property taxes
- −$4,624
- − Insurance
- −$1,541
- − Repairs & maintenance
- −$2,125
- − Management
- −$2,125
- − Depreciation
- −$8,967
- Taxable loss
- −$10,081
- Est. tax savings @ 24.0%
- +$2,419
- After-tax cash flow
- $-2,154/yr
For passive investors: Depreciation is non-cash, so a rental often shows a tax loss while cash-flowing — sheltering income. Rental losses are passive: they offset passive income freely, and up to $25,000/yr can offset ordinary (W-2) income if you actively participate and your MAGI is under $100k (phasing out to $0 by $150k); unused losses carry forward. On sale, claimed depreciation is recaptured at up to 25%, and gains may owe capital-gains tax (a 1031 exchange can defer both). Figures are a year-1 estimate at your 24.0% rate — not tax advice; consult a CPA.
Schools (NCES district)
- District
- Bay
- NCES district ID
- 1200090
- Math proficiency
- 51% ▼ -8.00%
- Reading proficiency
- 51% ▼ -7.00%
- Median HH income
- $47,740
- Composite
- 43.41/100
- National rank
- #3014
- State rank
- #29 of 73 in FL
Livability — Springfield
- Score
- 59/100
- State rank
- #826
- US rank
- #20265
Category grades
Schools grade is shown separately in the Schools card above.
Census & demographics
- County
- Bay County · 163,593 people
- Metro
- Panama City, FL
- Population (ZIP)
- 42,514
- Household income
- $74,708
- Rent vs Own
- Severe rent burden
- 1218.0
Population outlook (Bay County) Hauer SSP2
- Today (2025)
- 206,264 people
- By 2030
- 217,740 · +5.6%
- By 2040
- 238,738 · +15.7%
- By 2050
- 255,545 · +23.9%
- By 2075
- 288,295 · +39.8%
- By 2100
- 288,638 · +39.9%
Race, ethnicity, and origin ACS 2023
- Neighborhood character
- Predominantly White (69%)
- Race & ethnicity
- White 69% Black 12% Two or more races 10% Hispanic / Latino 9% Asian 3%
- Hispanic origin (detail)
- Mexican 2% Puerto Rican 3%
- Common ancestry
- Lithuanian 3% Slovak 2% Italian 2%
- Foreign-born
- 7% · Canada, Vietnam, Mexico
- Languages at home
- 90% English-only · Spanish 6% Vietnamese 1% Other Asian/Pacific 1%
Political lean MEDSL · Bay
- 2024 margin
- Solid R (+47.4) · D 25.8% · R 73.1% · Other 1.1%
- 2008→2024 swing
- -6.6pp toward R · 2008: -40.7pp · 2024: -47.4pp
- All cycles
- 2024: R+47.4 2020: R+43.5 2016: R+46.3 2012: R+43.6 2008: R+40.7
Not yet ingested
- Civics
- —
Market trends
- HPI YoY
- ▼ -50.59%
- Current HPI
- 263.7178
- Rent YoY
- ▲ 1.12%
- Metro
- Panama City, FL
- State GDP YoY
- ▲ 3.28%
- F500 in state
- 36
Industry mix (Fortune 500 HQ in FL)
| Industry | F500 HQs | Revenue |
|---|---|---|
| Industrial Technology | 2 | $29B |
|
||
| Insurance | 2 | $17B |
|
||
| Retail | 1 | $60B |
|
||
| Technology Distribution | 1 | $58B |
|
||
| Homebuilding | 1 | $35B |
|
||
| Technology Manufacturing | 1 | $35B |
|
||
Price history
-6.1% since first listed6 events — show timeline
- 2026-02-19 Price Changed $309,990 Zillow
- 2026-02-19 Price Changed $309,990 Zillow
- 2026-02-18 Price Changed $314,990 Zillow
- 2026-02-18 Price Changed $334,990 Zillow
- 2026-02-16 Listed $309,990 Zillow
- 2025-10-24 Listed $329,990 Zillow
Cash-flow waterfall
monthlySold comps — $/sqft
last 12 mo · ≤1 miLoading sold comps…