 Multi-family
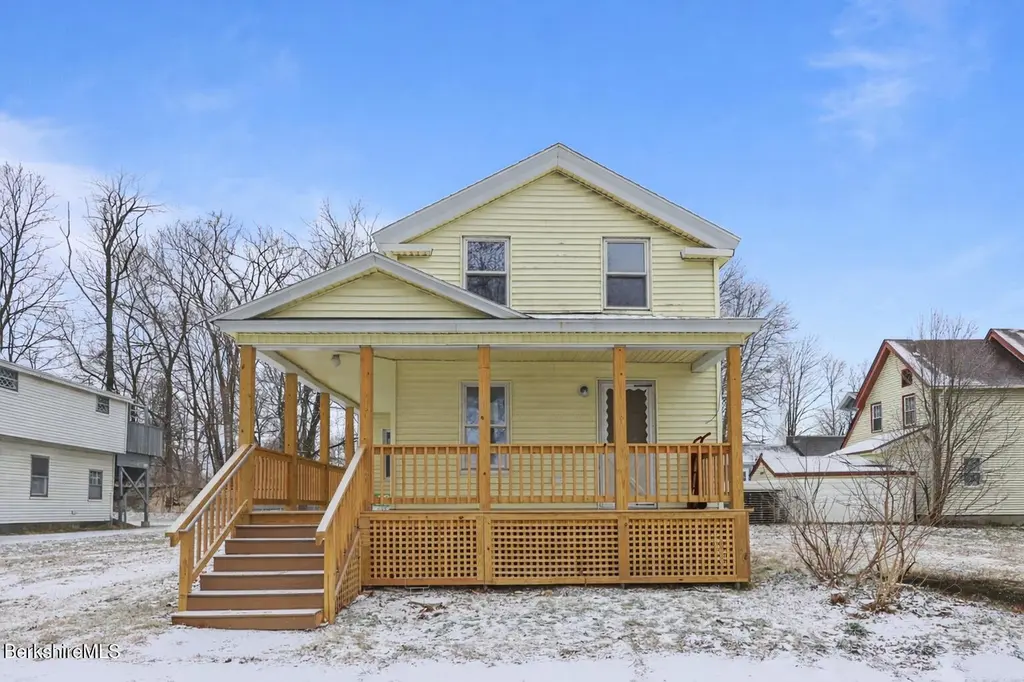
17 S Church St · Pittsfield, MA
Flood risk 1/10 · Minimal
- FEMA flood zone
- X
- Chance of flooding over 30 yrs
- 0.0%
- Est. flood insurance / yr
- $473 – $860
Fire risk 1/10 · Minimal
- Est. fire insurance / yr
- $915 – $1,699
Heat risk 3/10 · Minor
- Hot days now (above 92°F)
- 7 days/yr
- Hot days in 30 yrs
- 17 days/yr
Wind risk 4/10 · Minor
- Chance of severe wind over 30 yrs
- 10.0%
Air-quality risk 2/10 · Minimal
- Unhealthy air days now
- 1 days/yr
- Unhealthy air days in 30 yrs
- 1 days/yr
Risk factors via First Street. Map © Google.
Why this score? — see what drove the F grade
The composite is a weighted blend of 9 inputs, each scored 0–100. Each bar is that input's sub-score; the figure is the points it added to the 100-point composite (weight × sub-score).
- Cash flow +11.3/30.0
- Rent growth +4.4/5.0
- Livability +3.8/5.0
- DSCR +3.3/10.0
- Condition / age +2.5/5.0
- 1% rule +2.3/10.0
- Schools +2.3/10.0
- ARV discount +0.0/15.0
- Appreciation +0.0/10.0
$265,000
🖨 Deal sheet 📄 Offer letter ✓ Due diligence
Multi-family units
County records classify this as Multi-Family (2-4 Unit). Listing-text estimate: 1 unit. estimate disagrees with records
Listing remarks MLS
Spacious and freshly updated West Side single-family offering 4 bedrooms and 2 full baths across 1,408 sq ft. Bright, functional layout with generous room sizes, fresh interior paint, and new laminate flooring throughout. Modern kitchen features brand-new appliances and clean, updated finishes. Enjoy a charming wraparound porch with dual entry, ideal for relaxing or entertaining, plus a level backyard on a 6,969 sq ft lot. Efficient gas steam heat. Move-in ready and thoughtfully improved for comfortable everyday living.
Key facts
- Level backyard
- Wraparound porch
- Modern kitchen
Tags
Neighborhood map
What this means for you Summary
Snapshot
- This is a 4-bed/2.5-bath multifamily listed at $265k.
Deal economics
- At list price, monthly cash flow is $-96 ($-1k/yr) — negative.
- To cash-flow at today's rent, offer at most $248k (6.4% below list).
- To meet the 1% rule (rent ≥ 1% of price), the offer needs to be $194k (26.7% below list).
- Recommended offer: $194k (26.7% below list) — sets the bar for 1% rule.
- Cap rate 5.9% vs local median 3.6% in Pittsfield — top-decile yield for the area; either an underpriced asset or a hidden risk that comps aren't pricing in. Stress-test before assuming the spread holds.
Location & tenants
- Location reads 75/100 on livability (#70 in MA, #3,820 nationally) — a middle-class / working-renter tenant base. Strengths: commute A+, housing A+, health & safety A+; Watch: employment C-, amenities D+, schools D.
- Pittsfield (urban): math 19% / reading 34% proficiency, ranked #272 of 302 in MA (top 90%) — low school quality limits family demand, transient renter base, plan for 1-2y turnover.
- Market conditions: Rents rising fast (+7.7%/yr); 275 active listings in the ZIP; 5 comparable units currently listed for rent nearby; rentals lingering (median 44d on market — plan ~5-8 weeks vacancy on turnover, expect pricing pressure); 80% of comp listings sitting > 30 days — soft ceiling on asking rent; 130 units permitted in Berkshire County in 2024 (10 in 5+ unit buildings).
- This rent runs 33% of the median local income ($71k/yr) — at the standard rent-burdened threshold; future hikes will face affordability resistance.
Forward outlook
- Local home prices are declining (-3.0%/yr); year-one equity from $2k of loan paydown is wiped out by about $8k of value loss. Plan a longer hold.
- Berkshire County population projected at -24% by 2050 — secular population decline; favor cash flow + early exit over multi-decade hold.
Negotiation context
- It's been on market 155 days — a 12% lower offer ($233k) is reasonable based on typical stale-listing flexibility.
Risks & watch-outs
- Watch-outs: built in 1890 — expect roof / HVAC / electrical / plumbing capex.
Questions for the listing agent
- What do current leases actually rent for vs. the listed asking? Can we see a recent rent roll and the last 12 months of T-12 income?
- It's been on market 155 days. Have you received any prior offers? Is the seller open to a 27% concession, seller financing, or rate buy-down credit?
- Built in 1890 — when were the roof, HVAC, electrical panel, plumbing, and water heater last replaced?
- Why hasn't it sold? Are there any deal-killer items the seller is aware of (foundation, flood, title, zoning, code violations)?
- Is there a deadline driving the sale (1031 exchange, divorce, estate, relocation)? That informs how much negotiation room exists.
- Schools are D-rated, which usually means shorter tenancies and higher turnover. Who's the typical renter profile here, and what's been the actual vacancy rate?
- Crime grade is D in this area — have there been break-ins, vandalism, or insurance claims at this property in the last 3 years? What carrier currently insures it and at what premium?
- The area grade is low — what's the realistic commute time and amenity access for the typical tenant pool here? Any planned neighborhood developments (good or bad) we should know about?
- What's the average days-on-market for RENTAL listings here right now (not sales)? A rising rental-DOM trend means longer vacancies and softer asking-rent achievability than the comps imply.
- What's the recent tenant-quality profile in this submarket — average credit score on applications, eviction rate, late-payment / NSF rate, and stable-employment percentage? A property-management company in the area should have these aggregated.
- How much new apartment / multifamily construction is in the pipeline within 1–3 miles? Heavy new supply (>2% of stock underway) typically softens rents 12–24 months out; light construction supports rent growth.
Investment metrics
- 1% rule
- 0.73% ✗
- Cap rate
- 5.86%
- Cash-on-cash
- -1.55%
- DSCR
- 0.93
- GRM
- 11.4
CMA / ARV
- ARV (median comp)
- $200,228
- List price
- $265,000
- Delta
- 32.35%
- Verdict
- OVERPRICED
- Comps
- 20 within 1.0 mi
Show comp detail 2 sales within ~0.75 mi
| Address | Dist | Beds/Ba | Sqft | Sold | Price | $/sf | Match |
|---|---|---|---|---|---|---|---|
| 79 Center St | 0.02mi | 3/3.0 (-1) | 1,603 (+14%) | 4mo | $220,000 | $137 | 66 |
| 51-53 Adam St | 0.68mi | 4/2.0 | 1,480 (+5%) | 7mo | $190,000 | $128 | 52 |
Match score weights: distance 35% · size 25% · config 20% · recency 20%. Top-matched comps best support the ARV.
Projected returns pro-forma
-3.0% appreciation · 7.72% rent growth · sell at horizon
- IRR
- -14.3%
- Equity multiple
- 0.47×
- Total profit
- $-39,479
- Equity at exit
- $39,512
- IRR
- 0.2%
- Equity multiple
- 1.01×
- Total profit
- $1,103
- Equity at exit
- $22,912
Cash invested: $74,200 (down + closing). Projections, not guarantees.
Landlord ↔ Tenant lean methodology
- Overall (STATE)
- 20 Strongly Tenant-Friendly
- State Massachusetts
- 20 Strongly Tenant-Friendly · D+15
- County
- — inherits STATE
- City
- — inherits STATE
ZIP-level market 01201
- Rents YoY
- 7.7%
- Active inventory
- 275
- Price-to-rent
- 11.4×
Monthly cashflow live
- Estimated rent
- $1,943 high interval (Pro) →
- Mortgage (P&I)
- −$1,390
- Tax from tax record
- −$130 /mo · $1,565/yr
- Insurance
- −$110
- HOA
- −$0
- Vacancy / Maint / Mgmt
- −$408
- Net cashflow
- $-96
Break-even live
UW: 25.0% down · 7.5% · 30yr · 1.5% tax · 5.0% vac · 8.0% maint · 8.0% mgmt
Financing live
Cash to close
- Down payment
- $66,250
- Closing costs
- $7,950
- Reserves months
- —
- Total cash needed
- —
Loan-product check · same deal, 3 products live
Conventional
25% down · 7.5% · 30yr
- Down + closing
- —
- Monthly P&I
- —
- Monthly cashflow
- —
- DSCR
- —
- Eligible?
- —
Personal DTI + credit; lowest rate.
DSCR
20% down · 8.5% · 30yr
- Down + closing
- —
- Monthly P&I
- —
- Monthly cashflow
- —
- DSCR
- —
- Eligible?
- —
No personal income docs; deal must DSCR.
Hard money
10% down · 12.0% · 12mo
- Down + closing
- —
- Monthly P&I
- —
- Monthly cashflow
- —
- DSCR
- —
- Eligible?
- —
Short-term bridge; refi at stabilization.
Rent comps 5 comps
| Address | Beds | Baths | Sqft | Rent | $/sqft | DOM | Units | Dist |
|---|---|---|---|---|---|---|---|---|
| 19 Atwood Ave Pittsfield, MA | 3.0 | 1.0 | 1350 | $1,600 | $1.19 | 43d | 1 | 0.25mi |
| 266 Linden St Unit 2R Pittsfield, MA | 3.0 | 1.0 | 1000 | $1,750 | $1.75 | 23d | 1 | 0.88mi |
| 117 Lincoln St Unit 117 Pittsfield, MA | 4.0 | 2.0 | 1500 | $2,000 | $1.33 | 43d | 1 | 0.91mi |
| 88 Wahconah St Pittsfield, MA | 4.0 | 1.5 | 1292 | $2,300 | $1.78 | 43d | 1 | 1.11mi |
| 76 Stoddard Ave Unit 78 Pittsfield, MA | 4.0 | 1.5 | 1560 | $2,000 | $1.28 | 43d | 1 | 1.13mi |
Listing history 16 events
-
2026-06-19days on market $265,000 Active 155 DOM
-
2026-06-18days on market $265,000 Active 154 DOM
-
2026-06-17days on market $265,000 Active 153 DOM
-
2026-06-16days on market $265,000 Active 152 DOM
-
2026-06-15days on market $265,000 Active 151 DOM
-
2026-06-14days on market $265,000 Active 149 DOM
-
2026-06-12days on market $265,000 Active 148 DOM
-
2026-06-09days on market $265,000 Active 145 DOM
-
2026-06-08days on market $265,000 Active 144 DOM
-
2026-06-07days on market $265,000 Active 143 DOM
-
2026-06-05days on market $265,000 Active 140 DOM
-
2026-06-02days on market $265,000 Active 138 DOM
-
2026-06-01days on market $265,000 Active 137 DOM
-
2026-05-31days on market $265,000 Active 136 DOM
-
2026-05-30days on market $265,000 Active 135 DOM
-
2026-01-15$265,000 Active 525-char remark
Show marketing remark (525 chars)
Spacious and freshly updated West Side single-family offering 4 bedrooms and 2 full baths across 1,408 sq ft. Bright, functional layout with generous room sizes, fresh interior paint, and new laminate flooring throughout. Modern kitchen features brand-new appliances and clean, updated finishes. Enjoy a charming wraparound porch with dual entry, ideal for relaxing or entertaining, plus a level backyard on a 6,969 sq ft lot. Efficient gas steam heat. Move-in ready and thoughtfully improved for comfortable everyday living.
ⓘ Source: listings_history table (triggers on properties + properties_extension) + one-shot
backfill from property_details.listing_events for pre-trigger history.
Tax reassessment forecast MA · Partial reset (capped growth)
- Current annual tax
- $1,565 · $130/mo
- Projected year-2 tax
- $2,412 · $201/mo
- Expected delta
- +$847/yr (+$71/mo · 54.1%)
ⓘ Screening estimate from a state-policy table — verify with the county assessor before closing.
Climate risk First Street
- Flood 1/10 Low FEMA zone X · 0% chance over 30 yrs
- Wildfire 1/10 Low
- Heat 3/10 Moderate 7 d/yr ≥92°F today · 17 d/yr by 30 yrs out
- Wind 4/10 Moderate 10% chance of damaging wind over 30 yrs
- Air quality 2/10 Low 1 unhealthy d/yr today · 1 by 30 yrs out
Nearby sold comps map
Loading sold comps map…
Walkable amenities ~0.75 mi
Loading nearby amenities…
Taxation est. · year 1
- Rental income
- $23,311
- − Mortgage interest
- −$14,844
- − Property taxes
- −$1,565
- − Insurance
- −$1,325
- − Repairs & maintenance
- −$1,865
- − Management
- −$1,865
- − Depreciation
- −$7,709
- Taxable loss
- −$5,862
- Est. tax savings @ 24.0%
- +$1,407
- After-tax cash flow
- $256/yr
For passive investors: Depreciation is non-cash, so a rental often shows a tax loss while cash-flowing — sheltering income. Rental losses are passive: they offset passive income freely, and up to $25,000/yr can offset ordinary (W-2) income if you actively participate and your MAGI is under $100k (phasing out to $0 by $150k); unused losses carry forward. On sale, claimed depreciation is recaptured at up to 25%, and gains may owe capital-gains tax (a 1031 exchange can defer both). Figures are a year-1 estimate at your 24.0% rate — not tax advice; consult a CPA.
Schools (NCES district)
- District
- Pittsfield
- NCES district ID
- 2509630
- Math proficiency
- 19% ▼ -10.00%
- Reading proficiency
- 34% ▼ -2.00%
- Median HH income
- $44,032
- Composite
- 22.67/100
- National rank
- #8046
- State rank
- #272 of 302 in MA
Livability — Pittsfield
- Score
- 75/100
- State rank
- #70
- US rank
- #3820
Category grades
Schools grade is shown separately in the Schools card above.
Census & demographics
- Census place
- Pittsfield, MA
- County
- Berkshire County · 44,848 people
- City population
- 44,848
- Metro
- Pittsfield, MA
- Population (ZIP)
- 44,848
- Household income
- $71,093
- Rent vs Own
- Severe rent burden
- 1580.0
Population outlook (Berkshire County) Hauer SSP2
- Today (2025)
- 119,723 people
- By 2030
- 114,608 · -4.3%
- By 2040
- 102,806 · -14.1%
- By 2050
- 91,305 · -23.7%
- By 2075
- 71,517 · -40.3%
- By 2100
- 57,988 · -51.6%
Race, ethnicity, and origin ACS 2023
- Neighborhood character
- Predominantly White (78%)
- Race & ethnicity
- White 78% Two or more races 10% Hispanic / Latino 9% Black 5% Asian 1%
- Hispanic origin (detail)
- Puerto Rican 3%
- Common ancestry
- Lithuanian 8% Romanian 6% Slovak 2%
- Foreign-born
- 7% · Canada, Jamaica
- Languages at home
- 90% English-only · Spanish 6% Other Indo-European 1% Russian/Polish/Slavic 1%
Political lean MEDSL · Berkshire
- 2024 margin
- Solid D (+39.9) · D 68.9% · R 29.0% · Other 2.1%
- 2008→2024 swing
- -12.5pp toward R · 2008: 52.4pp · 2024: 39.9pp
- All cycles
- 2024: D+39.9 2020: D+47.1 2016: D+41.5 2012: D+53.7 2008: D+52.4
Not yet ingested
- Civics
- —
Market trends
- HPI YoY
- ▼ -199.88%
- Current HPI
- 283.3421
- Rent YoY
- ▲ 7.72%
- Metro
- Pittsfield, MA
- State GDP YoY
- ▲ 2.28%
- F500 in state
- 38
Industry mix (Fortune 500 HQ in MA)
| Industry | F500 HQs | Revenue |
|---|---|---|
| Technology | 3 | $17B |
|
||
| Insurance | 2 | $84B |
|
||
| Retail | 2 | $76B |
|
||
| Life Sciences | 1 | $43B |
|
||
| Energy Technology | 1 | $31B |
|
||
| Aerospace / Defense | 1 | $18B |
|
||
Price history
1 event — show timeline
- 2026-01-15 Listed $265,000 BCMLS
Property tax history
+1.1%/yrLatest (2023): $1,565 · +7.0% YoY. Source: county tax records.
Cash-flow waterfall
monthlySold comps — $/sqft
last 12 mo · ≤1 miLoading sold comps…