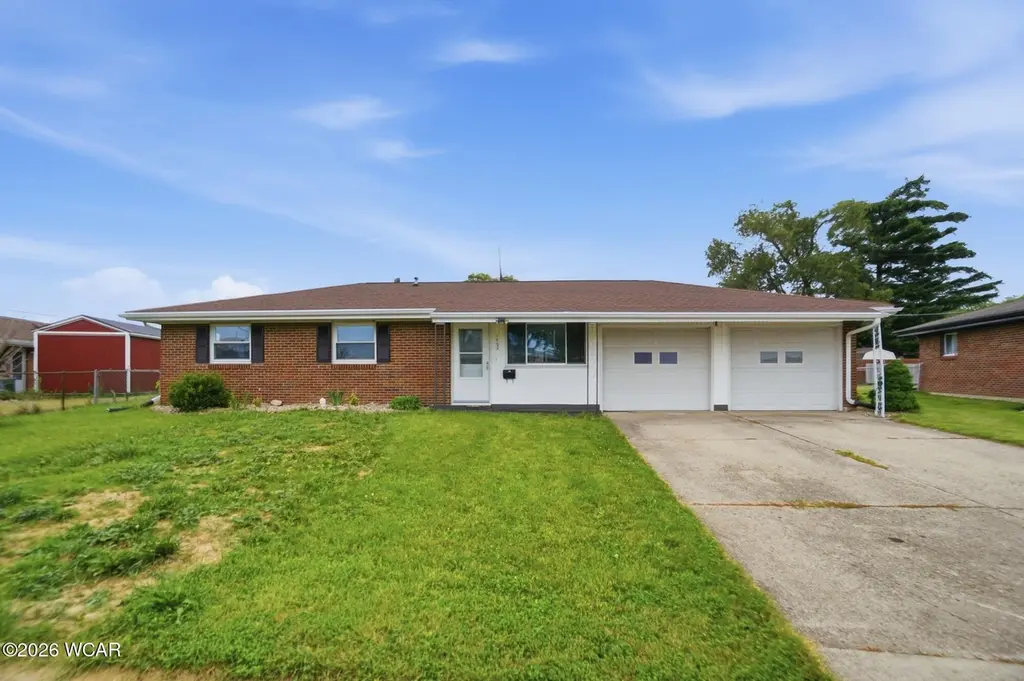
1922 Rice Ave · Lima, OH
Flood risk 1/10 · Minimal
- FEMA flood zone
- X (unshaded)
- Chance of flooding over 30 yrs
- 0.0%
- Est. flood insurance / yr
- $507 – $1,088
Fire risk 1/10 · Minimal
- Est. fire insurance / yr
- $713 – $1,323
Heat risk 3/10 · Minor
- Hot days now (above 100°F)
- 7 days/yr
- Hot days in 30 yrs
- 18 days/yr
Wind risk 2/10 · Minimal
- Chance of severe wind over 30 yrs
- —
Air-quality risk 2/10 · Minimal
- Unhealthy air days now
- 1 days/yr
- Unhealthy air days in 30 yrs
- 2 days/yr
Risk factors via First Street. Map © Google.
Why this score? — see what drove the C- grade
The composite is a weighted blend of 9 inputs, each scored 0–100. Each bar is that input's sub-score; the figure is the points it added to the 100-point composite (weight × sub-score).
- Cash flow +26.1/30.0
- DSCR +8.8/10.0
- 1% rule +6.3/10.0
- Livability +3.2/5.0
- Schools +2.6/10.0
- Rent growth +2.5/5.0
- Condition / age +2.5/5.0
- ARV discount +0.0/15.0
- Appreciation +0.0/10.0
$169,900
🖨 Deal sheet 📄 Offer letter ✓ Due diligence
Listing remarks MLS
Under 1 Acre
Key facts
- Brick exterior
- Nicely sized lot
- Natural light
Tags
Property features AI
Finance
- Other: Residential zoning
- Financial info: Not specified
- HOA & community: Not specified
Exterior
- Parking: Attached 2-car garage
- Security: Not specified
- Utilities: Public water; Public sewer; Electricity connected; Natural gas connected; Water connected
- Home design: Single-family residence; One-level home
- Construction: Asphalt, brick veneer, and vinyl siding exterior; Slab foundation; Built (year not specified)
- Exterior features: Covered patio and porch; Porch; Fenced yard; Level lot
Interior
- Kitchen: Dishwasher, Range, Refrigerator
- Bedrooms: Not specified
- Flooring: Carpet; Vinyl
- Bathrooms: One full bathroom
- Heating & cooling: Central air conditioning; Forced air heating with natural gas
- Interior features: Dishwasher, Range, Refrigerator; Five total rooms
- Laundry & utility: Not specified
Neighborhood map
What this means for you Summary
Snapshot
- This is a 3-bed/1.0-bath single-family listed at $170k.
Deal economics
- At list price, monthly cash flow is $428 ($5k/yr) — positive.
- The deal already cash-flows at list — no discount required.
- Meets the 1% rule at list price ($2k rent vs $170k).
- Cap rate 9.3% vs local median 7.7% in Lima — meaningfully above typical; check what's discounted (condition, days-on-market, listing class) to confirm the premium yield is real.
Location & tenants
- Location reads 64/100 on livability (#787 in OH) — a middle-class / working-renter tenant base. Strengths: cost of living A+, housing A+, health & safety A-; Watch: crime F, amenities F, commute F.
- Lima City (urban): math 29% / reading 36% proficiency, ranked #575 of 656 in OH (top 88%) — families likely to look elsewhere, expect single-tenant / working-renter base with shorter leases; 83% free/reduced lunch — lower-income household profile, screen leases tightly.
- Market conditions: 105 active listings in the ZIP; 4 comparable units currently listed for rent nearby; rentals lingering (median 44d on market — plan ~5-8 weeks vacancy on turnover, expect pricing pressure); 100% of comp listings sitting > 30 days — soft ceiling on asking rent; 88 units permitted in Allen County in 2024 (0 in 5+ unit buildings).
- This rent runs 35% of the median local income ($66k/yr) — at the standard rent-burdened threshold; future hikes will face affordability resistance.
Forward outlook
- Local home prices are declining (-3.0%/yr); year-one equity from $1k of loan paydown is wiped out by about $5k of value loss. Plan a longer hold.
- Allen County population projected at -14% by 2050 — secular population decline; favor cash flow + early exit over multi-decade hold.
Negotiation context
- Only 9 days on market — expect competitive offers; lowballing is unlikely to land.
- 2 sale attempts since 12y ago with the ask held roughly flat each time — persistent listings suggest the price (not the market) is what's stuck; bring a comps-based counter.
- Current owner paid $50k; list at $170k implies a 240% gain — meaningful room to come down on a strong offer.
Questions for the listing agent
- Built in 1961 — when were the roof, HVAC, electrical panel, plumbing, and water heater last replaced?
- Is there a deadline driving the sale (1031 exchange, divorce, estate, relocation)? That informs how much negotiation room exists.
- Crime grade is F in this area — have there been break-ins, vandalism, or insurance claims at this property in the last 3 years? What carrier currently insures it and at what premium?
- What's the average days-on-market for RENTAL listings here right now (not sales)? A rising rental-DOM trend means longer vacancies and softer asking-rent achievability than the comps imply.
- What's the recent tenant-quality profile in this submarket — average credit score on applications, eviction rate, late-payment / NSF rate, and stable-employment percentage? A property-management company in the area should have these aggregated.
- How much new for-sale + rental construction is in the pipeline within 1–3 miles? Heavy new supply typically softens prices + rents 12–24 months out; constrained supply supports both.
Investment metrics
- 1% rule
- 1.13% ✓
- Cap rate
- 9.32%
- Cash-on-cash
- 10.80%
- DSCR
- 1.48
- GRM
- 7.4
CMA / ARV
- ARV (on-the-fly)
- $144,666
- Comps found
- 12
Show comp detail 12 sales within ~0.75 mi
| Address | Dist | Beds/Ba | Sqft | Sold | Price | $/sf | Match |
|---|---|---|---|---|---|---|---|
| 858 Mackenzie Dr | 0.06mi | 3/1.0 | 999 (-3%) | 4mo | $139,000 | $139 | 90 |
| 1821 Rice Ave | 0.10mi | 3/1.0 | 1,026 (0%) | 10mo | $167,700 | $163 | 87 |
| 725 Mackenzie Dr Dr | 0.27mi | 3/1.5 | 1,040 (+1%) | 8mo | $85,000 | $82 | 77 |
| 843 Mackenzie Dr | 0.03mi | 3/1.0 | 943 (-8%) | 11mo | $112,000 | $119 | 76 |
| 1719 Latham Ave | 0.26mi | 3/1.5 | 1,080 (+5%) | 6mo | $156,000 | $144 | 72 |
| 275 N Dale Dr | 0.58mi | 3/1.0 | 995 (-3%) | 2mo | $155,000 | $156 | 66 |
| 2011 W Wayne St | 0.50mi | 3/1.0 | 1,114 (+9%) | 1mo | $184,900 | $166 | 62 |
| 1407 Latham Ave | 0.72mi | 3/1.0 | 1,066 (+4%) | 2mo | $130,000 | $122 | 58 |
| 415 N Nixon Ave | 0.61mi | 3/1.5 | 1,068 (+4%) | 10mo | $172,000 | $161 | 54 |
| 315 N Nixon Ave | 0.70mi | 3/1.0 | 1,070 (+4%) | 8mo | $151,000 | $141 | 53 |
| 1605 Hazel Ave | 0.47mi | 2/2.0 (-1) | 1,140 (+11%) | 2mo | $160,000 | $140 | 49 |
| 1607 W Wayne St | 0.66mi | 2/1.5 (-1) | 1,176 (+15%) | 0mo | $125,000 | $106 | 38 |
Match score weights: distance 35% · size 25% · config 20% · recency 20%. Top-matched comps best support the ARV.
Projected returns pro-forma
-3.0% appreciation · 3.0% rent growth · sell at horizon
- IRR
- -0.2%
- Equity multiple
- 0.99×
- Total profit
- $-281
- Equity at exit
- $25,333
- IRR
- 9.5%
- Equity multiple
- 1.73×
- Total profit
- $34,772
- Equity at exit
- $14,690
Cash invested: $47,572 (down + closing). Projections, not guarantees.
Landlord ↔ Tenant lean methodology
- Overall (STATE)
- 73 Landlord-Friendly
- State Ohio
- 73 Landlord-Friendly · R+6
- County
- — inherits STATE
- City
- — inherits STATE
ZIP-level market 45805
- Active inventory
- 105
- Price-to-rent
- 7.4×
Monthly cashflow live
- Estimated rent
- $1,915 medium interval (Pro) →
- Mortgage (P&I)
- −$891
- Tax from tax record
- −$122 /mo · $1,470/yr
- Insurance
- −$71
- HOA
- −$0
- Vacancy / Maint / Mgmt
- −$402
- Net cashflow
- $428
Break-even live
UW: 25.0% down · 7.5% · 30yr · 1.5% tax · 5.0% vac · 8.0% maint · 8.0% mgmt
Financing live
Cash to close
- Down payment
- $42,475
- Closing costs
- $5,097
- Reserves months
- —
- Total cash needed
- —
Loan-product check · same deal, 3 products live
Conventional
25% down · 7.5% · 30yr
- Down + closing
- —
- Monthly P&I
- —
- Monthly cashflow
- —
- DSCR
- —
- Eligible?
- —
Personal DTI + credit; lowest rate.
DSCR
20% down · 8.5% · 30yr
- Down + closing
- —
- Monthly P&I
- —
- Monthly cashflow
- —
- DSCR
- —
- Eligible?
- —
No personal income docs; deal must DSCR.
Hard money
10% down · 12.0% · 12mo
- Down + closing
- —
- Monthly P&I
- —
- Monthly cashflow
- —
- DSCR
- —
- Eligible?
- —
Short-term bridge; refi at stabilization.
Rent comps 4 comps
| Address | Beds | Baths | Sqft | Rent | $/sqft | DOM | Units | Dist |
|---|---|---|---|---|---|---|---|---|
| 1436 W High St Lima, OH | 2.0 | 1.0 | 1205 | $895 | $0.74 | 43d | 1 | 0.93mi |
| 405 N Kenilworth Ave Lima, OH | 3.0 | 1.0 | 1352 | $1,795 | $1.33 | 43d | 1 | 0.94mi |
| 608 S Primrose Pl Lima, OH | 3.0 | 2.0 | 1200 | $2,500 | $2.08 | 43d | 1 | 1.21mi |
| 1014 W Market St Apt 3 Lima, OH | 2.0 | 1.0 | 800 | $1,400 | $1.75 | 43d | 1 | 1.27mi |
Listing history 8 events
-
2026-06-19days on market $169,900 Active 9 DOM
-
2026-06-18days on market $169,900 Active 8 DOM
-
2026-06-17days on market $169,900 Active 7 DOM
-
2026-06-16days on market $169,900 Active 6 DOM
-
2026-06-15days on market $169,900 Active 5 DOM
-
2026-06-14days on market $169,900 Active 3 DOM
-
2026-06-12remarks 699-char remark
-
2026-06-12$169,900 Active 2 DOM
ⓘ Source: listings_history table (triggers on properties + properties_extension) + one-shot
backfill from property_details.listing_events for pre-trigger history.
Tax reassessment forecast OH · Partial reset (capped growth)
- Current annual tax
- $1,470 · $122/mo
- Projected year-2 tax
- $2,060 · $172/mo
- Expected delta
- +$590/yr (+$49/mo · 40.2%)
ⓘ Screening estimate from a state-policy table — verify with the county assessor before closing.
Climate risk First Street
- Flood 1/10 Low FEMA zone X (unshaded) · 0% chance over 30 yrs
- Wildfire 1/10 Low
- Heat 3/10 Moderate 7 d/yr ≥100°F today · 18 d/yr by 30 yrs out
- Wind 2/10 Low
- Air quality 2/10 Low 1 unhealthy d/yr today · 2 by 30 yrs out
Nearby sold comps map
Loading sold comps map…
Walkable amenities ~0.75 mi
Loading nearby amenities…
Taxation est. · year 1
- Rental income
- $22,975
- − Mortgage interest
- −$9,517
- − Property taxes
- −$1,470
- − Insurance
- −$850
- − Repairs & maintenance
- −$1,838
- − Management
- −$1,838
- − Depreciation
- −$4,943
- Taxable income
- $2,520
- Est. tax owed @ 24.0%
- −$605
- After-tax cash flow
- $4,534/yr
For passive investors: Depreciation is non-cash, so a rental often shows a tax loss while cash-flowing — sheltering income. Rental losses are passive: they offset passive income freely, and up to $25,000/yr can offset ordinary (W-2) income if you actively participate and your MAGI is under $100k (phasing out to $0 by $150k); unused losses carry forward. On sale, claimed depreciation is recaptured at up to 25%, and gains may owe capital-gains tax (a 1031 exchange can defer both). Figures are a year-1 estimate at your 24.0% rate — not tax advice; consult a CPA.
Schools (NCES district)
- District
- Lima City
- NCES district ID
- 3904422
- Math proficiency
- 29% ▼ -13.00%
- Reading proficiency
- 36% ▼ -6.00%
- Median HH income
- $29,685
- Composite
- 26.31/100
- National rank
- #7243
- State rank
- #575 of 656 in OH
Livability — Lima
- Score
- 64/100
- State rank
- #787
- US rank
- #14288
Category grades
Schools grade is shown separately in the Schools card above.
Census & demographics
- Census place
- Lima, OH
- County
- Allen · 98,169 people
- City population
- 21,739
- Metro
- Lima, OH
- Population (ZIP)
- 24,746
- Household income
- $65,954
- Rent vs Own
- Severe rent burden
- 8.0
Population outlook (Allen County) Hauer SSP2
- Today (2025)
- 100,321 people
- By 2030
- 97,693 · -2.6%
- By 2040
- 91,802 · -8.5%
- By 2050
- 86,152 · -14.1%
- By 2075
- 73,659 · -26.6%
- By 2100
- 58,716 · -41.5%
Race, ethnicity, and origin ACS 2023
- Neighborhood character
- Predominantly White (74%)
- Race & ethnicity
- White 74% Black 15% Two or more races 6% Hispanic / Latino 4% Asian 1%
- Common ancestry
- Italian 2% Slovak 2% Romanian 2%
- Foreign-born
- 2% · Canada, Vietnam
- Languages at home
- 96% English-only · Spanish 1% Vietnamese 1%
Political lean MEDSL · Allen
- 2024 margin
- Solid R (+44.1) · D 27.5% · R 71.6%
- 2008→2024 swing
- -23.4pp toward R · 2008: -20.7pp · 2024: -44.1pp
- All cycles
- 2024: R+44.1 2020: R+39.5 2016: R+38.2 2012: R+25.7 2008: R+20.7
Not yet ingested
- Civics
- —
Market trends
- HPI YoY
- ▼ -156.78%
- Current HPI
- 210.6397
- Rent YoY
- —
- Metro
- —
- State GDP YoY
- ▲ 1.98%
- F500 in state
- 48
Industry mix (Fortune 500 HQ in OH)
| Industry | F500 HQs | Revenue |
|---|---|---|
| Insurance | 3 | $145B |
|
||
| Industrial Machinery | 3 | $49B |
|
||
| Financial Services | 3 | $24B |
|
||
| Consumer Goods | 2 | $93B |
|
||
| Aerospace / Defense | 2 | $47B |
|
||
| Utilities | 2 | $33B |
|
||
Price history
+161.8% since first listed4 events — show timeline
- 2026-06-09 Listed $169,900 WCARE
- 2014-06-06 Sold (Public Records) $50,000 Public Records
- 2014-06-06 Sold (MLS) $50,000 WCARE
- 2014-02-24 Listed $64,900 WCARE
Property tax history
+3.6%/yrLatest (2025): $1,470 · +0.0% YoY. Source: county tax records.
Cash-flow waterfall
monthlySold comps — $/sqft
last 12 mo · ≤1 miLoading sold comps…