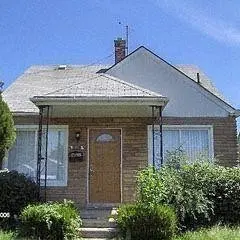
6850 Auburn St · Detroit, MI
Flood risk 1/10 · Minimal
- FEMA flood zone
- X (unshaded)
- Chance of flooding over 30 yrs
- 0.0%
- Est. flood insurance / yr
- $473 – $860
Fire risk 1/10 · Minimal
- Est. fire insurance / yr
- $784 – $1,456
Heat risk 3/10 · Minor
- Hot days now (above 99°F)
- 7 days/yr
- Hot days in 30 yrs
- 15 days/yr
Wind risk 2/10 · Minimal
- Chance of severe wind over 30 yrs
- —
Air-quality risk 3/10 · Minor
- Unhealthy air days now
- 2 days/yr
- Unhealthy air days in 30 yrs
- 4 days/yr
Risk factors via First Street. Map © Google.
Why this score? — see what drove the C+ grade
The composite is a weighted blend of 9 inputs, each scored 0–100. Each bar is that input's sub-score; the figure is the points it added to the 100-point composite (weight × sub-score).
- Cash flow +30.0/30.0
- 1% rule +10.0/10.0
- DSCR +10.0/10.0
- Livability +3.7/5.0
- ARV discount +3.2/15.0
- Condition / age +2.5/5.0
- Rent growth +1.9/5.0
- Schools +1.3/10.0
- Appreciation +0.0/10.0
$74,900
🖨 Deal sheet 📄 Offer letter ✓ Due diligence
Listing remarks MLS
GREAT STARTER HOME OR INVESTMENT!! AS-IS SALE, 3 BDRM BUNGALOW iN A DESIRABLE AREA . PRICED TO SELL .
Key facts
- 4,356 sq ft lot
- Garage
- Built 1949
Neighborhood map
What this means for you Summary
Snapshot
- This is a 3-bed/1.0-bath single-family listed at $75k.
Deal economics
- At list price, monthly cash flow is $629 ($8k/yr) — positive.
- The deal already cash-flows at list — no discount required.
- Meets the 1% rule at list price ($1k rent vs $75k).
- Recommended offer: $70k (6.0% below list) — sets the bar for market timing.
- Cap rate 16.4% vs local median 10.2% in Detroit — top-decile yield for the area; either an underpriced asset or a hidden risk that comps aren't pricing in. Stress-test before assuming the spread holds.
Location & tenants
- Location reads 73/100 on livability (#218 in MI) — a middle-class / working-renter tenant base. Strengths: amenities A+, commute A+, cost of living A+; Watch: schools F, crime F, employment F.
- Detroit Public Schools Community District (urban): math 10% / reading 24% proficiency, ranked #499 of 540 in MI (top 92%) — low school quality limits family demand, transient renter base, plan for 1-2y turnover; 90% free/reduced lunch — lower-income household profile, screen leases tightly.
- Market conditions: Rents soft (-2.3%/yr); 363 active listings in the ZIP; 18 comparable units currently listed for rent nearby; rentals at typical pace (median 18d on market — plan ~3-4 weeks tenant-placement turnaround); lower-income renter base — watch delinquency; 2,639 units permitted in Wayne County in 2024 (1,216 in 5+ unit buildings).
- At $1,372/mo this rent would consume 54% of the median local household income ($31k/yr) (locally 4144% of renters already pay >50% of income on rent) — very limited rent-growth headroom before tenants either downsize or default.
Forward outlook
- Local home prices are declining (-3.0%/yr); year-one equity from $518 of loan paydown is wiped out by about $2k of value loss. Plan a longer hold.
- Wayne County population projected at -17% by 2050 — secular population decline; favor cash flow + early exit over multi-decade hold.
- At projected returns (-3.0% appreciation + 0.0% rent growth), your $21k cash investment doubles in ~4 years — after that, you're playing with house money.
Negotiation context
- It's been on market 80 days — a 6% lower offer ($70k) is reasonable based on typical stale-listing flexibility.
- 14 sale attempts since 27y ago with the ask held roughly flat each time — persistent listings suggest the price (not the market) is what's stuck; bring a comps-based counter.
- Current owner paid $40k; list at $75k implies a 88% gain — meaningful room to come down on a strong offer.
Risks & watch-outs
- Watch-outs: built in 1949 — expect roof / HVAC / electrical / plumbing capex.
Questions for the listing agent
- It's been on market 80 days. Have you received any prior offers? Is the seller open to a 6% concession, seller financing, or rate buy-down credit?
- Built in 1949 — when were the roof, HVAC, electrical panel, plumbing, and water heater last replaced?
- Why hasn't it sold? Are there any deal-killer items the seller is aware of (foundation, flood, title, zoning, code violations)?
- Is there a deadline driving the sale (1031 exchange, divorce, estate, relocation)? That informs how much negotiation room exists.
- Schools are F-rated, which usually means shorter tenancies and higher turnover. Who's the typical renter profile here, and what's been the actual vacancy rate?
- Crime grade is F in this area — have there been break-ins, vandalism, or insurance claims at this property in the last 3 years? What carrier currently insures it and at what premium?
- What's the average days-on-market for RENTAL listings here right now (not sales)? A rising rental-DOM trend means longer vacancies and softer asking-rent achievability than the comps imply.
- What's the recent tenant-quality profile in this submarket — average credit score on applications, eviction rate, late-payment / NSF rate, and stable-employment percentage? A property-management company in the area should have these aggregated.
- How much new for-sale + rental construction is in the pipeline within 1–3 miles? Heavy new supply typically softens prices + rents 12–24 months out; constrained supply supports both.
Investment metrics
- 1% rule
- 1.83% ✓
- Cap rate
- 16.37%
- Cash-on-cash
- 35.99%
- DSCR
- 2.60
- GRM
- 4.6
CMA / ARV
- ARV (on-the-fly)
- $68,352
- Comps found
- 12
Show comp detail 12 sales within ~0.75 mi
| Address | Dist | Beds/Ba | Sqft | Sold | Price | $/sf | Match |
|---|---|---|---|---|---|---|---|
| 6394 Westwood St | 0.32mi | 3/1.0 | 770 (+0%) | 2mo | $90,000 | $117 | 83 |
| 7313 Grandville Ave | 0.27mi | 2/1.0 (-1) | 765 (-0%) | 0mo | $70,000 | $92 | 81 |
| 7320 Westwood St | 0.26mi | 3/1.0 | 738 (-4%) | 2mo | $115,000 | $156 | 79 |
| 7275 Auburn St | 0.19mi | 3/1.0 | 803 (+5%) | 5mo | $60,000 | $75 | 79 |
| 7282 Plainview Ave | 0.20mi | 2/1.0 (-1) | 730 (-5%) | 1mo | $19,000 | $26 | 77 |
| 6783 Westwood St | 0.11mi | 3/1.0 | 836 (+9%) | 4mo | $65,000 | $78 | 76 |
| 6803 Grandville Ave | 0.16mi | 2/1.0 (-1) | 700 (-9%) | 2mo | $32,000 | $46 | 71 |
| 7280 Heyden St | 0.32mi | 2/1.5 (-1) | 739 (-4%) | 4mo | $75,000 | $101 | 68 |
| 7730 Braile St | 0.70mi | 3/1.0 | 768 (0%) | 2mo | $68,000 | $89 | 66 |
| 6752 Evergreen Rd | 0.15mi | 2/1.0 (-1) | 864 (+12%) | 3mo | $45,000 | $52 | 65 |
| 6078 Plainview Ave | 0.57mi | 2/1.0 (-1) | 700 (-9%) | 1mo | $54,500 | $78 | 53 |
| 7756 Westwood St | 0.53mi | 3/1.0 | 871 (+13%) | 2mo | $90,000 | $103 | 52 |
Match score weights: distance 35% · size 25% · config 20% · recency 20%. Top-matched comps best support the ARV.
Projected returns pro-forma
-3.0% appreciation · 0.0% rent growth · sell at horizon
- IRR
- 28.4%
- Equity multiple
- 2.14×
- Total profit
- $23,884
- Equity at exit
- $11,168
- IRR
- 34.1%
- Equity multiple
- 3.71×
- Total profit
- $56,773
- Equity at exit
- $6,476
Cash invested: $20,972 (down + closing). Projections, not guarantees.
Landlord ↔ Tenant lean methodology
- Overall (STATE)
- 62 Landlord-Friendly
- State Michigan
- 62 Landlord-Friendly · EVEN
- County
- — inherits STATE
- City
- — inherits STATE
ZIP-level market 48228
- Rents YoY
- -2.3%
- Active inventory
- 363
- Price-to-rent
- 4.6×
Monthly cashflow live
- Estimated rent
- $1,372 high interval (Pro) →
- Mortgage (P&I)
- −$393
- Tax from tax record
- −$31 /mo · $367/yr
- Insurance
- −$31
- HOA
- −$0
- Vacancy / Maint / Mgmt
- −$288
- Net cashflow
- $629
Break-even live
UW: 25.0% down · 7.5% · 30yr · 1.5% tax · 5.0% vac · 8.0% maint · 8.0% mgmt
Financing live
Cash to close
- Down payment
- $18,725
- Closing costs
- $2,247
- Reserves months
- —
- Total cash needed
- —
Loan-product check · same deal, 3 products live
Conventional
25% down · 7.5% · 30yr
- Down + closing
- —
- Monthly P&I
- —
- Monthly cashflow
- —
- DSCR
- —
- Eligible?
- —
Personal DTI + credit; lowest rate.
DSCR
20% down · 8.5% · 30yr
- Down + closing
- —
- Monthly P&I
- —
- Monthly cashflow
- —
- DSCR
- —
- Eligible?
- —
No personal income docs; deal must DSCR.
Hard money
10% down · 12.0% · 12mo
- Down + closing
- —
- Monthly P&I
- —
- Monthly cashflow
- —
- DSCR
- —
- Eligible?
- —
Short-term bridge; refi at stabilization.
Rent comps 18 comps
| Address | Beds | Baths | Sqft | Rent | $/sqft | DOM | Units | Dist |
|---|---|---|---|---|---|---|---|---|
| 7635 Evergreen Ave Detroit, MI | 3.0 | 1.0 | 690 | $1,350 | $1.96 | 43d | 1 | 0.40mi |
| 7411 Stout St Detroit, MI | 3.0 | 1.0 | 888 | $1,428 | $1.61 | 12d | 1 | 0.43mi |
| 6490 Stahelin Ave Detroit, MI | 3.0 | 1.0 | 960 | $1,299 | $1.35 | 16d | 1 | 0.52mi |
| 7794 Vaughan St Detroit, MI | 3.0 | 1.0 | 1000 | $1,450 | $1.45 | 16d | 1 | 0.55mi |
| 20431 Tireman St Detroit, MI | 3.0 | 1.0 | 1020 | $1,350 | $1.32 | 17d | 1 | 0.66mi |
| 5965 Evergreen Rd Dearborn Heights, MI | 1.0–2.0 | 1.0 | 825 | $1,350 | $1.64 | 5d | 1 | 0.70mi |
| 8283 Vaughan St Detroit, MI | 3.0 | 1.0 | 1058 | $1,294 | $1.22 | 4d | 1 | 0.81mi |
| 5777 Southfield Fwy Detroit, MI | 2.0 | 1.0–2.0 | 667 | $1,540 | $2.31 | 3d | 10 | 1.00mi |
| 8270 Trinity St Detroit, MI | 3.0 | 1.0 | 806 | $1,528 | $1.90 | 43d | 1 | 1.02mi |
| 19301 Joy Rd Apt 1 Detroit, MI | 2.0 | 1.0 | 750 | $1,100 | $1.47 | 43d | 1 | 1.07mi |
| 8262 Rosemont Ave Detroit, MI | 3.0 | 1.0 | 836 | $1,200 | $1.44 | 4d | 1 | 1.08mi |
| 5521 Fairlane Woods Dr Dearborn, MI | 1.0–3.0 | 1.0–2.0 | 1164 | $2,430 | $2.09 | 1d | 12 | 1.11mi |
| 6761 Memorial Ave Detroit, MI | 3.0 | 1.0 | 1060 | $1,100 | $1.04 | 24d | 1 | 1.12mi |
| 8451 Rosemont Ave Detroit, MI | 3.0 | 1.0 | 867 | $1,150 | $1.33 | 43d | 1 | 1.15mi |
| 22330 W Warren Ave Redford Charter Twp, MI | 2.0 | 1.0 | 750 | $1,200 | $1.60 | 43d | 1 | 1.27mi |
| 8850 Rosemont Ave Detroit, MI | 3.0 | 1.0 | 933 | $1,100 | $1.18 | 17d | 1 | 1.37mi |
| 9090 Stahelin Ave Detroit, MI | 2.0 | 1.0 | 787 | $1,250 | $1.59 | 43d | 1 | 1.37mi |
| 9059 Burt Rd Detroit, MI | 3.0 | 1.0 | 980 | $1,400 | $1.43 | 43d | 1 | 1.41mi |
Listing history 35 events
-
2024-12-17status Pending 102-char remark
Show marketing remark (102 chars)
GREAT STARTER HOME OR INVESTMENT!! AS-IS SALE, 3 BDRM BUNGALOW iN A DESIRABLE AREA . PRICED TO SELL .
-
2024-03-23status Pending 102-char remark
Show marketing remark (101 chars)
GREAT STARTER HOME OR INVESTMENT!! AS-IS SALE, 3 BDRM BUNGALOW iN A DESIRABLE AREA . PRICED TO SELL .
-
2024-03-23status Pending
Show marketing remark (101 chars)
GREAT STARTER HOME OR INVESTMENT!! AS-IS SALE, 3 BDRM BUNGALOW iN A DESIRABLE AREA . PRICED TO SELL .
-
2024-03-23historical 101-char remark
Show marketing remark (101 chars)
GREAT STARTER HOME OR INVESTMENT!! AS-IS SALE, 3 BDRM BUNGALOW iN A DESIRABLE AREA . PRICED TO SELL .
-
2024-01-01historical
-
2024-01-01historical
-
2023-12-26$74,900 Active 102-char remark
Show marketing remark (101 chars)
GREAT STARTER HOME OR INVESTMENT!! AS-IS SALE, 3 BDRM BUNGALOW iN A DESIRABLE AREA . PRICED TO SELL .
-
2023-12-26$74,900 Active
Show marketing remark (101 chars)
GREAT STARTER HOME OR INVESTMENT!! AS-IS SALE, 3 BDRM BUNGALOW iN A DESIRABLE AREA . PRICED TO SELL .
-
2023-12-26$74,900 101-char remark
Show marketing remark (101 chars)
GREAT STARTER HOME OR INVESTMENT!! AS-IS SALE, 3 BDRM BUNGALOW iN A DESIRABLE AREA . PRICED TO SELL .
-
2023-12-13$74,900 Active
-
2023-12-13$74,900 Active
-
2006-12-04soldstatus $39,900
-
2006-11-04soldstatus $39,900
-
2006-10-12historical
-
2006-10-04$39,900
-
2006-10-04$39,900
-
2005-08-22historical
-
2005-07-22$87,000
-
2005-07-19historical
-
2005-04-19$87,000
-
2004-06-08soldstatus $91,000
-
2004-01-16historical
-
2003-12-19$120,000
-
2003-02-12soldstatus $50,500
-
2003-02-12soldstatus $50,500
-
2003-02-12soldstatus $50,500
-
2002-12-04historical
-
2002-11-29$41,000
-
2002-11-27$41,000
-
2002-11-27$41,000
-
2002-03-22soldstatus $85,935
-
2001-07-20soldstatus $83,500
-
2000-03-22soldstatus $50,000
-
1999-09-29soldstatus $50,000
-
1999-08-02$49,900
ⓘ Source: listings_history table (triggers on properties + properties_extension) + one-shot
backfill from property_details.listing_events for pre-trigger history.
Tax reassessment forecast MI · Partial reset (capped growth)
- Current annual tax
- $367 · $31/mo
- Projected year-2 tax
- $760 · $63/mo
- Expected delta
- +$393/yr (+$33/mo · 107.2%)
ⓘ Screening estimate from a state-policy table — verify with the county assessor before closing.
Climate risk First Street
- Flood 1/10 Low FEMA zone X (unshaded) · 0% chance over 30 yrs
- Wildfire 1/10 Low
- Heat 3/10 Moderate 7 d/yr ≥99°F today · 15 d/yr by 30 yrs out
- Wind 2/10 Low
- Air quality 3/10 Moderate 2 unhealthy d/yr today · 4 by 30 yrs out
Nearby sold comps map
Loading sold comps map…
Walkable amenities ~0.75 mi
Loading nearby amenities…
Taxation est. · year 1
- Rental income
- $16,459
- − Mortgage interest
- −$4,196
- − Property taxes
- −$367
- − Insurance
- −$374
- − Repairs & maintenance
- −$1,317
- − Management
- −$1,317
- − Depreciation
- −$2,179
- Taxable income
- $6,709
- Est. tax owed @ 24.0%
- −$1,610
- After-tax cash flow
- $5,937/yr
For passive investors: Depreciation is non-cash, so a rental often shows a tax loss while cash-flowing — sheltering income. Rental losses are passive: they offset passive income freely, and up to $25,000/yr can offset ordinary (W-2) income if you actively participate and your MAGI is under $100k (phasing out to $0 by $150k); unused losses carry forward. On sale, claimed depreciation is recaptured at up to 25%, and gains may owe capital-gains tax (a 1031 exchange can defer both). Figures are a year-1 estimate at your 24.0% rate — not tax advice; consult a CPA.
Schools (NCES district)
- District
- Detroit Public Schools Community District
- NCES district ID
- 2601103
- Math proficiency
- 10% ▼ -2.00%
- Reading proficiency
- 24% ▲ 6.00%
- Median HH income
- $25,815
- Composite
- 13.06/100
- National rank
- #9564
- State rank
- #499 of 540 in MI
Livability — Detroit
- Score
- 73/100
- State rank
- #218
- US rank
- #5427
Category grades
Schools grade is shown separately in the Schools card above.
Census & demographics
- Census place
- Detroit, MI
- County
- Wayne County · 1,562,939 people
- City population
- 572,865
- Metro
- Detroit-Warren-Dearborn, MI
- Population (ZIP)
- 50,117
- Household income
- $30,680
- Rent vs Own
- Severe rent burden
- 4144.0
Population outlook (Wayne County) Hauer SSP2
- Today (2025)
- 1,675,273 people
- By 2030
- 1,620,300 · -3.3%
- By 2040
- 1,502,341 · -10.3%
- By 2050
- 1,384,039 · -17.4%
- By 2075
- 1,124,592 · -32.9%
- By 2100
- 881,193 · -47.4%
Race, ethnicity, and origin ACS 2023
- Neighborhood character
- Predominantly Black (71%)
- Race & ethnicity
- Black 71% White 16% Two or more races 7% Hispanic / Latino 6%
- Hispanic origin (detail)
- Mexican 3% Puerto Rican 2%
- Common ancestry
- Arab 2% Romanian 2% Lithuanian 1%
- Foreign-born
- 11% · Canada
- Languages at home
- 82% English-only · Arabic 11% Spanish 5%
Political lean MEDSL · Wayne
- 2024 margin
- Strong D (+29.0) · D 62.7% · R 33.7% · Other 3.6%
- 2008→2024 swing
- -20.5pp toward R · 2008: 49.5pp · 2024: 29.0pp
- All cycles
- 2024: D+29.0 2020: D+38.1 2016: D+37.3 2012: D+46.9 2008: D+49.5
Not yet ingested
- Civics
- —
Market trends
- HPI YoY
- ▼ -160.81%
- Current HPI
- 168.6843
- Rent YoY
- ▼ -2.30%
- Metro
- Detroit-Warren-Dearborn, MI
- State GDP YoY
- ▲ 1.37%
- F500 in state
- 28
Industry mix (Fortune 500 HQ in MI)
| Industry | F500 HQs | Revenue |
|---|---|---|
| Automotive Parts | 3 | $48B |
|
||
| Automotive | 2 | $372B |
|
||
| Chemicals | 1 | $45B |
|
||
| Automotive Retail | 1 | $29B |
|
||
| Healthcare / Medical Devices | 1 | $23B |
|
||
| Automotive Technology | 1 | $20B |
|
||
Price history
+50.1% since first listed35 events — show timeline
- 2024-12-17 Pending — REALCOMP
- 2024-03-23 Pending — REALCOMP
- 2024-03-23 Pending — SW Michigan MLS
- 2024-03-23 Listing Removed — MiRealSource-MiMLS
- 2024-01-01 Listing Removed — MiRealSource-MiMLS
- 2024-01-01 Listing Removed — REALCOMP
- 2023-12-26 Listed $74,900 MiRealSource-MiMLS
- 2023-12-26 Listed $74,900 SW Michigan MLS
- 2023-12-26 Listed $74,900 REALCOMP
- 2023-12-13 Listed $74,900 MiRealSource-MiMLS
- 2023-12-13 Listed $74,900 REALCOMP
- 2006-12-04 Sold (MLS) $39,900 MiRealSource-MiMLS
- 2006-11-04 Sold (MLS) $39,900 REALCOMP
- 2006-10-12 Listing Removed — MiRealSource-MiMLS
- 2006-10-04 Listed $39,900 REALCOMP
- 2006-10-04 Listed $39,900 MiRealSource-MiMLS
- 2005-08-22 Listing Removed — REALCOMP
- 2005-07-22 Listed $87,000 REALCOMP
- 2005-07-19 Listing Removed — REALCOMP
- 2005-04-19 Listed $87,000 REALCOMP
- 2004-06-08 Sold (Public Records) $91,000 Public Records
- 2004-01-16 Listing Removed — REALCOMP
- 2003-12-19 Listed $120,000 REALCOMP
- 2003-02-12 Sold (MLS) $50,500 MiRealSource-MiMLS
- 2003-02-12 Sold (MLS) $50,500 REALCOMP
- 2003-02-12 Sold (MLS) $50,500 REALCOMP
- 2002-12-04 Listing Removed — MiRealSource-MiMLS
- 2002-11-29 Listed $41,000 REALCOMP
- 2002-11-27 Listed $41,000 MiRealSource-MiMLS
- 2002-11-27 Listed $41,000 REALCOMP
- 2002-03-22 Sold (Public Records) $85,935 Public Records
- 2001-07-20 Sold (Public Records) $83,500 Public Records
- 2000-03-22 Sold (Public Records) $50,000 Public Records
- 1999-09-29 Sold (MLS) $50,000 REALCOMP
- 1999-08-02 Listed $49,900 REALCOMP
Property tax history
-11.5%/yrLatest (2025): $367 · -51.7% YoY. Source: county tax records.
Cash-flow waterfall
monthlySold comps — $/sqft
last 12 mo · ≤1 miLoading sold comps…