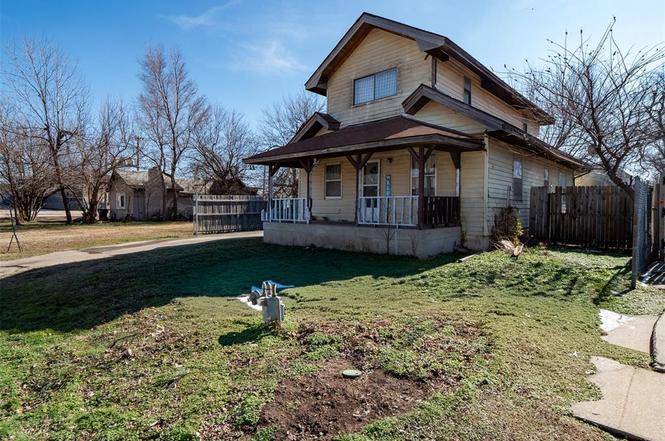
517 W Woodson Ave · El Reno, OK
Flood risk 1/10 · Minimal
- FEMA flood zone
- X (unshaded)
- Chance of flooding over 30 yrs
- 0.0%
- Est. flood insurance / yr
- $507 – $1,088
Fire risk 1/10 · Minimal
- Est. fire insurance / yr
- $2,463 – $4,575
Heat risk 6/10 · Moderate
- Hot days now (above 107°F)
- 7 days/yr
- Hot days in 30 yrs
- 19 days/yr
Wind risk 2/10 · Minimal
- Chance of severe wind over 30 yrs
- 2.0%
Air-quality risk 2/10 · Minimal
- Unhealthy air days now
- 1 days/yr
- Unhealthy air days in 30 yrs
- 2 days/yr
Risk factors via First Street. Map © Google.
Why this score? — see what drove the B grade
The composite is a weighted blend of 9 inputs, each scored 0–100. Each bar is that input's sub-score; the figure is the points it added to the 100-point composite (weight × sub-score).
- Cash flow +29.0/30.0
- ARV discount +15.0/15.0
- DSCR +10.0/10.0
- 1% rule +7.4/10.0
- Rent growth +3.5/5.0
- Livability +3.4/5.0
- Condition / age +2.5/5.0
- Schools +1.2/10.0
- Appreciation +0.0/10.0
$111,460
🖨 Deal sheet 📄 Offer letter ✓ Due diligence
Listing remarks MLS
Great house to fix up. If you are handy at remodeling here it is.
Key facts
- Central el reno
- New back patio
- 6,251 sq ft lot
Tags
Property features AI
Finance
- Other: Homestead not claimed; No historical designation; Occupied; Price reduced
- Financial info: Loan qualification allowed; Not assumable
- HOA & community: No mandatory association dues
Exterior
- Home design: Single family residence; Two-story; North-facing; Residential property; Existing property
- Construction: Frame construction; Composition roof; Conventional foundation
- Exterior features: Covered patio; Covered porch; Wood fencing; Interior lot
Interior
- Bedrooms: 3 bedrooms
- Bathrooms: 1 full bathroom
- Interior features: One living area; No fireplace
Neighborhood map
What this means for you Summary
Snapshot
- This is a 3-bed/1.0-bath single-family listed at $111k.
Deal economics
- At list price, monthly cash flow is $382 ($5k/yr) — positive.
- The deal already cash-flows at list — no discount required.
- Meets the 1% rule at list price ($1k rent vs $111k).
- Recommended offer: $98k (12.0% below list) — sets the bar for market timing.
- Cap rate 10.4% vs local median 4.8% in El Reno — top-decile yield for the area; either an underpriced asset or a hidden risk that comps aren't pricing in. Stress-test before assuming the spread holds.
Location & tenants
- Location reads 67/100 on livability (#95 in OK) — a middle-class / working-renter tenant base. Strengths: cost of living A+, housing A+, crime B+; Watch: health & safety C-, amenities F, commute F.
- El Reno (town): math 12% / reading 15% proficiency, ranked #232 of 270 in OK (top 86%) — low school quality limits family demand, transient renter base, plan for 1-2y turnover; 68% free/reduced lunch — lower-income household profile, screen leases tightly.
- Zoned schools: Hillcrest Es (325 students, 0% FRL); El Reno Hs (math 16% / reading 19%, grade F, #307 of 447 statewide, top 69%, 980 students, 0% FRL) — zoned schools average 0% FRL vs 68% district-wide (68 pts lower); this property's tenant base skews higher-income than the district average.
- Market conditions: Rents rising fast (+4.2%/yr); 280 active listings in the ZIP; 12 comparable units currently listed for rent nearby; rentals leasing fast (median 2d on market — plan ~1-2 weeks tenant-placement turnaround); 260 units permitted in Canadian County in 2024 (0 in 5+ unit buildings).
Forward outlook
- Local home prices are declining (-3.0%/yr); year-one equity from $771 of loan paydown is wiped out by about $3k of value loss. Plan a longer hold.
- Canadian County population projected at +64% by 2050 — long-run rental-demand tailwind backs the buy-and-hold thesis.
- At projected returns (-3.0% appreciation + 4.2% rent growth), your $31k cash investment doubles in ~8 years — after that, you're playing with house money.
Negotiation context
- It's been on market 129 days — a 12% lower offer ($98k) is reasonable based on typical stale-listing flexibility.
- 5 sale attempts since 4y ago; this cycle's ask has dropped $19k (14%) from the opening price — seller is motivated, your offer sets the floor, not the list.
- Current owner paid $56k; list at $111k implies a 99% gain — meaningful room to come down on a strong offer.
Risks & watch-outs
- Watch-outs: built in 1940 — expect roof / HVAC / electrical / plumbing capex.
- Climate carrying-cost: extreme-heat days projected 7→19/yr by 2055 (HVAC capex compounding) — expect insurance premiums to compound above CPI over the hold.
Questions for the listing agent
- It's been on market 129 days. Have you received any prior offers? Is the seller open to a 12% concession, seller financing, or rate buy-down credit?
- Built in 1940 — when were the roof, HVAC, electrical panel, plumbing, and water heater last replaced?
- Why hasn't it sold? Are there any deal-killer items the seller is aware of (foundation, flood, title, zoning, code violations)?
- Is there a deadline driving the sale (1031 exchange, divorce, estate, relocation)? That informs how much negotiation room exists.
- Schools are F-rated, which usually means shorter tenancies and higher turnover. Who's the typical renter profile here, and what's been the actual vacancy rate?
- What's the average days-on-market for RENTAL listings here right now (not sales)? A rising rental-DOM trend means longer vacancies and softer asking-rent achievability than the comps imply.
- What's the recent tenant-quality profile in this submarket — average credit score on applications, eviction rate, late-payment / NSF rate, and stable-employment percentage? A property-management company in the area should have these aggregated.
- How much new for-sale + rental construction is in the pipeline within 1–3 miles? Heavy new supply typically softens prices + rents 12–24 months out; constrained supply supports both.
Investment metrics
- 1% rule
- 1.24% ✓
- Cap rate
- 10.41%
- Cash-on-cash
- 14.69%
- DSCR
- 1.65
- GRM
- 6.7
CMA / ARV
- ARV (on-the-fly)
- $176,358
- Comps found
- 12
Show comp detail 12 sales within ~0.75 mi
| Address | Dist | Beds/Ba | Sqft | Sold | Price | $/sf | Match |
|---|---|---|---|---|---|---|---|
| 413 N Rock Island Ave | 0.41mi | 3/2.0 | 1,314 (-1%) | 3mo | $183,500 | $140 | 73 |
| 111 N Admire Ave | 0.10mi | 2/1.0 (-1) | 1,218 (-8%) | 6mo | $139,000 | $114 | 72 |
| 901 W Wade St | 0.26mi | 3/2.5 | 1,364 (+3%) | 8mo | $155,000 | $114 | 70 |
| 718 S Choctaw Ave | 0.45mi | 3/2.0 | 1,360 (+3%) | 3mo | $181,000 | $133 | 68 |
| 518 S Ellison Ave | 0.30mi | 3/2.0 | 1,442 (+9%) | 1mo | $207,800 | $144 | 67 |
| 709 S Hadden St | 0.48mi | 2/1.0 (-1) | 1,297 (-2%) | 5mo | $100,000 | $77 | 64 |
| 520 S Reno Ave | 0.36mi | 4/2.0 (+1) | 1,256 (-5%) | 1mo | $176,000 | $140 | 64 |
| 605 W Cheyenne St | 0.38mi | 3/2.0 | 1,200 (-10%) | 4mo | $160,000 | $133 | 59 |
| 1117 W London St | 0.44mi | 3/2.0 | 1,508 (+14%) | 6mo | $136,000 | $90 | 48 |
| 819 S Macomb Ave | 0.68mi | 3/1.5 | 1,507 (+14%) | 1mo | $180,900 | $120 | 43 |
| 1501 W Watts St | 0.72mi | 3/1.5 | 1,175 (-11%) | 4mo | $169,000 | $144 | 42 |
| 811 S Hoff Ave | 0.72mi | 2/1.0 (-1) | 1,448 (+9%) | 7mo | $175,000 | $121 | 40 |
Match score weights: distance 35% · size 25% · config 20% · recency 20%. Top-matched comps best support the ARV.
Projected returns pro-forma
-3.0% appreciation · 4.19% rent growth · sell at horizon
- IRR
- 6.4%
- Equity multiple
- 1.25×
- Total profit
- $7,928
- Equity at exit
- $16,619
- IRR
- 16.8%
- Equity multiple
- 2.45×
- Total profit
- $45,220
- Equity at exit
- $9,637
Cash invested: $31,209 (down + closing). Projections, not guarantees.
Landlord ↔ Tenant lean methodology
- Overall (STATE)
- 83 Strongly Landlord-Friendly
- State Oklahoma
- 83 Strongly Landlord-Friendly · R+20
- County
- — inherits STATE
- City
- — inherits STATE
ZIP-level market 73036
- Home prices YoY
- -3.3%
- Rents YoY
- 4.2%
- Active inventory
- 280
- Price-to-rent
- 6.7×
Monthly cashflow live
- Estimated rent
- $1,384 high interval (Pro) →
- Mortgage (P&I)
- −$585
- Tax from tax record
- −$81 /mo · $970/yr
- Insurance
- −$46
- HOA
- −$0
- Vacancy / Maint / Mgmt
- −$291
- Net cashflow
- $382
Break-even live
UW: 25.0% down · 7.5% · 30yr · 1.5% tax · 5.0% vac · 8.0% maint · 8.0% mgmt
Financing live
Cash to close
- Down payment
- $27,865
- Closing costs
- $3,344
- Reserves months
- —
- Total cash needed
- —
Loan-product check · same deal, 3 products live
Conventional
25% down · 7.5% · 30yr
- Down + closing
- —
- Monthly P&I
- —
- Monthly cashflow
- —
- DSCR
- —
- Eligible?
- —
Personal DTI + credit; lowest rate.
DSCR
20% down · 8.5% · 30yr
- Down + closing
- —
- Monthly P&I
- —
- Monthly cashflow
- —
- DSCR
- —
- Eligible?
- —
No personal income docs; deal must DSCR.
Hard money
10% down · 12.0% · 12mo
- Down + closing
- —
- Monthly P&I
- —
- Monthly cashflow
- —
- DSCR
- —
- Eligible?
- —
Short-term bridge; refi at stabilization.
Rent comps 12 comps
| Address | Beds | Baths | Sqft | Rent | $/sqft | DOM | Units | Dist |
|---|---|---|---|---|---|---|---|---|
| 605 W Clarke St El Reno, OK | 3.0 | 2.0 | 1768 | $1,395 | $0.79 | 1d | 1 | 0.31mi |
| 607 N Evans Ave El Reno, OK | 2.0 | 1.0 | 1032 | $1,025 | $0.99 | 1d | 1 | 0.38mi |
| 819 S Wilson Ave El Reno, OK | 3.0 | 2.0 | 1200 | $1,325 | $1.10 | 4d | 1 | 0.61mi |
| 819 S Wilson Ave Unit 819 El Reno, OK | 3.0 | 2.0 | 1200 | $1,325 | $1.10 | 1d | 1 | 0.61mi |
| 1031 S Ellison Ave El Reno, OK | 3.0 | 2.0 | 1601 | $1,500 | $0.94 | 1d | 1 | 0.81mi |
| 1109 S Ellison Ave El Reno, OK | 2.0 | 2.0 | 1595 | $1,360 | $0.85 | 1d | 1 | 0.90mi |
| 1320 E Cavanaugh St El Reno, OK | 3.0 | 2.0 | 1222 | $1,400 | $1.15 | 10d | 1 | 1.29mi |
| 1915 S Jensen Ave El Reno, OK | 3.0 | 1.5 | 1402 | $1,400 | $1.00 | 1d | 1 | 1.32mi |
| 1543 Pavy Pkwy El Reno, OK | 3.0 | 2.0 | 1200 | $1,295 | $1.08 | 1d | 1 | 1.37mi |
| 1541 Pavy Pkwy El Reno, OK | 3.0 | 2.0 | 1200 | $1,295 | $1.08 | 1d | 1 | 1.40mi |
| 1541 Pavy Pkwy El Reno, OK | 3.0 | 2.0 | 1200 | $1,295 | $1.08 | 4d | 1 | 1.40mi |
| 702 Amity Ln El Reno, OK | 2.0 | 2.0 | 1487 | $1,550 | $1.04 | 1d | 1 | 1.40mi |
Listing history 31 events
-
2026-06-18days on market $111,460 Active 129 DOM
-
2026-06-17days on market $111,460 Active 128 DOM
-
2026-06-16days on market $111,460 Active 127 DOM
-
2026-06-16price $111,460 Active 126 DOM
-
2026-06-15days on market $117,325 Active 126 DOM
-
2026-06-13days on market $117,325 Active 124 DOM
-
2026-06-13days on market $117,325 Active 123 DOM
-
2026-06-09days on market $117,325 Active 120 DOM
-
2026-06-08days on market $117,325 Active 119 DOM
-
2026-06-07days on market $117,325 Active 118 DOM
-
2026-06-05days on market $117,325 Active 115 DOM
-
2026-06-03days on market $117,325 Active 114 DOM
-
2026-06-02days on market $117,325 Active 113 DOM
-
2026-06-01days on market $117,325 Active 112 DOM
-
2026-05-31days on market $117,325 Active 111 DOM
-
2026-05-03price $117,325
-
2026-03-22price $123,500
-
2026-02-08$130,000 Active
-
2024-11-11historical $950
-
2024-10-15$950
-
2023-11-09soldstatus $56,000
-
2023-11-08soldstatus $56,000 Closed 65-char remark
Show marketing remark (65 chars)
Great house to fix up. If you are handy at remodeling here it is.
-
2023-09-25status Pending 65-char remark
Show marketing remark (65 chars)
Great house to fix up. If you are handy at remodeling here it is.
-
2023-08-23price $63,777 65-char remark
Show marketing remark (65 chars)
Great house to fix up. If you are handy at remodeling here it is.
-
2023-05-11$69,500 Active 65-char remark
Show marketing remark (65 chars)
Great house to fix up. If you are handy at remodeling here it is.
-
2023-02-26historical
-
2023-01-10status Pending
-
2023-01-10status Active
-
2023-01-06historical
-
2022-07-23$58,500 Active
-
1996-08-12soldstatus $17,000
ⓘ Source: listings_history table (triggers on properties + properties_extension) + one-shot
backfill from property_details.listing_events for pre-trigger history.
Tax reassessment forecast OK · Resets to sale price
- Current annual tax
- $970 · $81/mo
- Projected year-2 tax
- $1,003 · $84/mo
- Expected delta
- +$33/yr (+$3/mo · 3.4%)
ⓘ Screening estimate from a state-policy table — verify with the county assessor before closing.
Climate risk First Street
- Flood 1/10 Low FEMA zone X (unshaded) · 0% chance over 30 yrs
- Wildfire 1/10 Low
- Heat 6/10 Major 7 d/yr ≥107°F today · 19 d/yr by 30 yrs out
- Wind 2/10 Low 2% chance of damaging wind over 30 yrs
- Air quality 2/10 Low 1 unhealthy d/yr today · 2 by 30 yrs out
Nearby sold comps map
Loading sold comps map…
Walkable amenities ~0.75 mi
Loading nearby amenities…
Taxation est. · year 1
- Rental income
- $16,614
- − Mortgage interest
- −$6,243
- − Property taxes
- −$970
- − Insurance
- −$557
- − Repairs & maintenance
- −$1,329
- − Management
- −$1,329
- − Depreciation
- −$3,242
- Taxable income
- $2,942
- Est. tax owed @ 24.0%
- −$706
- After-tax cash flow
- $3,877/yr
For passive investors: Depreciation is non-cash, so a rental often shows a tax loss while cash-flowing — sheltering income. Rental losses are passive: they offset passive income freely, and up to $25,000/yr can offset ordinary (W-2) income if you actively participate and your MAGI is under $100k (phasing out to $0 by $150k); unused losses carry forward. On sale, claimed depreciation is recaptured at up to 25%, and gains may owe capital-gains tax (a 1031 exchange can defer both). Figures are a year-1 estimate at your 24.0% rate — not tax advice; consult a CPA.
Schools (NCES district)
- District
- El Reno
- NCES district ID
- 4010650
- Math proficiency
- 12% ▼ -15.00%
- Reading proficiency
- 15% ▼ -9.00%
- Median HH income
- $44,689
- Composite
- 12.01/100
- National rank
- #9664
- State rank
- #232 of 270 in OK
Livability — El Reno
- Score
- 67/100
- State rank
- #95
- US rank
- #10933
Category grades
Schools grade is shown separately in the Schools card above.
Census & demographics
- Census place
- El Reno, OK
- County
- Canadian County · 154,341 people
- City population
- 21,387
- Metro
- Oklahoma City, OK
- Population (ZIP)
- 21,387
- Household income
- $59,915
- Rent vs Own
- Severe rent burden
- 580.0
Population outlook (Canadian County) Hauer SSP2
- Today (2025)
- 174,062 people
- By 2030
- 195,170 · +12.1%
- By 2040
- 239,293 · +37.5%
- By 2050
- 285,457 · +64.0%
- By 2075
- 403,766 · +132.0%
- By 2100
- 498,766 · +186.5%
Race, ethnicity, and origin ACS 2023
- Neighborhood character
- Predominantly White (65%)
- Race & ethnicity
- White 65% Hispanic / Latino 17% Two or more races 8% Native American 8% Black 6%
- Hispanic origin (detail)
- Mexican 14%
- Common ancestry
- Slovak 2% Serbian 2% Romanian 1%
- Foreign-born
- 5% · Canada
- Languages at home
- 89% English-only · Spanish 10%
Political lean MEDSL · Canadian
- 2024 margin
- Solid R (+40.4) · D 28.8% · R 69.2% · Other 2.0%
- 2008→2024 swing
- +11.9pp toward D · 2008: -52.2pp · 2024: -40.4pp
- All cycles
- 2024: R+40.4 2020: R+43.3 2016: R+51.2 2012: R+54.4 2008: R+52.2
Not yet ingested
- Civics
- —
Market trends
- HPI YoY
- ▼ -11.37%
- Current HPI
- 334.5896
- Rent YoY
- ▲ 4.19%
- Metro
- Oklahoma City, OK
- State GDP YoY
- ▲ 1.55%
- F500 in state
- 6
Industry mix (Fortune 500 HQ in OK)
| Industry | F500 HQs | Revenue |
|---|---|---|
| Energy | 3 | $48B |
|
||
Price history
+590.1% since first listed16 events — show timeline
- 2026-05-03 Price Changed $117,325 MLSOK
- 2026-03-22 Price Changed $123,500 MLSOK
- 2026-02-08 Listed $130,000 MLSOK
- 2024-11-11 Rental Removed $950 RENTEC
- 2024-10-15 Listed for Rent $950 RENTEC
- 2023-11-09 Sold (Public Records) $56,000 Public Records
- 2023-11-08 Sold (MLS) $56,000 MLSOK
- 2023-09-25 Pending — MLSOK
- 2023-08-23 Price Changed $63,777 MLSOK
- 2023-05-11 Listed $69,500 MLSOK
- 2023-02-26 Listing Removed — MLSOK
- 2023-01-10 Pending — MLSOK
- 2023-01-10 Relisted — MLSOK
- 2023-01-06 Listing Removed — MLSOK
- 2022-07-23 Listed $58,500 MLSOK
- 1996-08-12 Sold (Public Records) $17,000 Public Records
Property tax history
+15.1%/yrLatest (2025): $970 · +6.0% YoY. Source: county tax records.
Cash-flow waterfall
monthlySold comps — $/sqft
last 12 mo · ≤1 miLoading sold comps…