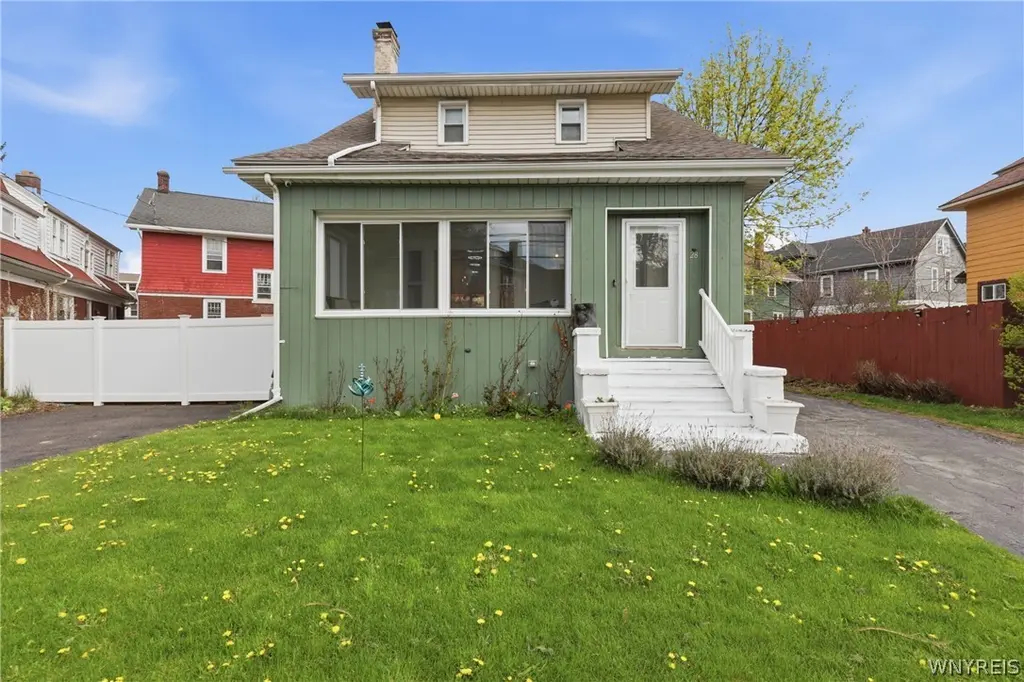
28 Mineral Springs Rd · Buffalo, NY
Flood risk 6/10 · Moderate
- FEMA flood zone
- X (unshaded)
- Chance of flooding over 30 yrs
- 0.74%
- Est. flood insurance / yr
- $473 – $860
Fire risk 1/10 · Minimal
- Est. fire insurance / yr
- $691 – $1,283
Heat risk 3/10 · Minor
- Hot days now (above 92°F)
- 7 days/yr
- Hot days in 30 yrs
- 15 days/yr
Wind risk 1/10 · Minimal
- Chance of severe wind over 30 yrs
- —
Air-quality risk 3/10 · Minor
- Unhealthy air days now
- 2 days/yr
- Unhealthy air days in 30 yrs
- 3 days/yr
Risk factors via First Street. Map © Google.
Why this score? — see what drove the D+ grade
The composite is a weighted blend of 9 inputs, each scored 0–100. Each bar is that input's sub-score; the figure is the points it added to the 100-point composite (weight × sub-score).
- Cash flow +11.1/30.0
- Appreciation +10.0/10.0
- ARV discount +8.9/15.0
- Rent growth +5.0/5.0
- Livability +3.9/5.0
- Schools +3.3/10.0
- DSCR +3.2/10.0
- Condition / age +2.5/5.0
- 1% rule +1.9/10.0
$214,900
🖨 Deal sheet (PDF) 📄 Offer letter ✓ Due diligence
Listing remarks MLS
Nicely renovated 3 bedroom 1.5 bath 2 story home. Spacious, freshly painted interior. Nice enclosed front porch. Great value for South Buffalo!
Key facts
- Heated sunroom
- Newer roof
- Updated kitchen
Tags
Property features AI
Exterior
- Parking: No garage
- Security: Owned security system
- Utilities: Public water connected; Sewer connected; Electric with circuit breakers
- Home design: Two-story existing home
- Construction: Vinyl and wood siding; Asphalt roof; Block and stone foundation; Copper plumbing
- Exterior features: Blacktop driveway; Deck; Enclosed porch; Covered porch; Fully fenced yard; Rectangular residential lot; Near public transit; City street frontage
Interior
- Kitchen: Gas oven and gas range; Microwave; Refrigerator; Solid surface countertops; Eat-in kitchen
- Bedrooms: Two bedrooms on second floor (11 x 11 and 11 x 10)
- Flooring: Carpet; Luxury vinyl; Varies by room
- Bathrooms: One full bathroom; One half bathroom; Main-level bathroom present
- Heating & cooling: Gas forced-air heating
- Interior features: Ceiling fans; Separate/formal dining room; Eat-in kitchen; Separate/formal living room; Combined living/dining area; Sliding glass door(s); Solid surface counters; Natural woodwork; Sliding doors
- Laundry & utility: Washer and dryer included; Laundry located in basement; Gas water heater
Neighborhood map
What this means for you Summary
Snapshot
- This is a 4-bed/1.5-bath single-family listed at $215k.
Deal economics
- At list price, monthly cash flow is $-87 ($-1k/yr) — negative.
- To cash-flow at today's rent, offer at most $200k (7.1% below list).
- To meet the 1% rule (rent ≥ 1% of price), the offer needs to be $148k (31.3% below list).
- Recommended offer: $148k (31.3% below list) — sets the bar for 1% rule.
- Cap rate 5.8% vs local median 8.0% in Buffalo — below-typical yield; the buyer is paying a premium for something (appreciation thesis, condition, location) that the cap rate doesn't capture.
Location & tenants
- Location reads 77/100 on livability (#195 in NY, #3,011 nationally) — a middle-class / working-renter tenant base. Strengths: commute A+, housing A+, health & safety A+; Watch: crime F, employment D-.
- Buffalo City School District (urban): math 41% / reading 40% proficiency, ranked #535 of 590 in NY (top 91%) — families likely to look elsewhere, expect single-tenant / working-renter base with shorter leases; 75% free/reduced lunch — lower-income household profile, screen leases tightly.
- Zoned schools: International School (math 8% / reading 17%, grade F, #2,048 of 2,108 statewide, top 97%, 981 students, 92% FRL); Hutchinson Central Technical High School (math 96% / reading 32%, grade B-, #807 of 1,100 statewide, top 73%, 1,175 students, 78% FRL).
- Market conditions: Rents rising fast (+12.7%/yr); 94 active listings in the ZIP; 11 comparable units currently listed for rent nearby; rentals at typical pace (median 16d on market — plan ~3-4 weeks tenant-placement turnaround); 1,244 units permitted in Erie County in 2024 (563 in 5+ unit buildings).
- This rent runs 33% of the median local income ($54k/yr) — at the standard rent-burdened threshold; future hikes will face affordability resistance.
Forward outlook
- In year one you build about $23k of equity ($1k loan paydown + $21k appreciation (10.0% local appreciation)).
- By year 2, paydown + projected appreciation supports a ~$37k cash-out refi (75% LTV) — recoverable capital for the next deal without selling this one.
Negotiation context
- It's been on market 20 days — a 2% lower offer ($212k) is reasonable based on typical stale-listing flexibility.
- 3 sale attempts since 9y ago with the ask held roughly flat each time — persistent listings suggest the price (not the market) is what's stuck; bring a comps-based counter.
- Current owner paid $130k; list at $215k implies a 65% gain — meaningful room to come down on a strong offer.
Risks & watch-outs
- Watch-outs: built in 1900 — expect roof / HVAC / electrical / plumbing capex.
- Climate carrying-cost: major flood risk — expect insurance premiums to compound above CPI over the hold.
Questions for the listing agent
- What do current leases actually rent for vs. the listed asking? Can we see a recent rent roll and the last 12 months of T-12 income?
- Built in 1900 — when were the roof, HVAC, electrical panel, plumbing, and water heater last replaced?
- Is there a deadline driving the sale (1031 exchange, divorce, estate, relocation)? That informs how much negotiation room exists.
- Crime grade is F in this area — have there been break-ins, vandalism, or insurance claims at this property in the last 3 years? What carrier currently insures it and at what premium?
- The area grade is low — what's the realistic commute time and amenity access for the typical tenant pool here? Any planned neighborhood developments (good or bad) we should know about?
- What's the average days-on-market for RENTAL listings here right now (not sales)? A rising rental-DOM trend means longer vacancies and softer asking-rent achievability than the comps imply.
- What's the recent tenant-quality profile in this submarket — average credit score on applications, eviction rate, late-payment / NSF rate, and stable-employment percentage? A property-management company in the area should have these aggregated.
- How much new for-sale + rental construction is in the pipeline within 1–3 miles? Heavy new supply typically softens prices + rents 12–24 months out; constrained supply supports both.
Investment metrics
- 1% rule
- 0.69% ✗
- Cap rate
- 5.81%
- Cash-on-cash
- -1.73%
- DSCR
- 0.92
- GRM
- 12.1
CMA / ARV
- ARV (median comp)
- $221,989
- List price
- $214,900
- Delta
- -3.19%
- Verdict
- FAIR
- Comps
- 20 within 1.0 mi
Show comp detail 12 sales within ~0.75 mi
| Address | Dist | Beds/Ba | Sqft | Sold | Price | $/sf | Match |
|---|---|---|---|---|---|---|---|
| 45 Unger Ave | 0.37mi | 3/1.0 (-1) | 1,072 (-1%) | 3mo | $223,600 | $209 | 72 |
| 351 Abbott Rd | 0.54mi | 3/1.0 (-1) | 1,080 (0%) | 1mo | $175,000 | $162 | 67 |
| 124 Zittel St | 0.43mi | 3/1.5 (-1) | 1,028 (-5%) | 4mo | $206,000 | $200 | 63 |
| 102 Pomona Pl | 0.25mi | 4/1.0 | 1,232 (+14%) | 2mo | $81,000 | $66 | 61 |
| 131 Geary St | 0.22mi | 3/2.0 (-1) | 945 (-12%) | 4mo | $110,000 | $116 | 58 |
| 88 Marbeth Ct | 0.45mi | 3/1.0 (-1) | 1,008 (-7%) | 3mo | $239,900 | $238 | 58 |
| 30 Portland St | 0.50mi | 3/1.0 (-1) | 1,006 (-7%) | 5mo | $160,000 | $159 | 54 |
| 152 Como Ave | 0.64mi | 4/2.0 | 1,134 (+5%) | 7mo | $211,000 | $186 | 54 |
| 93 Salem St | 0.52mi | 3/1.5 (-1) | 1,184 (+10%) | 1mo | $235,000 | $198 | 54 |
| 30 Strathmore Ave | 0.73mi | 3/1.0 (-1) | 1,080 (0%) | 6mo | $245,000 | $227 | 53 |
| 112 Hubbell Ave | 0.61mi | 3/1.5 (-1) | 1,161 (+8%) | 4mo | $205,000 | $177 | 51 |
| 16 Mesmer Ave | 0.71mi | 4/1.0 | 1,021 (-6%) | 6mo | $206,000 | $202 | 50 |
Match score weights: distance 35% · size 25% · config 20% · recency 20%. Top-matched comps best support the ARV.
Projected returns pro-forma
10.0% appreciation · 8.0% rent growth · sell at horizon
- IRR
- 24.4%
- Equity multiple
- 2.98×
- Total profit
- $119,211
- Equity at exit
- $193,599
- IRR
- 22.7%
- Equity multiple
- 7.22×
- Total profit
- $374,481
- Equity at exit
- $417,503
Cash invested: $60,172 (down + closing). Projections, not guarantees.
Landlord ↔ Tenant lean methodology
- Overall (STATE)
- 15 Strongly Tenant-Friendly
- State New York
- 15 Strongly Tenant-Friendly · D+10
- County
- — inherits STATE
- City
- — inherits STATE
ZIP-level market 14210
- Home prices YoY
- 13.8%
- Rents YoY
- 12.7%
- Active inventory
- 94
- Price-to-rent
- 12.1×
Monthly cashflow live
- Estimated rent
- $1,476 high interval (Pro) →
- Mortgage (P&I)
- −$1,127
- Tax from tax record
- −$36 /mo · $436/yr
- Insurance
- −$90
- HOA
- −$0
- Vacancy / Maint / Mgmt
- −$310
- Net cashflow
- $-87
Break-even live
Sensitivity live
| Price | -10% $35 | -5% $-26 | +0% $-87 | +5% $-393 | +10% $-467 |
|---|---|---|---|---|---|
| Rent | -10% $-203 | -5% $-145 | +0% $-87 | +5% $-28 | +10% $30 |
| Rate | -1.0pp $22 | -0.5pp $-32 | base $-87 | +0.5pp $-142 | +1.0pp $-199 |
UW: 25.0% down · 7.5% · 30yr · 1.5% tax · 5.0% vac · 8.0% maint · 8.0% mgmt
Financing live
Cash to close
- Down payment
- $53,725
- Closing costs
- $6,447
- Reserves months
- —
- Total cash needed
- —
Loan-product check · same deal, 3 products live
Conventional
25% down · 7.5% · 30yr
- Down + closing
- —
- Monthly P&I
- —
- Monthly cashflow
- —
- DSCR
- —
- Eligible?
- —
Personal DTI + credit; lowest rate.
DSCR
20% down · 8.5% · 30yr
- Down + closing
- —
- Monthly P&I
- —
- Monthly cashflow
- —
- DSCR
- —
- Eligible?
- —
No personal income docs; deal must DSCR.
Hard money
10% down · 12.0% · 12mo
- Down + closing
- —
- Monthly P&I
- —
- Monthly cashflow
- —
- DSCR
- —
- Eligible?
- —
Short-term bridge; refi at stabilization.
Rent comps 11 comps
| Address | Beds | Baths | Sqft | Rent | $/sqft | DOM | Units | Dist |
|---|---|---|---|---|---|---|---|---|
| 34 Hayden St Unit Back Buffalo, NY | 3.0 | 1.0 | 1200 | $1,600 | $1.33 | 45d | 1 | 0.07mi |
| 1927 Seneca St Buffalo, NY | 3.0 | 1.0 | 1196 | $1,250 | $1.05 | 25d | 1 | 0.09mi |
| 1899 Seneca St Buffalo, NY | 3.0 | 1.0 | 1134 | $1,075 | $0.95 | 16d | 1 | 0.12mi |
| 76 Hammerschmidt Ave Buffalo, NY | 3.0 | 1.0 | 1200 | $1,275 | $1.06 | 3d | 1 | 0.25mi |
| 298 Cumberland Ave Buffalo, NY | 3.0 | 1.5 | 1208 | $2,200 | $1.82 | 3d | 1 | 0.45mi |
| 23 Indian Orchard Pl Unit Lower Buffalo, NY | 3.0 | 1.0 | 1200 | $1,250 | $1.04 | 45d | 1 | 0.56mi |
| 89 Macamley St #2 Buffalo, NY | 3.0 | 1.0 | 1274 | $1,100 | $0.86 | 12d | 1 | 0.82mi |
| 102 Wildwood Pl Unit 1 Buffalo, NY | 3.0 | 1.0 | 1100 | $1,250 | $1.14 | 17d | 1 | 0.99mi |
| 700 Hopkins St Buffalo, NY | 3.0 | 1.0 | 1100 | $1,225 | $1.11 | 16d | 1 | 1.05mi |
| 47 Lester St Unit Main Floor Buffalo, NY | 3.0 | 1.0 | 900 | $1,000 | $1.11 | 45d | 1 | 1.10mi |
| 74 Woodside Ave Unit 1 Buffalo, NY | 3.0 | 1.0 | 1250 | $1,510 | $1.21 | 3d | 1 | 1.24mi |
Listing history 20 events
-
2026-06-17days on market $214,900 Active 20 DOM
-
2026-06-16days on market $214,900 Active 19 DOM
-
2026-06-15days on market $214,900 Active 18 DOM
-
2026-06-13days on market $214,900 Active 16 DOM
-
2026-06-13days on market $214,900 Active 15 DOM
-
2026-06-10days on market $214,900 Active 13 DOM
-
2026-06-09days on market $214,900 Active 12 DOM
-
2026-06-08days on market $214,900 Active 11 DOM
-
2026-06-07days on market $214,900 Active 10 DOM
-
2026-06-03days on market $214,900 Active 6 DOM
-
2026-06-02days on market $214,900 Active 5 DOM
-
2026-06-01days on market $214,900 Active 4 DOM
-
2026-05-31days on market $214,900 Active 3 DOM
-
2026-05-16price $214,900 2058-char remark
-
2026-04-28$219,900 Active 2058-char remark
-
2024-03-22soldstatus $130,000
-
2017-06-21soldstatus $66,000 Closed Sale or Rented 143-char remark
Show marketing remark (143 chars)
Nicely renovated 3 bedroom 1.5 bath 2 story home. Spacious, freshly painted interior. Nice enclosed front porch. Great value for South Buffalo!
-
2017-06-20soldstatus $66,000
-
2017-04-24status Pending Sale 143-char remark
Show marketing remark (143 chars)
Nicely renovated 3 bedroom 1.5 bath 2 story home. Spacious, freshly painted interior. Nice enclosed front porch. Great value for South Buffalo!
-
2017-03-09$69,900 Active 143-char remark
Show marketing remark (143 chars)
Nicely renovated 3 bedroom 1.5 bath 2 story home. Spacious, freshly painted interior. Nice enclosed front porch. Great value for South Buffalo!
ⓘ Source: listings_history table (triggers on properties + properties_extension) + one-shot
backfill from property_details.listing_events for pre-trigger history.
Tax reassessment forecast NY · Partial reset (capped growth)
- Current annual tax
- $436 · $36/mo
- Projected year-2 tax
- $2,034 · $169/mo
- Expected delta
- +$1,598/yr (+$133/mo · 366.6%)
ⓘ Screening estimate from a state-policy table — verify with the county assessor before closing.
Climate risk First Street
- Flood 6/10 Major FEMA zone X (unshaded) · 74% chance over 30 yrs
- Wildfire 1/10 Low
- Heat 3/10 Moderate 7 d/yr ≥92°F today · 15 d/yr by 30 yrs out
- Wind 1/10 Low
- Air quality 3/10 Moderate 2 unhealthy d/yr today · 3 by 30 yrs out
Nearby sold comps map
Loading sold comps map…
Walkable amenities ~0.75 mi
Loading nearby amenities…
Taxation est. · year 1
- Rental income
- $17,716
- − Mortgage interest
- −$12,038
- − Property taxes
- −$436
- − Insurance
- −$1,074
- − Repairs & maintenance
- −$1,417
- − Management
- −$1,417
- − Depreciation
- −$6,252
- Taxable loss
- −$4,918
- Est. tax savings @ 24.0%
- +$1,180
- After-tax cash flow
- $142/yr
For passive investors: Depreciation is non-cash, so a rental often shows a tax loss while cash-flowing — sheltering income. Rental losses are passive: they offset passive income freely, and up to $25,000/yr can offset ordinary (W-2) income if you actively participate and your MAGI is under $100k (phasing out to $0 by $150k); unused losses carry forward. On sale, claimed depreciation is recaptured at up to 25%, and gains may owe capital-gains tax (a 1031 exchange can defer both). Figures are a year-1 estimate at your 24.0% rate — not tax advice; consult a CPA.
Schools (NCES district)
- District
- Buffalo City School District
- NCES district ID
- 3605850
- Math proficiency
- 41% ▲ 11.00%
- Reading proficiency
- 40% ▲ 7.00%
- Median HH income
- $31,665
- Composite
- 33.17/100
- National rank
- #5544
- State rank
- #535 of 590 in NY
Livability — Buffalo
- Score
- 77/100
- State rank
- #195
- US rank
- #3011
Category grades
Schools grade is shown separately in the Schools card above.
Census & demographics
- Census place
- Buffalo, NY
- County
- Erie County · 714,559 people
- City population
- 440,021
- Metro
- Buffalo-Cheektowaga, NY
- Population (ZIP)
- 15,563
- Household income
- $54,197
- Rent vs Own
- Severe rent burden
- 959.0
Population outlook (Erie County) Hauer SSP2
- Today (2025)
- 933,037 people
- By 2030
- 935,181 · +0.2%
- By 2040
- 928,531 · -0.5%
- By 2050
- 905,725 · -2.9%
- By 2075
- 834,037 · -10.6%
- By 2100
- 708,033 · -24.1%
Race, ethnicity, and origin ACS 2023
- Neighborhood character
- Predominantly White (79%)
- Race & ethnicity
- White 79% Two or more races 8% Black 8% Hispanic / Latino 7% Asian 1%
- Hispanic origin (detail)
- Puerto Rican 6%
- Common ancestry
- Romanian 21% Lithuanian 2% Serbian 1%
- Foreign-born
- 2% · Canada, China
- Languages at home
- 95% English-only · Spanish 2% Arabic 1% Other Indo-European 1%
Political lean MEDSL · Erie
- 2024 margin
- Lean D (+9.7) · D 54.8% · R 45.2%
- 2008→2024 swing
- -7.9pp toward R · 2008: 17.5pp · 2024: 9.7pp
- All cycles
- 2024: D+9.7 2020: D+14.7 2016: D+4.8 2012: D+15.6 2008: D+17.5
Not yet ingested
- Civics
- —
Market trends
- HPI YoY
- ▲ 52.34%
- Current HPI
- 431.7951
- Rent YoY
- ▲ 12.67%
- Metro
- Buffalo-Cheektowaga, NY
- State GDP YoY
- ▲ 2.60%
- F500 in state
- 92
Industry mix (Fortune 500 HQ in NY)
| Industry | F500 HQs | Revenue |
|---|---|---|
| Financial Services | 10 | $950B |
|
||
| Consumer Goods | 9 | $162B |
|
||
| Insurance | 4 | $225B |
|
||
| Telecommunications | 2 | $144B |
|
||
| Pharmaceuticals | 2 | $112B |
|
||
| Media / Entertainment | 2 | $69B |
|
||
Price history
+207.4% since first listed10 events — show timeline
- 2026-06-17 Listing Removed — WNYREIS
- 2026-05-28 Listed $214,900 WNYREIS
- 2026-05-27 Listing Removed — WNYREIS
- 2026-05-16 Price Changed $214,900 WNYREIS
- 2026-04-28 Listed $219,900 WNYREIS
- 2024-03-22 Sold (Public Records) $130,000 Public Records
- 2017-06-21 Sold (MLS) $66,000 WNYREIS
- 2017-06-20 Sold (Public Records) $66,000 Public Records
- 2017-04-24 Pending — WNYREIS
- 2017-03-09 Listed $69,900 WNYREIS
Property tax history
+4.8%/yrLatest (2025): $436 · +11.1% YoY. Source: county tax records.
Cash-flow waterfall
monthlySold comps — $/sqft
last 12 mo · ≤1 miLoading sold comps…