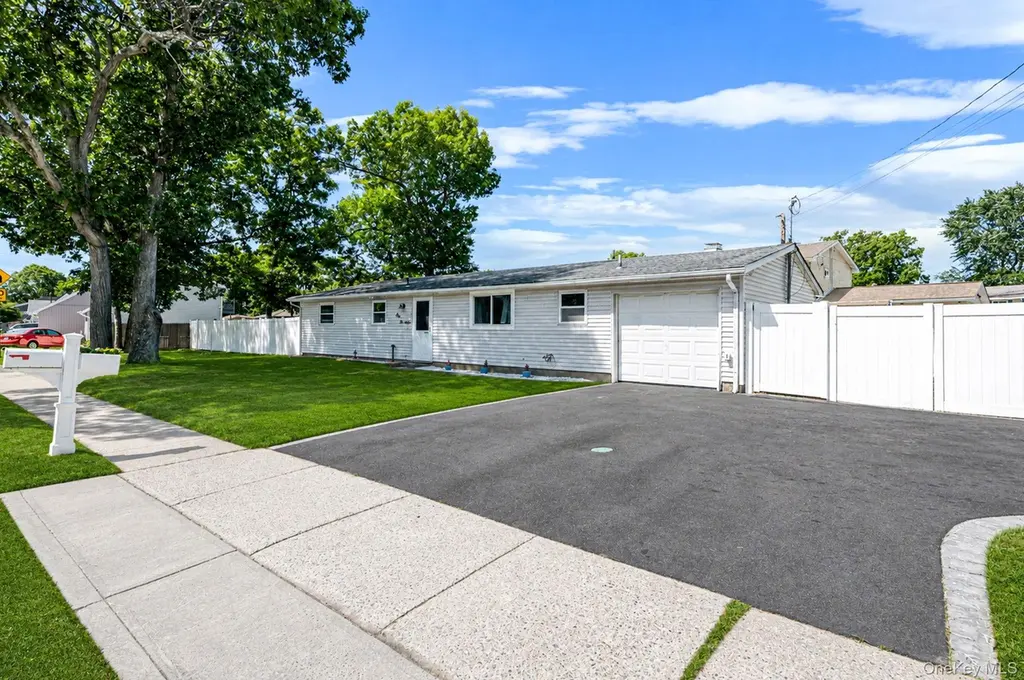
100 Patchogue Holbrook Rd · Lake Ronkonkoma, NY
Flood risk 1/10 · Minimal
- FEMA flood zone
- X (unshaded)
- Chance of flooding over 30 yrs
- 0.0%
- Est. flood insurance / yr
- $507 – $1,088
Fire risk 1/10 · Minimal
- Est. fire insurance / yr
- $691 – $1,283
Heat risk 4/10 · Minor
- Hot days now (above 94°F)
- 7 days/yr
- Hot days in 30 yrs
- 16 days/yr
Wind risk 6/10 · Moderate
- Chance of severe wind over 30 yrs
- 77.0%
Air-quality risk 4/10 · Minor
- Unhealthy air days now
- 4 days/yr
- Unhealthy air days in 30 yrs
- 6 days/yr
Risk factors via First Street. Map © Google.
Why this score? — see what drove the D grade
The composite is a weighted blend of 9 inputs, each scored 0–100. Each bar is that input's sub-score; the figure is the points it added to the 100-point composite (weight × sub-score).
- ARV discount +14.5/15.0
- Cash flow +9.0/30.0
- Schools +6.6/10.0
- Livability +3.9/5.0
- 1% rule +2.8/10.0
- Rent growth +2.7/5.0
- DSCR +2.5/10.0
- Condition / age +2.5/5.0
- Appreciation +0.0/10.0
$515,000
🖨 Deal sheet (PDF) 📄 Offer letter ✓ Due diligence
Listing remarks
Welcome to this well-maintained 3-bedroom, 1.5-bath ranch offering comfortable one-level living in Ronkonkoma. Inside, you’ll find a functional layout with an updated eat-in kitchen featuring granite countertops, ample cabinetry, and modern finishes, along with refreshed bathrooms and spacious bedrooms. Full bath features a jetted soaking tub. The bright living and dining areas provide an inviting space for everyday living and entertaining, with sliding glass doors leading to a fully fenced backyard complete with a patio and plenty of room for outdoor gatherings, pets, or play. Additional features include a one-car attached garage, updated flooring in select areas, and generous storag
Key facts
- Jetted soaking tub
- Refreshed bathrooms
- Granite countertops
Tags
Property features AI
Exterior
- Parking: Private parking; 1-car garage; No carport
- Utilities: Cesspool sewer; Public water connected; Trash collection service
- Home design: Single family residence; One level
- Construction: Vinyl siding construction
- Exterior features: Playground; Vinyl siding; Not waterfront
Interior
- Kitchen: Dishwasher; Oven; Refrigerator
- Bedrooms: Bedroom on the first floor
- Flooring: Tile flooring
- Bathrooms: 1 full bathroom; 1 half bathroom
- Heating & cooling: Oil-fired baseboard heating; No central cooling
- Interior features: First-floor bedroom; Washer/dryer hookup; Partial attic; No basement; 5 total rooms
- Laundry & utility: Washer; Dryer; Washer/dryer hookup
Neighborhood map
What this means for you Summary
Snapshot
- This is a 3-bed/1.5-bath single-family listed at $515k.
Deal economics
- At list price, monthly cash flow is $-406 ($-5k/yr) — negative.
- To cash-flow at today's rent, offer at most $443k (13.9% below list).
- To meet the 1% rule (rent ≥ 1% of price), the offer needs to be $403k (21.7% below list).
- Recommended offer: $403k (21.7% below list) — sets the bar for 1% rule.
- Cap rate 5.3% vs local median 4.0% in Lake Ronkonkoma — top-decile yield for the area; either an underpriced asset or a hidden risk that comps aren't pricing in. Stress-test before assuming the spread holds.
Location & tenants
- Location reads 78/100 on livability (#169 in NY, #2,606 nationally) — a middle-class / working-renter tenant base. Strengths: employment A+, housing A+, health & safety B; Watch: amenities D-, cost of living F.
- Sachem Central School District (suburban): math 69% / reading 76% proficiency, ranked #86 of 590 in NY (top 15%) — strong family-tenant draw, lease renewals of 3-5y typical; only 15% free/reduced lunch — higher-income household profile.
- Zoned schools: Hiawatha School (math 57% / reading 57%, grade C+, #842 of 2,108 statewide, top 43%, 603 students, 36% FRL); Samoset Middle School (math 51% / reading 63%, grade B, #192 of 729 statewide, top 28%, 892 students, 31% FRL); Sachem High School North (math 96% / reading 95%, grade A+, #76 of 1,100 statewide, top 7%, 1,923 students, 25% FRL) — zoned schools average 31% FRL vs 15% district-wide (16 pts higher); higher-poverty schools than district average — tighter screening recommended.
- Market conditions: Rents flat; 175 active listings in the ZIP; 3 comparable units currently listed for rent nearby; rentals leasing fast (median 0d on market — plan ~1-2 weeks tenant-placement turnaround); high-income renter base; 1,366 units permitted in Suffolk County in 2024 (216 in 5+ unit buildings).
- This rent runs 43% of the median local income ($112k/yr) — at the standard rent-burdened threshold; future hikes will face affordability resistance.
Forward outlook
- Local home prices are declining (-3.0%/yr); year-one equity from $4k of loan paydown is wiped out by about $15k of value loss. Plan a longer hold.
- Suffolk County population projected to shrink 5% by 2050 — rents likely to lag national; underwrite the cash flow, not the appreciation.
Negotiation context
- Only 12 days on market — expect competitive offers; lowballing is unlikely to land.
- Current owner paid $321k; list at $515k implies a 60% gain — meaningful room to come down on a strong offer.
Risks & watch-outs
- Climate carrying-cost: major wind risk, 77% chance of damaging wind over 30y — expect insurance premiums to compound above CPI over the hold.
Questions for the listing agent
- What do current leases actually rent for vs. the listed asking? Can we see a recent rent roll and the last 12 months of T-12 income?
- Built in 1970 — when were the roof, HVAC, electrical panel, plumbing, and water heater last replaced?
- Is there a deadline driving the sale (1031 exchange, divorce, estate, relocation)? That informs how much negotiation room exists.
- Schools are B-rated — typically a magnet for longer-tenancy family renters. What's the average tenant stay here, and is there a school-zone premium baked into asking?
- The area grade is low — what's the realistic commute time and amenity access for the typical tenant pool here? Any planned neighborhood developments (good or bad) we should know about?
- What's the average days-on-market for RENTAL listings here right now (not sales)? A rising rental-DOM trend means longer vacancies and softer asking-rent achievability than the comps imply.
- What's the recent tenant-quality profile in this submarket — average credit score on applications, eviction rate, late-payment / NSF rate, and stable-employment percentage? A property-management company in the area should have these aggregated.
- How much new for-sale + rental construction is in the pipeline within 1–3 miles? Heavy new supply typically softens prices + rents 12–24 months out; constrained supply supports both.
Investment metrics
- 1% rule
- 0.78% ✗
- Cap rate
- 5.35%
- Cash-on-cash
- -3.38%
- DSCR
- 0.85
- GRM
- 10.6
CMA / ARV
- ARV (on-the-fly)
- $609,120
- Comps found
- 12
Show comp detail 12 sales within ~0.75 mi
| Address | Dist | Beds/Ba | Sqft | Sold | Price | $/sf | Match |
|---|---|---|---|---|---|---|---|
| 86 Samuel St | 0.35mi | 3/1.0 | 1,098 (-3%) | 11mo | $570,000 | $519 | 68 |
| 32 Dennis Dr | 0.30mi | 3/1.0 | 981 (-13%) | 1mo | $535,000 | $545 | 61 |
| 10 Jan Ct | 0.45mi | 3/1.0 | 1,053 (-7%) | 8mo | $550,000 | $522 | 59 |
| 31 Duncan Ave | 0.45mi | 3/1.5 | 1,060 (-6%) | 14mo | $565,000 | $533 | 57 |
| 17 Acorn St | 0.45mi | 3/2.0 | 1,056 (-6%) | 12mo | $570,000 | $540 | 57 |
| 22 Peter Rd | 0.30mi | 3/2.0 | 996 (-12%) | 13mo | $530,000 | $532 | 54 |
| 51 Lynda Dr | 0.45mi | 3/1.0 | 1,036 (-8%) | 14mo | $580,000 | $560 | 51 |
| 33 Thorne St | 0.61mi | 3/2.0 | 1,242 (+10%) | 6mo | $525,000 | $423 | 48 |
| 132 Pleasure Ave | 0.54mi | 3/1.0 | 1,016 (-10%) | 13mo | $580,000 | $571 | 45 |
| 155 Patchogue Holbrook Rd | 0.43mi | 3/1.0 | 980 (-13%) | 14mo | $560,000 | $571 | 45 |
| 8 Cleary Rd | 0.70mi | 3/1.0 | 1,272 (+13%) | 6mo | $550,000 | $432 | 39 |
| 165 Smith Ave | 0.63mi | 3/2.0 | 985 (-13%) | 11mo | $620,000 | $629 | 38 |
Match score weights: distance 35% · size 25% · config 20% · recency 20%. Top-matched comps best support the ARV.
Projected returns pro-forma
-3.0% appreciation · 0.79% rent growth · sell at horizon
- IRR
- -24.5%
- Equity multiple
- 0.18×
- Total profit
- $-117,987
- Equity at exit
- $76,788
- IRR
- -27.9%
- Equity multiple
- -0.18×
- Total profit
- $-170,121
- Equity at exit
- $44,528
Cash invested: $144,200 (down + closing). Projections, not guarantees.
Landlord ↔ Tenant lean methodology
- Overall (STATE)
- 15 Strongly Tenant-Friendly
- State New York
- 15 Strongly Tenant-Friendly · D+10
- County
- — inherits STATE
- City
- — inherits STATE
ZIP-level market 11779
- Rents YoY
- 0.8%
- Active inventory
- 175
- Price-to-rent
- 10.6×
Monthly cashflow live
- Estimated rent
- $4,031 medium interval (Pro) →
- Mortgage (P&I)
- −$2,701
- Tax from tax record
- −$675 /mo · $8,096/yr
- Insurance
- −$215
- HOA
- −$0
- Vacancy / Maint / Mgmt
- −$846
- Net cashflow
- $-406
Break-even live
Sensitivity live
| Price | -10% $-114 | -5% $-260 | +0% $-406 | +5% $-552 | +10% $-697 |
|---|---|---|---|---|---|
| Rent | -10% $-724 | -5% $-565 | +0% $-406 | +5% $-247 | +10% $-87 |
| Rate | -1.0pp $-146 | -0.5pp $-275 | base $-406 | +0.5pp $-539 | +1.0pp $-675 |
UW: 25.0% down · 7.5% · 30yr · 1.5% tax · 5.0% vac · 8.0% maint · 8.0% mgmt
Financing live
Cash to close
- Down payment
- $128,750
- Closing costs
- $15,450
- Reserves months
- —
- Total cash needed
- —
Loan-product check · same deal, 3 products live
Conventional
25% down · 7.5% · 30yr
- Down + closing
- —
- Monthly P&I
- —
- Monthly cashflow
- —
- DSCR
- —
- Eligible?
- —
Personal DTI + credit; lowest rate.
DSCR
20% down · 8.5% · 30yr
- Down + closing
- —
- Monthly P&I
- —
- Monthly cashflow
- —
- DSCR
- —
- Eligible?
- —
No personal income docs; deal must DSCR.
Hard money
10% down · 12.0% · 12mo
- Down + closing
- —
- Monthly P&I
- —
- Monthly cashflow
- —
- DSCR
- —
- Eligible?
- —
Short-term bridge; refi at stabilization.
Rent comps 3 comps
| Address | Beds | Baths | Sqft | Rent | $/sqft | DOM | Units | Dist |
|---|---|---|---|---|---|---|---|---|
| 1000 Mill Rd Lake Ronkonkoma, NY | 2.0 | 1.0–2.0 | 843 | $4,220 | $5.01 | 0d | 14 | 0.79mi |
| 2 Hawkins Ave Lake Ronkonkoma, NY | 3.0 | 1.0–2.0 | 959 | $5,009 | $5.22 | 0d | 130 | 1.03mi |
| 147 Lake Shore Rd Ronkonkoma, NY | 1.0–2.0 | 1.0 | 940 | $3,379 | $3.59 | 0d | 10 | 1.06mi |
Listing history 9 events
-
2026-06-21days on market $515,000 Active 12 DOM
-
2026-06-18days on market $515,000 Active 9 DOM
-
2026-06-17days on market $515,000 Active 8 DOM
-
2026-06-16days on market $515,000 Active 7 DOM
-
2026-06-15days on market $515,000 Active 6 DOM
-
2026-06-13days on market $515,000 Active 4 DOM
-
2026-06-13days on market $515,000 Active 3 DOM
-
2026-06-10remarks 693-char remark
-
2026-06-10$515,000 Active 1 DOM
ⓘ Source: listings_history table (triggers on properties + properties_extension) + one-shot
backfill from property_details.listing_events for pre-trigger history.
Tax reassessment forecast NY · Partial reset (capped growth)
- Current annual tax
- $8,096 · $675/mo
- Projected year-2 tax
- $8,400 · $700/mo
- Expected delta
- +$304/yr (+$25/mo · 3.8%)
ⓘ Screening estimate from a state-policy table — verify with the county assessor before closing.
Climate risk First Street
- Flood 1/10 Low FEMA zone X (unshaded) · 0% chance over 30 yrs
- Wildfire 1/10 Low
- Heat 4/10 Moderate 7 d/yr ≥94°F today · 16 d/yr by 30 yrs out
- Wind 6/10 Major 77% chance of damaging wind over 30 yrs
- Air quality 4/10 Moderate 4 unhealthy d/yr today · 6 by 30 yrs out
Nearby sold comps map
Loading sold comps map…
Walkable amenities ~0.75 mi
Loading nearby amenities…
Taxation est. · year 1
- Rental income
- $48,367
- − Mortgage interest
- −$28,848
- − Property taxes
- −$8,096
- − Insurance
- −$2,575
- − Repairs & maintenance
- −$3,869
- − Management
- −$3,869
- − Depreciation
- −$14,982
- Taxable loss
- −$13,872
- Est. tax savings @ 24.0%
- +$3,329
- After-tax cash flow
- $-1,540/yr
For passive investors: Depreciation is non-cash, so a rental often shows a tax loss while cash-flowing — sheltering income. Rental losses are passive: they offset passive income freely, and up to $25,000/yr can offset ordinary (W-2) income if you actively participate and your MAGI is under $100k (phasing out to $0 by $150k); unused losses carry forward. On sale, claimed depreciation is recaptured at up to 25%, and gains may owe capital-gains tax (a 1031 exchange can defer both). Figures are a year-1 estimate at your 24.0% rate — not tax advice; consult a CPA.
Schools (NCES district)
- District
- Sachem Central School District
- NCES district ID
- 3625350
- Math proficiency
- 69% ▬ 0.00%
- Reading proficiency
- 76% ▲ 12.00%
- Median HH income
- $92,968
- Composite
- 65.53/100
- National rank
- #472
- State rank
- #86 of 590 in NY
Livability — Lake Ronkonkoma
- Score
- 78/100
- State rank
- #169
- US rank
- #2606
Category grades
Schools grade is shown separately in the Schools card above.
Census & demographics
- Census place
- Lake Ronkonkoma, NY
- County
- Suffolk County · 679,920 people
- City population
- 38,273
- Metro
- New York-Newark-Jersey City, NY-NJ-PA
- Population (ZIP)
- 38,206
- Household income
- $112,180
- Rent vs Own
- Severe rent burden
- 874.0
Population outlook (Suffolk County) Hauer SSP2
- Today (2025)
- 1,505,262 people
- By 2030
- 1,498,318 · -0.5%
- By 2040
- 1,471,101 · -2.3%
- By 2050
- 1,424,848 · -5.3%
- By 2075
- 1,337,157 · -11.2%
- By 2100
- 1,217,720 · -19.1%
Race, ethnicity, and origin ACS 2023
- Neighborhood character
- Predominantly White (67%)
- Race & ethnicity
- White 67% Hispanic / Latino 19% Two or more races 9% Asian 7% Black 5%
- Hispanic origin (detail)
- Puerto Rican 7% Dominican 1%
- Common ancestry
- Romanian 4% Scotch-Irish 1% Lithuanian 1%
- Foreign-born
- 14% · Canada, Jamaica, China
- Languages at home
- 79% English-only · Spanish 10% Other Indo-European 7% Other Asian/Pacific 1%
Political lean MEDSL · Suffolk
- 2024 margin
- Lean R (+10.0) · D 45.0% · R 55.0%
- 2008→2024 swing
- -16.0pp toward R · 2008: 6.0pp · 2024: -10.0pp
- All cycles
- 2024: R+10.0 2020: R+0.0 2016: R+8.2 2012: D+2.9 2008: D+6.0
Not yet ingested
- Civics
- —
Market trends
- HPI YoY
- ▼ -569.98%
- Current HPI
- 350.0973
- Rent YoY
- ▲ 0.79%
- Metro
- New York-Newark-Jersey City, NY-NJ-PA
- State GDP YoY
- ▲ 2.60%
- F500 in state
- 92
Industry mix (Fortune 500 HQ in NY)
| Industry | F500 HQs | Revenue |
|---|---|---|
| Financial Services | 10 | $950B |
|
||
| Consumer Goods | 9 | $162B |
|
||
| Insurance | 4 | $225B |
|
||
| Telecommunications | 2 | $144B |
|
||
| Pharmaceuticals | 2 | $112B |
|
||
| Media / Entertainment | 2 | $69B |
|
||
Price history
+60.4% since first listed2 events — show timeline
- 2026-06-09 Listed $515,000 OneKey® MLS as Distributed by MLS Grid
- 2021-05-12 Sold (Public Records) $321,000 Public Records
Property tax history
+2.1%/yrLatest (2025): $8,096 · +0.0% YoY. Source: county tax records.
Cash-flow waterfall
monthlySold comps — $/sqft
last 12 mo · ≤1 miLoading sold comps…