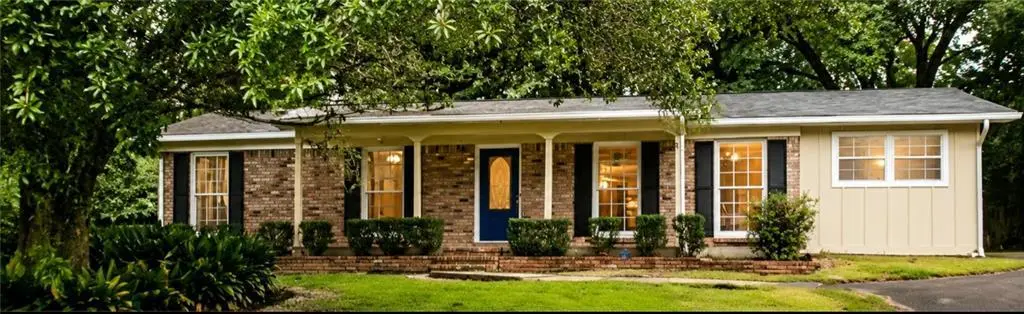
259 Vanderbilt Dr · Mobile, AL
Flood risk 1/10 · Minimal
- FEMA flood zone
- X (unshaded)
- Chance of flooding over 30 yrs
- 0.0%
- Est. flood insurance / yr
- $507 – $1,088
Fire risk 3/10 · Minor
- Est. fire insurance / yr
- $916 – $1,700
Heat risk 9/10 · Severe
- Hot days now (above 104°F)
- 7 days/yr
- Hot days in 30 yrs
- 21 days/yr
Wind risk 9/10 · Severe
- Chance of severe wind over 30 yrs
- 99.0%
Air-quality risk 1/10 · Minimal
- Unhealthy air days now
- 0 days/yr
- Unhealthy air days in 30 yrs
- 0 days/yr
Risk factors via First Street. Map © Google.
Why this score? — see what drove the C grade
The composite is a weighted blend of 9 inputs, each scored 0–100. Each bar is that input's sub-score; the figure is the points it added to the 100-point composite (weight × sub-score).
- Cash flow +19.8/30.0
- ARV discount +14.5/15.0
- DSCR +6.3/10.0
- 1% rule +4.1/10.0
- Rent growth +4.0/5.0
- Livability +3.8/5.0
- Condition / age +2.5/5.0
- Schools +2.3/10.0
- Appreciation +0.0/10.0
$190,000
🖨 Deal sheet 📄 Offer letter ✓ Due diligence
Listing remarks
Welcome to 259 Vanderbilt Drive, a charming home nestled in the heart of Mobile. This inviting 3-bedroom, 2.5-bath residence also features a versatile bonus room, offering the perfect blend of comfort and potential. Step inside to discover a functional floor plan designed for both everyday living and entertaining. The spacious living areas provide plenty of room for gatherings, while the well-appointed kitchen boasts ample cabinet and counter space. The primary suite includes a private bath, and the additional bedrooms offer excellent flexibility for guests, a home office, or a growing family. The exterior is equally impressive, featuring a large yard, a covered patio, and a shed equipped w
Key facts
- Bonus room
- Large yard
- Covered patio
Tags
Property features AI
Exterior
- Parking: Driveway
- Utilities: Electricity available; Water available; Public sewer; Sewer available; Other utilities
- Home design: Single family residence; Residential property
- Construction: Shingle roof; Slab foundation; Other construction materials; Shutters on windows
- Exterior features: Rain gutters; Storage; Shed(s); View
Interior
- Kitchen: White cabinets; Pantry; Dishwasher; Electric range; Refrigerator; Other kitchen features
- Bedrooms: 3 bedrooms
- Flooring: Carpet; Other flooring
- Bathrooms: 2 full bathrooms; 1 half bathroom
- Heating & cooling: Central heating; Central air conditioning; Ceiling fan(s)
- Interior features: Crown molding; Other interior features
- Laundry & utility: Other utility features
Neighborhood map
What this means for you Summary
Snapshot
- This is a 3-bed/2.0-bath single-family listed at $190k.
Deal economics
- At list price, monthly cash flow is $228 ($3k/yr) — positive.
- The deal already cash-flows at list — no discount required.
- To meet the 1% rule (rent ≥ 1% of price), the offer needs to be $173k (8.9% below list).
- Recommended offer: $173k (8.9% below list) — sets the bar for 1% rule.
- Cap rate 7.7% vs local median 4.9% in Mobile — top-decile yield for the area; either an underpriced asset or a hidden risk that comps aren't pricing in. Stress-test before assuming the spread holds.
Location & tenants
- Location reads 75/100 on livability (#20 in AL, #4,262 nationally) — a middle-class / working-renter tenant base. Strengths: commute A+, cost of living A+, housing A+; Watch: crime F, employment D-.
- Mobile County (urban): math 15% / reading 39% proficiency, ranked #81 of 129 in AL (top 63%) — low school quality limits family demand, transient renter base, plan for 1-2y turnover; 67% free/reduced lunch — lower-income household profile, screen leases tightly.
- Zoned schools: Mary B Austin Elementary School (math 29% / reading 59%, grade F, #194 of 627 statewide, top 32%, 511 students, 51% FRL); Mattie T Blount High School (math 2% / reading 3%, grade F, #291 of 305 statewide, top 100%, 1,176 students, 86% FRL) — zoned schools at 69% FRL track the district average.
- Market conditions: Rents rising fast (+6.2%/yr); 338 active listings in the ZIP; 19 comparable units currently listed for rent nearby; rentals at typical pace (median 21d on market — plan ~3-4 weeks tenant-placement turnaround); 1,678 units permitted in Mobile County in 2024 (264 in 5+ unit buildings).
- This rent runs 34% of the median local income ($61k/yr) — at the standard rent-burdened threshold; future hikes will face affordability resistance.
Forward outlook
- Local home prices are declining (-3.0%/yr); year-one equity from $1k of loan paydown is wiped out by about $6k of value loss. Plan a longer hold.
- Mobile County population projected to shrink 8% by 2050 — rents likely to lag national; underwrite the cash flow, not the appreciation.
Negotiation context
- Only 8 days on market — expect competitive offers; lowballing is unlikely to land.
- Current owner paid $110k; list at $190k implies a 72% gain — meaningful room to come down on a strong offer.
Risks & watch-outs
- Climate carrying-cost: severe wind risk, 99% chance of damaging wind over 30y; extreme-heat days projected 7→21/yr by 2055 (HVAC capex compounding) — expect insurance premiums to compound above CPI over the hold.
Questions for the listing agent
- Is there a deadline driving the sale (1031 exchange, divorce, estate, relocation)? That informs how much negotiation room exists.
- Schools are D-rated, which usually means shorter tenancies and higher turnover. Who's the typical renter profile here, and what's been the actual vacancy rate?
- Crime grade is F in this area — have there been break-ins, vandalism, or insurance claims at this property in the last 3 years? What carrier currently insures it and at what premium?
- What's the average days-on-market for RENTAL listings here right now (not sales)? A rising rental-DOM trend means longer vacancies and softer asking-rent achievability than the comps imply.
- What's the recent tenant-quality profile in this submarket — average credit score on applications, eviction rate, late-payment / NSF rate, and stable-employment percentage? A property-management company in the area should have these aggregated.
- How much new for-sale + rental construction is in the pipeline within 1–3 miles? Heavy new supply typically softens prices + rents 12–24 months out; constrained supply supports both.
Investment metrics
- 1% rule
- 0.91% ✗
- Cap rate
- 7.73%
- Cash-on-cash
- 5.14%
- DSCR
- 1.23
- GRM
- 9.1
CMA / ARV
- ARV (on-the-fly)
- $224,826
- Comps found
- 12
Show comp detail 12 sales within ~0.75 mi
| Address | Dist | Beds/Ba | Sqft | Sold | Price | $/sf | Match |
|---|---|---|---|---|---|---|---|
| 5516 Brightwood Ln | 0.07mi | 3/2.0 | 1,390 (-2%) | 1mo | $170,000 | $122 | 93 |
| 312 Vanderbilt Dr | 0.08mi | 3/2.0 | 1,436 (+2%) | 3mo | $230,000 | $160 | 91 |
| 5405 Hilltop Dr N | 0.28mi | 3/2.0 | 1,415 (+0%) | 1mo | $229,600 | $162 | 86 |
| 204 Cosgrove Dr | 0.19mi | 3/2.0 | 1,376 (-3%) | 3mo | $219,000 | $159 | 84 |
| 54 University Blvd N | 0.28mi | 3/2.0 | 1,344 (-5%) | 1mo | $190,000 | $141 | 78 |
| 116 N University Blvd | 0.22mi | 4/2.0 (+1) | 1,350 (-4%) | 1mo | $225,000 | $167 | 77 |
| 104 University Blvd N | 0.25mi | 3/2.0 | 1,525 (+8%) | 2mo | $150,000 | $98 | 74 |
| 209 Norden Dr E | 0.26mi | 3/2.0 | 1,284 (-9%) | 0mo | $247,900 | $193 | 72 |
| 105 Village Cir W | 0.54mi | 3/2.0 | 1,403 (-1%) | 1mo | $185,500 | $132 | 72 |
| 301 Azalea Cir | 0.38mi | 2/2.0 (-1) | 1,310 (-7%) | 2mo | $205,000 | $156 | 63 |
| 113 Hilltop Dr E | 0.31mi | 4/2.0 (+1) | 1,625 (+15%) | 4mo | $250,000 | $154 | 53 |
| 120 Barbara Mitchell Dr E | 0.69mi | 3/2.0 | 1,246 (-12%) | 2mo | $306,000 | $246 | 47 |
Match score weights: distance 35% · size 25% · config 20% · recency 20%. Top-matched comps best support the ARV.
Projected returns pro-forma
-3.0% appreciation · 6.15% rent growth · sell at horizon
- IRR
- -5.3%
- Equity multiple
- 0.80×
- Total profit
- $-10,706
- Equity at exit
- $28,330
- IRR
- 7.5%
- Equity multiple
- 1.64×
- Total profit
- $33,808
- Equity at exit
- $16,428
Cash invested: $53,200 (down + closing). Projections, not guarantees.
Landlord ↔ Tenant lean methodology
- Overall (STATE)
- 90 Strongly Landlord-Friendly
- State Alabama
- 90 Strongly Landlord-Friendly · R+15
- County
- — inherits STATE
- City
- — inherits STATE
ZIP-level market 36608
- Rents YoY
- 6.2%
- Active inventory
- 338
- Price-to-rent
- 9.1×
Monthly cashflow live
- Estimated rent
- $1,732 high interval (Pro) →
- Mortgage (P&I)
- −$996
- Tax from tax record
- −$65 /mo · $776/yr
- Insurance
- −$79
- HOA
- −$0
- Vacancy / Maint / Mgmt
- −$364
- Net cashflow
- $228
Break-even live
UW: 25.0% down · 7.5% · 30yr · 1.5% tax · 5.0% vac · 8.0% maint · 8.0% mgmt
Financing live
Cash to close
- Down payment
- $47,500
- Closing costs
- $5,700
- Reserves months
- —
- Total cash needed
- —
Loan-product check · same deal, 3 products live
Conventional
25% down · 7.5% · 30yr
- Down + closing
- —
- Monthly P&I
- —
- Monthly cashflow
- —
- DSCR
- —
- Eligible?
- —
Personal DTI + credit; lowest rate.
DSCR
20% down · 8.5% · 30yr
- Down + closing
- —
- Monthly P&I
- —
- Monthly cashflow
- —
- DSCR
- —
- Eligible?
- —
No personal income docs; deal must DSCR.
Hard money
10% down · 12.0% · 12mo
- Down + closing
- —
- Monthly P&I
- —
- Monthly cashflow
- —
- DSCR
- —
- Eligible?
- —
Short-term bridge; refi at stabilization.
Rent comps 19 comps
| Address | Beds | Baths | Sqft | Rent | $/sqft | DOM | Units | Dist |
|---|---|---|---|---|---|---|---|---|
| 316 Syracuse St Mobile, AL | 3.0 | 2.0 | 1776 | $1,875 | $1.06 | 13d | 1 | 0.19mi |
| 304 N University Blvd Unit 1043721P Mobile, AL | 4.0 | 2.5 | 1496 | $4,148 | $2.77 | 21d | 1 | 0.22mi |
| 5263 Border Dr S Mobile, AL | 3.0 | 1.0 | 946 | $1,400 | $1.48 | 13d | 1 | 0.37mi |
| 5207 Azalea Cir S Mobile, AL | 3.0 | 2.0 | 1100 | $1,490 | $1.35 | 21d | 1 | 0.42mi |
| 5213 Pineview Ln S Mobile, AL | 3.0 | 1.0 | 1176 | $1,575 | $1.34 | 43d | 1 | 0.42mi |
| 112 S University Blvd Mobile, AL | 4.0 | 4.5 | 1472 | $1,810 | $1.23 | 13d | 5 | 0.58mi |
| 133 East Dr Mobile, AL | 1.0–2.0 | 1.0 | 821 | $1,024 | $1.25 | 13d | 4 | 0.68mi |
| 4657 Barbara Mitchell Dr Mobile, AL | 3.0 | 1.0 | 940 | $1,400 | $1.49 | 43d | 1 | 0.73mi |
| 6016 Magnolia Pl E Mobile, AL | 3.0 | 2.0 | 1600 | $1,800 | $1.12 | 43d | 1 | 0.90mi |
| 5477 Ardell Dr Unit 1043691P Mobile, AL | 3.0 | 2.0 | 1496 | $2,680 | $1.79 | 13d | 1 | 1.07mi |
| 4670 Rosewood Dr Mobile, AL | 3.0 | 2.0 | 1192 | $1,200 | $1.01 | 13d | 1 | 1.10mi |
| 912 Wendover Rd Unit 1043703P Mobile, AL | 4.0 | 2.5 | 1496 | $3,190 | $2.13 | 21d | 1 | 1.11mi |
| 5855 Woodvale Dr Mobile, AL | 3.0 | 1.5 | 1712 | $1,350 | $0.79 | 21d | 1 | 1.12mi |
| 914 David Langan Dr E Mobile, AL | 3.0 | 1.0 | 1080 | $1,450 | $1.34 | 43d | 1 | 1.22mi |
| 5904 Saint Gallen Ave S Unit 1043743P Mobile, AL | 4.0 | 2.0 | 1496 | $3,719 | $2.49 | 21d | 1 | 1.31mi |
| 1104 Garland St Mobile, AL | 3.0 | 1.0 | 1377 | $1,450 | $1.05 | 21d | 1 | 1.36mi |
| 6200 Airport Blvd Apt 174 Mobile, AL | 2.0 | 2.0 | 1000 | $1,050 | $1.05 | 43d | 1 | 1.38mi |
| 6474B Cedar Bend Ct Mobile, AL | 2.0 | 2.0 | 1444 | $1,600 | $1.11 | 43d | 1 | 1.48mi |
| 6200 Airport Blvd Unit 56 Mobile, AL | 2.0 | 1.0 | 1000 | $900 | $0.90 | 43d | 1 | 1.50mi |
Listing history 7 events
-
2026-06-18days on market $190,000 Active 8 DOM
-
2026-06-17days on market $190,000 Active 7 DOM
-
2026-06-16days on market $190,000 Active 6 DOM
-
2026-06-15days on market $190,000 Active 5 DOM
-
2026-06-14days on market $190,000 Active 3 DOM
-
2026-06-13remarks 699-char remark
-
2026-06-13$190,000 Active 2 DOM
ⓘ Source: listings_history table (triggers on properties + properties_extension) + one-shot
backfill from property_details.listing_events for pre-trigger history.
Tax reassessment forecast AL · Resets to sale price
- Current annual tax
- $776 · $65/mo
- Projected year-2 tax
- $779 · $65/mo
- Expected delta
- +$3/yr ($0/mo · 0.4%)
ⓘ Screening estimate from a state-policy table — verify with the county assessor before closing.
Climate risk First Street
- Flood 1/10 Low FEMA zone X (unshaded) · 0% chance over 30 yrs
- Wildfire 3/10 Moderate
- Heat 9/10 Extreme 7 d/yr ≥104°F today · 21 d/yr by 30 yrs out
- Wind 9/10 Extreme 99% chance of damaging wind over 30 yrs
- Air quality 1/10 Low 0 unhealthy d/yr today · 0 by 30 yrs out
Nearby sold comps map
Loading sold comps map…
Walkable amenities ~0.75 mi
Loading nearby amenities…
Taxation est. · year 1
- Rental income
- $20,778
- − Mortgage interest
- −$10,643
- − Property taxes
- −$776
- − Insurance
- −$950
- − Repairs & maintenance
- −$1,662
- − Management
- −$1,662
- − Depreciation
- −$5,527
- Taxable loss
- −$443
- Est. tax savings @ 24.0%
- +$106
- After-tax cash flow
- $2,838/yr
For passive investors: Depreciation is non-cash, so a rental often shows a tax loss while cash-flowing — sheltering income. Rental losses are passive: they offset passive income freely, and up to $25,000/yr can offset ordinary (W-2) income if you actively participate and your MAGI is under $100k (phasing out to $0 by $150k); unused losses carry forward. On sale, claimed depreciation is recaptured at up to 25%, and gains may owe capital-gains tax (a 1031 exchange can defer both). Figures are a year-1 estimate at your 24.0% rate — not tax advice; consult a CPA.
Schools (NCES district)
- District
- Mobile County
- NCES district ID
- 0102370
- Math proficiency
- 15% ▼ -28.00%
- Reading proficiency
- 39% ▬ 0.00%
- Median HH income
- $42,455
- Composite
- 22.9/100
- National rank
- #8002
- State rank
- #81 of 129 in AL
Livability — Mobile
- Score
- 75/100
- State rank
- #20
- US rank
- #4262
Category grades
Schools grade is shown separately in the Schools card above.
Census & demographics
- Census place
- Mobile, AL
- County
- Mobile County · 246,577 people
- City population
- 205,729
- Metro
- Mobile, AL
- Population (ZIP)
- 38,890
- Household income
- $61,146
- Rent vs Own
- Severe rent burden
- 1823.0
Population outlook (Mobile County) Hauer SSP2
- Today (2025)
- 415,303 people
- By 2030
- 411,755 · -0.9%
- By 2040
- 399,670 · -3.8%
- By 2050
- 382,616 · -7.9%
- By 2075
- 337,353 · -18.8%
- By 2100
- 283,391 · -31.8%
Race, ethnicity, and origin ACS 2023
- Neighborhood character
- Diverse neighborhood (Simpson 0.56)
- Race & ethnicity
- White 56% Black 35% Two or more races 4% Hispanic / Latino 4% Asian 2%
- Common ancestry
- Lithuanian 3% Italian 2% Slovak 2%
- Foreign-born
- 4% · Canada
- Languages at home
- 95% English-only · Spanish 2% Arabic 1% Other Indo-European 1%
Political lean MEDSL · Mobile
- 2024 margin
- R (+16.4) · D 41.3% · R 57.7%
- 2008→2024 swing
- -7.7pp toward R · 2008: -8.7pp · 2024: -16.4pp
- All cycles
- 2024: R+16.4 2020: R+11.9 2016: R+13.9 2012: R+9.3 2008: R+8.7
Not yet ingested
- Civics
- —
Market trends
- HPI YoY
- ▼ -224.52%
- Current HPI
- 198.9469
- Rent YoY
- ▲ 6.15%
- Metro
- Mobile, AL
- State GDP YoY
- ▲ 2.94%
- F500 in state
- 4
Industry mix (Fortune 500 HQ in AL)
| Industry | F500 HQs | Revenue |
|---|---|---|
| Financial Services | 1 | $8B |
|
||
| Healthcare | 1 | $5B |
|
||
Price history
+192.3% since first listed5 events — show timeline
- 2026-06-11 Listed $190,000 GCMLS AL
- 2014-11-21 Sold (Public Records) $110,420 Public Records
- 2009-11-25 Sold (Public Records) $118,800 Public Records
- 2007-07-09 Sold (Public Records) $135,000 Public Records
- 2007-03-29 Sold (Public Records) $65,000 Public Records
Property tax history
-3.5%/yrLatest (2025): $776 · +1.0% YoY. Source: county tax records.
Cash-flow waterfall
monthlySold comps — $/sqft
last 12 mo · ≤1 miLoading sold comps…