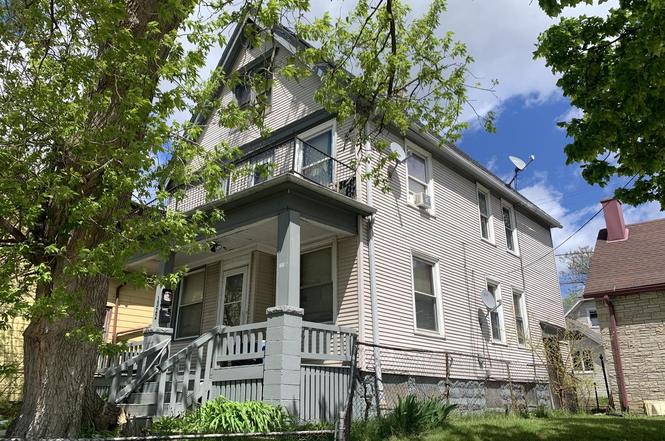
1322 W Hopkins St Unit 1322-A · Milwaukee, WI
Flood risk 1/10 · Minimal
- FEMA flood zone
- X (unshaded)
- Chance of flooding over 30 yrs
- 0.0%
- Est. flood insurance / yr
- $473 – $860
Fire risk 1/10 · Minimal
- Est. fire insurance / yr
- $636 – $1,182
Heat risk 2/10 · Minimal
- Hot days now (above 98°F)
- 7 days/yr
- Hot days in 30 yrs
- 13 days/yr
Wind risk 2/10 · Minimal
- Chance of severe wind over 30 yrs
- —
Air-quality risk 3/10 · Minor
- Unhealthy air days now
- 3 days/yr
- Unhealthy air days in 30 yrs
- 4 days/yr
Risk factors via First Street. Map © Google.
Why this score? — see what drove the A grade
The composite is a weighted blend of 9 inputs, each scored 0–100. Each bar is that input's sub-score; the figure is the points it added to the 100-point composite (weight × sub-score).
- Cash flow +30.0/30.0
- ARV discount +13.4/15.0
- 1% rule +10.0/10.0
- DSCR +10.0/10.0
- Appreciation +10.0/10.0
- Rent growth +4.6/5.0
- Livability +4.0/5.0
- Condition / age +2.5/5.0
- Schools +1.2/10.0
$78,000
🖨 Deal sheet 📄 Offer letter ✓ Due diligence
Listing remarks
REHABBERS AND LANDLORDS: This 2/2 Duplex with a full basement needs your cosmetic cleanup. Upper unit is rented for $750/mo MTM giving you instant cash flow, and the lower is vacant for your fix-up. Your tenants pay their own heat and electricity. All mechanicals are upgraded, including circuit breakers and newer furnaces & water heaters. It has maintenance-free vinyl siding and most windows are newer vinyl. Make this a cash-flowing addition to your rental portfolio. Sold in AS-IS condition. Room sizes are estimated.
Key facts
- 2,178 sq ft lot
- Built 1900
Property features AI
Finance
- Other: All items on the premises as of closing are included without warranties; no exclusions listed
- Financial info: Total of 2 units in the building
- HOA & community: No yearly HOA fee
Exterior
- Utilities: Municipal water; Municipal sewer; 2 electric meters; 2 gas meters
- Home design: Duplex, 2-story; Multi-family property; Estimated living area between 751 and 1,000 sq ft per unit
- Construction: Less than 1/2 acre lot (approximately 0.05 acre); Year built information from assessor/public record
- Exterior features: Vinyl exterior; Zoning: RT4 (two-family residential)
Interior
- Kitchen: Unit 2 kitchen on upper level
- Bedrooms: Unit 1: 2 bedrooms; Unit 2: 2 bedrooms (master on upper level)
- Bathrooms: Unit 1: 1 full bathroom; Unit 2: 1 full bathroom
- Interior features: Full basement
Neighborhood map
What this means for you Summary
Snapshot
- This is a 4-bed/2.0-bath single-family listed at $78k.
Deal economics
- At list price, monthly cash flow is $810 ($10k/yr) — positive.
- The deal already cash-flows at list — no discount required.
- Meets the 1% rule at list price ($2k rent vs $78k).
- Cap rate 18.8% vs local median 5.1% in Milwaukee — top-decile yield for the area; either an underpriced asset or a hidden risk that comps aren't pricing in. Stress-test before assuming the spread holds.
Location & tenants
- Location reads 81/100 on livability (#55 in WI, #1,534 nationally) — a professional / high-income tenant draw. Strengths: amenities A+, commute A+, cost of living A+; Watch: employment D+, schools F, crime F.
- Milwaukee School District (urban): math 10% / reading 18% proficiency, ranked #337 of 342 in WI (top 98%) — low school quality limits family demand, transient renter base, plan for 1-2y turnover; 77% free/reduced lunch — lower-income household profile, screen leases tightly.
- Market conditions: Rents rising fast (+8.3%/yr); 150 active listings in the ZIP; 16 comparable units currently listed for rent nearby; rentals at typical pace (median 24d on market — plan ~3-4 weeks tenant-placement turnaround); lower-income renter base — watch delinquency; 1,017 units permitted in Milwaukee County in 2024 (803 in 5+ unit buildings).
- At $1,708/mo this rent would consume 70% of the median local household income ($29k/yr) (locally 2061% of renters already pay >50% of income on rent) — very limited rent-growth headroom before tenants either downsize or default.
Forward outlook
- In year one you build about $8k of equity ($539 loan paydown + $8k appreciation (10.0% local appreciation)).
- Milwaukee County population projected at +4% by 2050 — modest demand growth; plan on rents tracking national, not racing it.
- At projected returns (10.0% appreciation + 8.0% rent growth), your $22k cash investment doubles in ~2 years — after that, you're playing with house money.
- By year 5, paydown + projected appreciation supports a ~$39k cash-out refi (75% LTV) — recoverable capital for the next deal without selling this one.
Negotiation context
- Only 2 days on market — expect competitive offers; lowballing is unlikely to land.
- 2 sale attempts since 2y ago with the ask held roughly flat each time — persistent listings suggest the price (not the market) is what's stuck; bring a comps-based counter.
Risks & watch-outs
- Watch-outs: built in 1900 — expect roof / HVAC / electrical / plumbing capex.
Questions for the listing agent
- Built in 1900 — when were the roof, HVAC, electrical panel, plumbing, and water heater last replaced?
- Is there a deadline driving the sale (1031 exchange, divorce, estate, relocation)? That informs how much negotiation room exists.
- Schools are F-rated, which usually means shorter tenancies and higher turnover. Who's the typical renter profile here, and what's been the actual vacancy rate?
- Crime grade is F in this area — have there been break-ins, vandalism, or insurance claims at this property in the last 3 years? What carrier currently insures it and at what premium?
- What's the average days-on-market for RENTAL listings here right now (not sales)? A rising rental-DOM trend means longer vacancies and softer asking-rent achievability than the comps imply.
- What's the recent tenant-quality profile in this submarket — average credit score on applications, eviction rate, late-payment / NSF rate, and stable-employment percentage? A property-management company in the area should have these aggregated.
- How much new for-sale + rental construction is in the pipeline within 1–3 miles? Heavy new supply typically softens prices + rents 12–24 months out; constrained supply supports both.
Investment metrics
- 1% rule
- 2.19% ✓
- Cap rate
- 18.75%
- Cash-on-cash
- 44.50%
- DSCR
- 2.98
- GRM
- 3.8
CMA / ARV
- ARV (on-the-fly)
- $89,658
- Comps found
- 12
Show comp detail 12 sales within ~0.75 mi
| Address | Dist | Beds/Ba | Sqft | Sold | Price | $/sf | Match |
|---|---|---|---|---|---|---|---|
| 2814 N 12th St | 0.11mi | 4/4.0 | 1,867 (+6%) | 2mo | $60,000 | $32 | 75 |
| 2436 N 16th St | 0.44mi | 4/2.0 | 1,668 (-5%) | 1mo | $50,000 | $30 | 70 |
| 1809 W Wright St | 0.50mi | 3/2.5 (-1) | 1,771 (+1%) | 1mo | $230,000 | $130 | 68 |
| 1122 W Wright St | 0.31mi | 5/1.0 (+1) | 1,810 (+3%) | 4mo | $43,500 | $24 | 68 |
| 3146 N 15th St | 0.53mi | 5/1.5 (+1) | 1,761 (+0%) | 5mo | $90,000 | $51 | 64 |
| 2774 N 7th St | 0.42mi | 3/2.0 (-1) | 1,640 (-7%) | 2mo | $164,000 | $100 | 63 |
| 3206 N 12th St | 0.58mi | 4/1.0 | 1,710 (-3%) | 3mo | $25,800 | $15 | 62 |
| 3230 N 12th St | 0.61mi | 5/1.0 (+1) | 1,762 (+0%) | 4mo | $140,000 | $79 | 59 |
| 1540 W Groeling Ave | 0.33mi | 4/1.0 | 1,535 (-13%) | 6mo | $68,000 | $44 | 54 |
| 2548 N 18th St | 0.42mi | 4/1.5 | 1,510 (-14%) | 2mo | $130,000 | $86 | 53 |
| 2463 N 22nd St | 0.71mi | 5/2.0 (+1) | 1,678 (-5%) | 4mo | $55,000 | $33 | 51 |
| 2120 N 11th St | 0.71mi | 5/2.0 (+1) | 1,569 (-11%) | 6mo | $83,750 | $53 | 39 |
Match score weights: distance 35% · size 25% · config 20% · recency 20%. Top-matched comps best support the ARV.
Projected returns pro-forma
10.0% appreciation · 8.0% rent growth · sell at horizon
- IRR
- 62.6%
- Equity multiple
- 5.72×
- Total profit
- $103,114
- Equity at exit
- $70,269
- IRR
- 58.2%
- Equity multiple
- 14.07×
- Total profit
- $285,496
- Equity at exit
- $151,537
Cash invested: $21,840 (down + closing). Projections, not guarantees.
Landlord ↔ Tenant lean methodology
- Overall (STATE)
- 73 Landlord-Friendly
- State Wisconsin
- 73 Landlord-Friendly · R+2
- County
- — inherits STATE
- City
- — inherits STATE
ZIP-level market 53206
- Rents YoY
- 8.3%
- Active inventory
- 150
- Price-to-rent
- 3.8×
Monthly cashflow live
- Estimated rent
- $1,708 high interval (Pro) →
- Mortgage (P&I)
- −$409
- Tax est. 1.5%
- −$98 /mo · $1,170/yr
- Insurance
- −$32
- HOA
- −$0
- Vacancy / Maint / Mgmt
- −$359
- Net cashflow
- $810
Break-even live
UW: 25.0% down · 7.5% · 30yr · 1.5% tax · 5.0% vac · 8.0% maint · 8.0% mgmt
Financing live
Cash to close
- Down payment
- $19,500
- Closing costs
- $2,340
- Reserves months
- —
- Total cash needed
- —
Loan-product check · same deal, 3 products live
Conventional
25% down · 7.5% · 30yr
- Down + closing
- —
- Monthly P&I
- —
- Monthly cashflow
- —
- DSCR
- —
- Eligible?
- —
Personal DTI + credit; lowest rate.
DSCR
20% down · 8.5% · 30yr
- Down + closing
- —
- Monthly P&I
- —
- Monthly cashflow
- —
- DSCR
- —
- Eligible?
- —
No personal income docs; deal must DSCR.
Hard money
10% down · 12.0% · 12mo
- Down + closing
- —
- Monthly P&I
- —
- Monthly cashflow
- —
- DSCR
- —
- Eligible?
- —
Short-term bridge; refi at stabilization.
Rent comps 16 comps
| Address | Beds | Baths | Sqft | Rent | $/sqft | DOM | Units | Dist |
|---|---|---|---|---|---|---|---|---|
| 2308 W Clarke St Milwaukee, WI | 4.0 | 2.0 | 1545 | $1,750 | $1.13 | 23d | 1 | 0.70mi |
| 2634 N Doctor M.L.K. Jr Dr Milwaukee, WI | 5.0 | 2.5 | 2512 | $3,700 | $1.47 | 43d | 1 | 0.73mi |
| 2119 W Brown St Milwaukee, WI | 3.0 | 1.0 | 1754 | $995 | $0.57 | 3d | 1 | 1.01mi |
| 3042 N Palmer St #5 Milwaukee, WI | 3.0 | 1.0 | 1718 | $1,050 | $0.61 | 23d | 1 | 1.04mi |
| 2809 W Clarke St Unit 12811 Milwaukee, WI | 3.0 | 1.0 | 1400 | $1,200 | $0.86 | 17d | 1 | 1.08mi |
| 2432 N 28th St Milwaukee, WI | 5.0 | 1.5 | 1876 | $1,600 | $0.85 | 43d | 1 | 1.09mi |
| 2507 N Buffum St Milwaukee, WI | 3.0 | 1.0 | 1300 | $1,375 | $1.06 | 20d | 1 | 1.10mi |
| 2870 N 29th St #2872 Milwaukee, WI | 3.0 | 1.0 | 1300 | $1,250 | $0.96 | 43d | 1 | 1.11mi |
| 2106A W Keefe Ave Unit 2106 Lower Milwaukee, WI | 3.0 | 1.0 | 1300 | $1,100 | $0.85 | 17d | 1 | 1.14mi |
| 400 E Meinecke Ave #402 Milwaukee, WI | 3.0 | 1.0 | 1700 | $1,800 | $1.06 | 16d | 1 | 1.16mi |
| 2704 W Concordia Ave Unit Na Milwaukee, WI | 5.0 | 2.0 | 1856 | $2,500 | $1.35 | 23d | 1 | 1.26mi |
| 2012 N Buffum St Milwaukee, WI | 3.0 | 2.5 | 2200 | $2,695 | $1.23 | 43d | 1 | 1.34mi |
| 312 E Townsend St Unit 312 Milwaukee, WI | 3.0 | 1.0 | 1400 | $1,250 | $0.89 | 23d | 1 | 1.37mi |
| 2772 N Bremen St #2774 Milwaukee, WI | 3.0 | 1.0 | 1500 | $1,795 | $1.20 | 43d | 1 | 1.42mi |
| 901 W Winnebago St Milwaukee, WI | 1.0–3.0 | 1.0–2.0 | 1359 | $2,629 | $1.93 | 2d | 10 | 1.47mi |
| 2429 N Weil St Milwaukee, WI | 3.0 | 1.0 | 1300 | $1,500 | $1.15 | 43d | 1 | 1.49mi |
Listing history 4 events
-
2026-06-18days on market $78,000 Active 2 DOM
-
2026-06-18remarks 524-char remark
-
2026-06-17remarks 262-char remark
-
2026-06-17$78,000 Active 1 DOM
ⓘ Source: listings_history table (triggers on properties + properties_extension) + one-shot
backfill from property_details.listing_events for pre-trigger history.
Climate risk First Street
- Flood 1/10 Low FEMA zone X (unshaded) · 0% chance over 30 yrs
- Wildfire 1/10 Low
- Heat 2/10 Low 7 d/yr ≥98°F today · 13 d/yr by 30 yrs out
- Wind 2/10 Low
- Air quality 3/10 Moderate 3 unhealthy d/yr today · 4 by 30 yrs out
Nearby sold comps map
Loading sold comps map…
Walkable amenities ~0.75 mi
Loading nearby amenities…
Taxation est. · year 1
- Rental income
- $20,490
- − Mortgage interest
- −$4,369
- − Property taxes
- −$1,170
- − Insurance
- −$390
- − Repairs & maintenance
- −$1,639
- − Management
- −$1,639
- − Depreciation
- −$2,269
- Taxable income
- $9,014
- Est. tax owed @ 24.0%
- −$2,163
- After-tax cash flow
- $7,556/yr
For passive investors: Depreciation is non-cash, so a rental often shows a tax loss while cash-flowing — sheltering income. Rental losses are passive: they offset passive income freely, and up to $25,000/yr can offset ordinary (W-2) income if you actively participate and your MAGI is under $100k (phasing out to $0 by $150k); unused losses carry forward. On sale, claimed depreciation is recaptured at up to 25%, and gains may owe capital-gains tax (a 1031 exchange can defer both). Figures are a year-1 estimate at your 24.0% rate — not tax advice; consult a CPA.
Schools (NCES district)
- District
- Milwaukee School District
- NCES district ID
- 5509600
- Math proficiency
- 10% ▼ -5.00%
- Reading proficiency
- 18% ▬ 0.00%
- Median HH income
- $36,339
- Composite
- 11.61/100
- National rank
- #9696
- State rank
- #337 of 342 in WI
Livability — Milwaukee
- Score
- 81/100
- State rank
- #55
- US rank
- #1534
Category grades
Schools grade is shown separately in the Schools card above.
Census & demographics
- Census place
- Milwaukee, WI
- County
- Milwaukee County · 926,379 people
- City population
- 573,768
- Metro
- Milwaukee-Waukesha, WI
- Population (ZIP)
- 19,887
- Household income
- $29,336
- Rent vs Own
- Severe rent burden
- 2061.0
Population outlook (Milwaukee County) Hauer SSP2
- Today (2025)
- 995,758 people
- By 2030
- 1,009,124 · +1.3%
- By 2040
- 1,028,128 · +3.3%
- By 2050
- 1,040,066 · +4.4%
- By 2075
- 1,057,849 · +6.2%
- By 2100
- 1,039,774 · +4.4%
Race, ethnicity, and origin ACS 2023
- Neighborhood character
- Predominantly Black (91%)
- Race & ethnicity
- Black 91% Two or more races 3% White 3% Hispanic / Latino 3%
- Common ancestry
- Norwegian 1%
- Foreign-born
- 1% · Canada
- Languages at home
- 97% English-only · Spanish 2%
Political lean MEDSL · Milwaukee
- 2024 margin
- Solid D (+38.5) · D 68.3% · R 29.8% · Other 1.8%
- 2008→2024 swing
- +2.7pp toward D · 2008: 35.9pp · 2024: 38.5pp
- All cycles
- 2024: D+38.5 2020: D+39.9 2016: D+37.5 2012: D+34.6 2008: D+35.9
Not yet ingested
- Civics
- —
Market trends
- HPI YoY
- ▲ 133.03%
- Current HPI
- 397.7151
- Rent YoY
- ▲ 8.28%
- Metro
- Milwaukee-Waukesha, WI
- State GDP YoY
- ▲ 2.10%
- F500 in state
- 20
Industry mix (Fortune 500 HQ in WI)
| Industry | F500 HQs | Revenue |
|---|---|---|
| Industrial Machinery | 4 | $23B |
|
||
| Industrial Technology | 2 | $36B |
|
||
| Insurance | 1 | $36B |
|
||
| Professional Services | 1 | $19B |
|
||
| Utilities | 1 | $9B |
|
||
| Consumer Goods | 1 | $3B |
|
||
Price history
3 events — show timeline
- 2026-06-17 Listed $78,000 METROMLS
- 2024-12-24 Rental Removed $700 PROPERTYWARE
- 2024-11-23 Listed for Rent $700 PROPERTYWARE
Cash-flow waterfall
monthlySold comps — $/sqft
last 12 mo · ≤1 miLoading sold comps…