 🏗️ New Construction
Cohen Plan · Castroville, TX
Flood risk 1/10 · Minimal
- FEMA flood zone
- X (unshaded)
- Chance of flooding over 30 yrs
- 0.0%
- Est. flood insurance / yr
- $507 – $1,088
Fire risk 5/10 · Moderate
- Est. fire insurance / yr
- $1,222 – $2,270
Heat risk 7/10 · Major
- Hot days now (above 108°F)
- 6 days/yr
- Hot days in 30 yrs
- 19 days/yr
Wind risk 6/10 · Moderate
- Chance of severe wind over 30 yrs
- 70.0%
Air-quality risk 2/10 · Minimal
- Unhealthy air days now
- 0 days/yr
- Unhealthy air days in 30 yrs
- 1 days/yr
Risk factors via First Street. Map © Google.
Why this score? — see what drove the D- grade
The composite is a weighted blend of 9 inputs, each scored 0–100. Each bar is that input's sub-score; the figure is the points it added to the 100-point composite (weight × sub-score).
- Cash flow +10.1/30.0
- ARV discount +7.5/15.0
- Schools +4.4/10.0
- Livability +3.7/5.0
- 1% rule +3.0/10.0
- DSCR +2.9/10.0
- Rent growth +2.5/5.0
- Condition / age +1.0/5.0
- Appreciation +0.0/10.0
$510,990
🖨 Deal sheet (PDF) 📄 Offer letter ✓ Due diligence
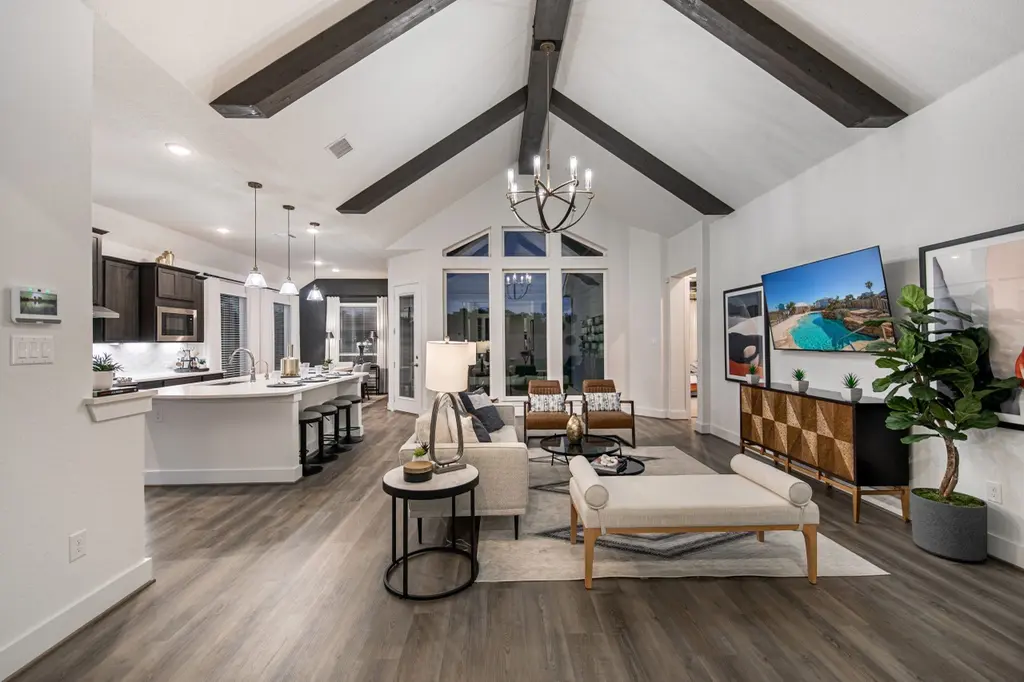
Listing remarks
Welcome to The Cohen-a home crafted for the most discerning and largest families, now available on a magnificent 65' lot! Embrace the grandeur of this exquisite residence, boasting 5 bedrooms, 4 baths, 1 powder bath, a separate formal dining area, a delightful game room, and an expansive outdoor patio, creating the perfect haven for making cherished memories with loved ones. The first floor is a masterpiece in itself, featuring the luxurious master retreat, providing an oasis of tranquility, along with a secondary bedroom, ideal for an in-law or secondary suite. The open concept design seamlessly connects the kitchen, dining, and family rooms, stretching the entire width of the home. The he
Key facts
- Master retreat
- Open concept design
- Formal dining area
Tags
Property features AI
Finance
- Financial info: List price $530,990
Exterior
- Parking: Three parking spaces
- Home design: Single-family plan (Cohen)
- Exterior features: Living area of 3,033 (living space)
Interior
- Bedrooms: Five bedrooms
- Bathrooms: Four full baths and one half bath
- Interior features: Active listing — Plan named "Cohen"
Neighborhood map
What this means for you Summary
Snapshot
- This is a 5-bed/4.5-bath single-family listed at $511k. Condition is rated poor.
Deal economics
- At list price, monthly cash flow is $-437 ($-5k/yr) — negative.
- The deal already cash-flows at list — no discount required.
- Meets the 1% rule at list price ($6k rent vs $511k).
- Recommended offer: $496k (3.0% below list) — sets the bar for market timing.
- Cap rate 5.6% vs local median 2.7% in Castroville — top-decile yield for the area; either an underpriced asset or a hidden risk that comps aren't pricing in. Stress-test before assuming the spread holds.
Location & tenants
- Location reads 73/100 on livability (#212 in TX) — a middle-class / working-renter tenant base. Strengths: cost of living A+, housing A+, crime B; Watch: health & safety D+, amenities F, commute F.
- Medina Valley ISD (rural): math 48% / reading 53% proficiency, ranked #148 of 826 in TX (top 18%) — acceptable for families but not a draw, mixed tenant base, ~2y average lease.
- Market conditions: 441 active listings in the ZIP; 4 comparable units currently listed for rent nearby; rentals lingering (median 44d on market — plan ~5-8 weeks vacancy on turnover, expect pricing pressure); 50% of comp listings sitting > 30 days — soft ceiling on asking rent; 102 units permitted in Medina County in 2024 (0 in 5+ unit buildings).
Forward outlook
- Local home prices are declining (-3.0%/yr); year-one equity from $5k of loan paydown is wiped out by about $22k of value loss. Plan a longer hold.
- Medina County population projected at +24% by 2050 — long-run rental-demand tailwind backs the buy-and-hold thesis.
Negotiation context
- It's been on market 34 days — a 3% lower offer ($496k) is reasonable based on typical stale-listing flexibility.
Risks & watch-outs
- Climate carrying-cost: major wind risk, 70% chance of damaging wind over 30y; moderate wildfire risk; extreme-heat days projected 6→19/yr by 2055 (HVAC capex compounding) — expect insurance premiums to compound above CPI over the hold.
Questions for the listing agent
- What do current leases actually rent for vs. the listed asking? Can we see a recent rent roll and the last 12 months of T-12 income?
- It's been on market 34 days. Have you received any prior offers? Is the seller open to a 3% concession, seller financing, or rate buy-down credit?
- Have any recent inspections been done? Can we get a copy of the seller's disclosures and any deferred-maintenance estimates?
- Is there a deadline driving the sale (1031 exchange, divorce, estate, relocation)? That informs how much negotiation room exists.
- The area grade is low — what's the realistic commute time and amenity access for the typical tenant pool here? Any planned neighborhood developments (good or bad) we should know about?
- What's the average days-on-market for RENTAL listings here right now (not sales)? A rising rental-DOM trend means longer vacancies and softer asking-rent achievability than the comps imply.
- What's the recent tenant-quality profile in this submarket — average credit score on applications, eviction rate, late-payment / NSF rate, and stable-employment percentage? A property-management company in the area should have these aggregated.
- How much new for-sale + rental construction is in the pipeline within 1–3 miles? Heavy new supply typically softens prices + rents 12–24 months out; constrained supply supports both.
Investment metrics
- 1% rule
- 0.80% ✗
- Cap rate
- 5.59%
- Cash-on-cash
- -2.50%
- DSCR
- 0.89
- GRM
- 10.4
CMA / ARV
- ARV (median comp)
- $747,197
- List price
- $510,990
- Delta
- -31.61%
- Verdict
- UNDERPRICED
- Comps
- 20 within 1.0 mi
Show comp detail 12 sales within ~0.75 mi
| Address | Dist | Beds/Ba | Sqft | Sold | Price | $/sf | Match |
|---|---|---|---|---|---|---|---|
| 873 County Road 375 | 0.33mi | 4/4.0 (-1) | 3,037 (+0%) | 10mo | $720,000 | $237 | 69 |
| 235 Poe | 0.47mi | 4/3.5 (-1) | 3,101 (+2%) | 5mo | $599,900 | $193 | 61 |
| 165 Poe Pkwy | 0.40mi | 4/3.5 (-1) | 2,849 (-6%) | 5mo | $599,900 | $211 | 58 |
| 280 Sittre Dr | 0.63mi | 4/3.5 (-1) | 3,003 (-1%) | 4mo | $545,000 | $181 | 56 |
| 117 Poe Pkwy | 0.35mi | 4/3.5 (-1) | 2,774 (-8%) | 8mo | $599,990 | $216 | 54 |
| 267 Sweet Rose | 0.71mi | 4/3.5 (-1) | 3,094 (+2%) | 1mo | $549,000 | $177 | 54 |
| 242 Sittre Dr | 0.61mi | 4/3.5 (-1) | 3,094 (+2%) | 9mo | $515,900 | $167 | 52 |
| 250 Matthew Path | 0.47mi | 4/3.5 (-1) | 3,325 (+10%) | 1mo | $699,900 | $210 | 52 |
| 239 Sittre Dr | 0.57mi | 4/3.0 (-1) | 3,324 (+10%) | 0mo | $635,000 | $191 | 46 |
| 237 Bryant Park | 0.54mi | 4/3.5 (-1) | 2,774 (-8%) | 8mo | $569,990 | $205 | 45 |
| 145 Mary Ella Dr | 0.48mi | 4/3.0 (-1) | 2,613 (-14%) | 0mo | $625,000 | $239 | 44 |
| 219 Bryant Park | 0.55mi | 4/3.5 (-1) | 2,774 (-8%) | 9mo | $588,990 | $212 | 43 |
Match score weights: distance 35% · size 25% · config 20% · recency 20%. Top-matched comps best support the ARV.
Projected returns pro-forma
-3.0% appreciation · 3.0% rent growth · sell at horizon
- IRR
- -20.4%
- Equity multiple
- 0.29×
- Total profit
- $-148,795
- Equity at exit
- $111,410
- IRR
- -13.6%
- Equity multiple
- 0.21×
- Total profit
- $-165,007
- Equity at exit
- $64,604
Cash invested: $209,215 (down + closing). Projections, not guarantees.
Landlord ↔ Tenant lean methodology
- Overall (STATE)
- 87 Strongly Landlord-Friendly
- State Texas
- 87 Strongly Landlord-Friendly · R+5
- County
- — inherits STATE
- City
- — inherits STATE
ZIP-level market 78009
- Home prices YoY
- -21.1%
- Active inventory
- 441
- Price-to-rent
- 7.1×
Monthly cashflow live
- Estimated rent
- $5,984 medium interval (Pro) →
- Mortgage (P&I)
- −$3,918
- Tax est. 1.5%
- −$934 /mo · $11,208/yr
- Insurance
- −$311
- HOA
- −$0
- Vacancy / Maint / Mgmt
- −$1,257
- Net cashflow
- $-437
Break-even live
Sensitivity live
| Price | -10% $80 | -5% $-178 | +0% $-437 | +5% $-695 | +10% $-953 |
|---|---|---|---|---|---|
| Rent | -10% $-909 | -5% $-673 | +0% $-437 | +5% $-200 | +10% $36 |
| Rate | -1.0pp $-60 | -0.5pp $-247 | base $-437 | +0.5pp $-630 | +1.0pp $-827 |
UW: 25.0% down · 7.5% · 30yr · 1.5% tax · 5.0% vac · 8.0% maint · 8.0% mgmt
Financing live
Cash to close
- Down payment
- $186,799
- Closing costs
- $22,416
- Reserves months
- —
- Total cash needed
- —
Loan-product check · same deal, 3 products live
Conventional
25% down · 7.5% · 30yr
- Down + closing
- —
- Monthly P&I
- —
- Monthly cashflow
- —
- DSCR
- —
- Eligible?
- —
Personal DTI + credit; lowest rate.
DSCR
20% down · 8.5% · 30yr
- Down + closing
- —
- Monthly P&I
- —
- Monthly cashflow
- —
- DSCR
- —
- Eligible?
- —
No personal income docs; deal must DSCR.
Hard money
10% down · 12.0% · 12mo
- Down + closing
- —
- Monthly P&I
- —
- Monthly cashflow
- —
- DSCR
- —
- Eligible?
- —
Short-term bridge; refi at stabilization.
Rent comps 4 comps
| Address | Beds | Baths | Sqft | Rent | $/sqft | DOM | Units | Dist |
|---|---|---|---|---|---|---|---|---|
| 268 Englewood Ln Castroville, TX | 5.0 | 4.5 | 4022 | $7,200 | $1.79 | 5d | 1 | 0.12mi |
| 270 Lilly Blf Castroville, TX | 4.0 | 3.0 | 2958 | $3,600 | $1.22 | 44d | 1 | 0.88mi |
| 252 Elisabeth Run San Antonio, TX | 5.0 | 2.5 | 2614 | $1,995 | $0.76 | 45d | 1 | 1.36mi |
| 206 Nesting Cyn San Antonio, TX | 4.0 | 2.5 | 2492 | $1,741 | $0.70 | 5d | 1 | 1.45mi |
Listing history 14 events
-
2026-06-18days on market $510,990 Active 34 DOM
-
2026-06-17days on market $510,990 Active 33 DOM
-
2026-06-16pricedays on market $510,990 Active 32 DOM
-
2026-06-15days on market $530,990 Active 31 DOM
-
2026-06-13days on market $530,990 Active 29 DOM
-
2026-06-09days on market $530,990 Active 25 DOM
-
2026-06-08days on market $530,990 Active 24 DOM
-
2026-06-07days on market $530,990 Active 23 DOM
-
2026-06-04days on market $530,990 Active 20 DOM
-
2026-06-03days on market $530,990 Active 19 DOM
-
2026-06-02days on market $530,990 Active 18 DOM
-
2026-06-02days on market $530,990 Active 17 DOM
-
2026-05-31days on market $530,990 Active 16 DOM
-
2026-05-15$530,990 Active 1485-char remark
ⓘ Source: listings_history table (triggers on properties + properties_extension) + one-shot
backfill from property_details.listing_events for pre-trigger history.
Climate risk First Street
- Flood 1/10 Low FEMA zone X (unshaded) · 0% chance over 30 yrs
- Wildfire 5/10 Major
- Heat 7/10 Severe 6 d/yr ≥108°F today · 19 d/yr by 30 yrs out
- Wind 6/10 Major 70% chance of damaging wind over 30 yrs
- Air quality 2/10 Low 0 unhealthy d/yr today · 1 by 30 yrs out
Nearby sold comps map
Loading sold comps map…
Walkable amenities ~0.75 mi
Loading nearby amenities…
Taxation est. · year 1
- Rental income
- $71,804
- − Mortgage interest
- −$41,855
- − Property taxes
- −$11,208
- − Insurance
- −$3,736
- − Repairs & maintenance
- −$5,744
- − Management
- −$5,744
- − Depreciation
- −$21,737
- Taxable loss
- −$18,220
- Est. tax savings @ 24.0%
- +$4,373
- After-tax cash flow
- $-866/yr
For passive investors: Depreciation is non-cash, so a rental often shows a tax loss while cash-flowing — sheltering income. Rental losses are passive: they offset passive income freely, and up to $25,000/yr can offset ordinary (W-2) income if you actively participate and your MAGI is under $100k (phasing out to $0 by $150k); unused losses carry forward. On sale, claimed depreciation is recaptured at up to 25%, and gains may owe capital-gains tax (a 1031 exchange can defer both). Figures are a year-1 estimate at your 24.0% rate — not tax advice; consult a CPA.
Condition & rehab AI · 1 photo
This home requires extensive repairs and updates to improve its condition and value. Significant work is needed on the roof, exterior, flooring, and HVAC system, along with landscaping and interior updates. The home's poor condition and lack of curb appeal make it a high-potential investment for renovation.
Repairs flagged
- Major roof repair — Significant damage and potential leaks.
- Major exterior siding repair — Severe wear and peeling paint.
- Major flooring replacement — Severe wear and tear.
- Major paint repair and repainting — Severe wear and peeling paint.
- Major HVAC system replacement — Visible damage to condensers, indicating potential cooling issues.
- Major landscaping and curb appeal improvements — Sparse vegetation and minimal landscaping features.
Value-add opportunities
- Resale Roof repair and replacement — A new roof will significantly improve the home's appearance and value.
- Resale Exterior siding repair and repainting — A new siding and paint job will enhance the home's curb appeal and value.
- Resale Flooring replacement — New flooring will improve the home's appearance and value.
- Resale Paint repair and repainting — A fresh coat of paint will improve the home's appearance and value.
- Resale HVAC system replacement — A new HVAC system will improve comfort and energy efficiency, enhancing the home's value.
- Resale Landscaping and curb appeal improvements — A well-maintained landscape will enhance the home's curb appeal and value.
- Rental Interior updates — Fresh paint and minor updates will make the home more appealing to renters and improve its rental value.
- Both Kitchen and bathroom updates — Modernizing the kitchen and bathrooms will improve the home's overall appeal and value for both resale and rental purposes.
Renovation cost estimate screening
| Repair item | Severity | Est. cost |
|---|---|---|
| roof repair · Significant damage and potential leaks. | Major | $15,000–50,000 |
| exterior siding repair · Severe wear and peeling paint. | Major | $15,000–50,000 |
| flooring replacement · Severe wear and tear. | Major | $15,000–50,000 |
| paint repair and repainting · Severe wear and peeling paint. | Major | $15,000–50,000 |
| HVAC system replacement · Visible damage to condensers, indicating potential cooling issues. | Major | $15,000–50,000 |
| landscaping and curb appeal improvements · Sparse vegetation and minimal landscaping features. | Major | $15,000–50,000 |
| Total estimated repair cost · 6 items | $90,000–300,000 |
Value-add ROI direction
- Resale Roof repair and replacement — A new roof will significantly improve the home's appearance and value. ↑
- Resale Exterior siding repair and repainting — A new siding and paint job will enhance the home's curb appeal and value. ↑
- Resale Flooring replacement — New flooring will improve the home's appearance and value. ↑
- Resale Paint repair and repainting — A fresh coat of paint will improve the home's appearance and value. ↑
- Resale HVAC system replacement — A new HVAC system will improve comfort and energy efficiency, enhancing the home's value. ↑
- Resale Landscaping and curb appeal improvements — A well-maintained landscape will enhance the home's curb appeal and value. ↑
- Rental Interior updates — Fresh paint and minor updates will make the home more appealing to renters and improve its rental value. ↑
- Both Kitchen and bathroom updates — Modernizing the kitchen and bathrooms will improve the home's overall appeal and value for both resale and rental purposes. ↑
ⓘ Cost ranges are severity-bucket heuristics (US national rule-of-thumb). Get contractor quotes + a written scope before underwriting a rehab budget.
Schools (NCES district)
- District
- Medina Valley ISD
- NCES district ID
- 4830060
- Math proficiency
- 48% ▼ -9.00%
- Reading proficiency
- 53% ▼ -2.00%
- Median HH income
- $60,596
- Composite
- 44.2/100
- National rank
- #2851
- State rank
- #148 of 826 in TX
Livability — Castroville
- Score
- 73/100
- State rank
- #212
- US rank
- #5267
Category grades
Schools grade is shown separately in the Schools card above.
Census & demographics
- Population (ZIP)
- 9,494
Population outlook (Medina County) Hauer SSP2
- Today (2025)
- 54,332 people
- By 2030
- 57,250 · +5.4%
- By 2040
- 62,563 · +15.1%
- By 2050
- 67,386 · +24.0%
- By 2075
- 79,538 · +46.4%
- By 2100
- 84,624 · +55.8%
Race, ethnicity, and origin ACS 2023
- Neighborhood character
- Diverse neighborhood (Simpson 0.60)
- Race & ethnicity
- Hispanic / Latino 52% White 37% Two or more races 29% Black 4% Asian 3% Native American 1%
- Hispanic origin (detail)
- Mexican 41% Puerto Rican 3%
- Common ancestry
- Albanian 6% Lithuanian 5% Slovak 2%
- Foreign-born
- 9% · Canada
- Languages at home
- 74% English-only · Spanish 24% Other Indo-European 1%
Political lean MEDSL · Medina
- 2024 margin
- Solid R (+42.8) · D 28.2% · R 71.0%
- 2008→2024 swing
- -8.9pp toward R · 2008: -33.9pp · 2024: -42.8pp
- All cycles
- 2024: R+42.8 2020: R+39.2 2016: R+43.2 2012: R+39.2 2008: R+33.9
Not yet ingested
- Civics
- —
Market trends
- HPI YoY
- ▼ -56.81%
- Current HPI
- 212.1813
- Rent YoY
- —
- Metro
- —
- State GDP YoY
- ▲ 3.95%
- F500 in state
- 110
Industry mix (Fortune 500 HQ in TX)
| Industry | F500 HQs | Revenue |
|---|---|---|
| Energy | 16 | $1,198B |
|
||
| Technology | 5 | $198B |
|
||
| Engineering / Construction | 4 | $72B |
|
||
| Energy Services | 3 | $60B |
|
||
| Utilities | 3 | $41B |
|
||
| Healthcare | 2 | $330B |
|
||
Cash-flow waterfall
monthlySold comps — $/sqft
last 12 mo · ≤1 miLoading sold comps…