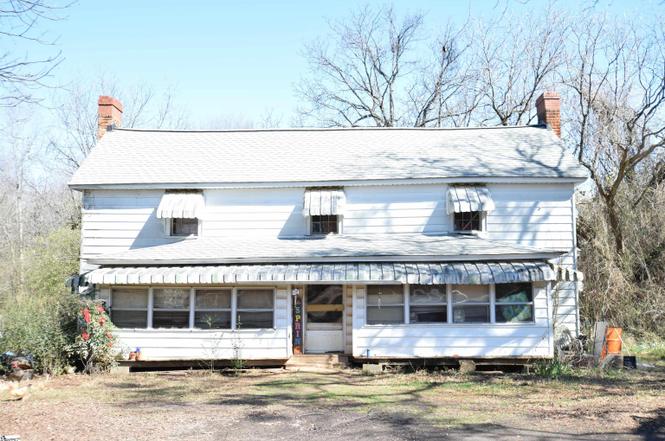
2809 Pelzer Hwy · Easley, SC
Flood risk 1/10 · Minimal
- FEMA flood zone
- X (unshaded)
- Chance of flooding over 30 yrs
- 0.0%
- Est. flood insurance / yr
- $507 – $1,088
Fire risk 3/10 · Minor
- Est. fire insurance / yr
- $783 – $1,453
Heat risk 5/10 · Moderate
- Hot days now (above 104°F)
- 7 days/yr
- Hot days in 30 yrs
- 16 days/yr
Wind risk 2/10 · Minimal
- Chance of severe wind over 30 yrs
- 1.0%
Air-quality risk 4/10 · Minor
- Unhealthy air days now
- 3 days/yr
- Unhealthy air days in 30 yrs
- 4 days/yr
Risk factors via First Street. Map © Google.
Why this score? — see what drove the B grade
The composite is a weighted blend of 9 inputs, each scored 0–100. Each bar is that input's sub-score; the figure is the points it added to the 100-point composite (weight × sub-score).
- Cash flow +30.0/30.0
- DSCR +10.0/10.0
- 1% rule +8.1/10.0
- ARV discount +7.5/15.0
- Schools +5.0/10.0
- Rent growth +3.8/5.0
- Livability +3.6/5.0
- Condition / age +2.5/5.0
- Appreciation +0.0/10.0
$165,000
🖨 Deal sheet (PDF) 📄 Offer letter ✓ Due diligence
Listing remarks MLS
Property Sold AS IS. A prequlification letter and a $1000 earnest money check to accompany all offers. Buyers agent to verify all information.
Key facts
- 20x40 building
- Over two acres
- Several outbuildings
Tags
Property features AI
Finance
- HOA & community: No HOA fees or community amenities
Exterior
- Parking: Driveway parking (unpaved)
- Utilities: Public water; Gas water heater; Septic system; Private garbage pickup
- Home design: Two-story residential property; Originally built circa 1920; Lead-based paint and residential property disclosures required
- Construction: Vinyl siding exterior; Architectural roof; Crawl space foundation
- Exterior features: Enclosed front porch; Front porch; Level lot with some trees; Outbuilding for storage
Interior
- Kitchen: Kitchen (12 x 11)
- Bedrooms: Primary bedroom on main level (15 x 9); Bedroom 2 (15 x 14); Bedroom 3 (15 x 14); Bedroom 4 (15 x 14); Two bedrooms on the main level
- Flooring: Hardwood flooring
- Bathrooms: Two full bathrooms (both on main level)
- Heating & cooling: Wall furnace heating; Gas available for heating; Wall/window air conditioning units
- Interior features: Second living quarters on second level; Walk-in pantry; Wood-burning fireplace; Sun room
- Laundry & utility: Laundry on 1st floor; Washer connection and multiple hookups; Electric dryer hookup
Neighborhood map
What this means for you Summary
Snapshot
- This is a 4-bed/2.0-bath other listed at $165k.
Deal economics
- At list price, monthly cash flow is $733 ($9k/yr) — positive.
- The deal already cash-flows at list — no discount required.
- Meets the 1% rule at list price ($2k rent vs $165k).
- Recommended offer: $150k (9.0% below list) — sets the bar for market timing.
- Cap rate 11.6% vs local median 4.0% in Easley — top-decile yield for the area; either an underpriced asset or a hidden risk that comps aren't pricing in. Stress-test before assuming the spread holds.
Location & tenants
- Location reads 71/100 on livability (#47 in SC) — a middle-class / working-renter tenant base. Strengths: cost of living A+, housing A+; Watch: amenities D, commute F.
- Anderson 01 (rural): math 58% / reading 60% proficiency, ranked #3 of 80 in SC (top 4%) — acceptable for families but not a draw, mixed tenant base, ~2y average lease.
- Zoned schools: Hunt Meadows Elementary (math 61% / reading 54%, grade C+, #99 of 597 statewide, top 17%, 574 students, 47% FRL); Wren Middle (math 54% / reading 59%, grade B, #21 of 229 statewide, top 9%, 973 students, 46% FRL); Wren High (math 82% / reading 91%, grade A, #7 of 196 statewide, top 4%, 1,202 students, 40% FRL).
- Market conditions: Rents rising fast (+5.3%/yr); 321 active listings in the ZIP; solid renter incomes; 1,255 units permitted in Anderson County in 2024 (0 in 5+ unit buildings).
Forward outlook
- Local home prices are declining (-3.0%/yr); year-one equity from $1k of loan paydown is wiped out by about $5k of value loss. Plan a longer hold.
- Anderson County population projected at +14% by 2050 — modest demand growth; plan on rents tracking national, not racing it.
- At projected returns (-3.0% appreciation + 5.3% rent growth), your $46k cash investment doubles in ~6 years — after that, you're playing with house money.
Negotiation context
- It's been on market 109 days — a 9% lower offer ($150k) is reasonable based on typical stale-listing flexibility.
- 3 sale attempts since 20y ago; this cycle's ask has dropped $10k (6%) from the opening price — seller is motivated, your offer sets the floor, not the list.
- Current owner paid $20k; list at $165k implies a 725% gain — meaningful room to come down on a strong offer.
Risks & watch-outs
- Watch-outs: built in 1920 — expect roof / HVAC / electrical / plumbing capex.
- Climate carrying-cost: extreme-heat days projected 7→16/yr by 2055 (HVAC capex compounding) — expect insurance premiums to compound above CPI over the hold.
Questions for the listing agent
- It's been on market 109 days. Have you received any prior offers? Is the seller open to a 9% concession, seller financing, or rate buy-down credit?
- Built in 1920 — when were the roof, HVAC, electrical panel, plumbing, and water heater last replaced?
- Why hasn't it sold? Are there any deal-killer items the seller is aware of (foundation, flood, title, zoning, code violations)?
- Is there a deadline driving the sale (1031 exchange, divorce, estate, relocation)? That informs how much negotiation room exists.
- Schools are D-rated, which usually means shorter tenancies and higher turnover. Who's the typical renter profile here, and what's been the actual vacancy rate?
- What's the average days-on-market for RENTAL listings here right now (not sales)? A rising rental-DOM trend means longer vacancies and softer asking-rent achievability than the comps imply.
- What's the recent tenant-quality profile in this submarket — average credit score on applications, eviction rate, late-payment / NSF rate, and stable-employment percentage? A property-management company in the area should have these aggregated.
- How much new for-sale + rental construction is in the pipeline within 1–3 miles? Heavy new supply typically softens prices + rents 12–24 months out; constrained supply supports both.
Investment metrics
- 1% rule
- 1.31% ✓
- Cap rate
- 11.63%
- Cash-on-cash
- 19.05%
- DSCR
- 1.85
- GRM
- 6.4
CMA / ARV
No comps found within radius.
Projected returns pro-forma
-3.0% appreciation · 5.3% rent growth · sell at horizon
- IRR
- 13.2%
- Equity multiple
- 1.54×
- Total profit
- $25,014
- Equity at exit
- $24,602
- IRR
- 23.7%
- Equity multiple
- 3.24×
- Total profit
- $103,636
- Equity at exit
- $14,266
Cash invested: $46,200 (down + closing). Projections, not guarantees.
Landlord ↔ Tenant lean methodology
- Overall (STATE)
- 90 Strongly Landlord-Friendly
- State South Carolina
- 90 Strongly Landlord-Friendly · R+6
- County
- — inherits STATE
- City
- — inherits STATE
ZIP-level market 29642
- Home prices YoY
- -31.6%
- Rents YoY
- 5.3%
- Active inventory
- 321
- Price-to-rent
- 6.4×
Monthly cashflow live
- Estimated rent
- $2,160 medium interval (Pro) →
- Mortgage (P&I)
- −$865
- Tax from tax record
- −$39 /mo · $470/yr
- Insurance
- −$69
- HOA
- −$0
- Vacancy / Maint / Mgmt
- −$454
- Net cashflow
- $733
Break-even live
Sensitivity live
| Price | -10% $827 | -5% $780 | +0% $733 | +5% $687 | +10% $640 |
|---|---|---|---|---|---|
| Rent | -10% $563 | -5% $648 | +0% $733 | +5% $819 | +10% $904 |
| Rate | -1.0pp $816 | -0.5pp $775 | base $733 | +0.5pp $691 | +1.0pp $647 |
UW: 25.0% down · 7.5% · 30yr · 1.5% tax · 5.0% vac · 8.0% maint · 8.0% mgmt
Financing live
Cash to close
- Down payment
- $41,250
- Closing costs
- $4,950
- Reserves months
- —
- Total cash needed
- —
Loan-product check · same deal, 3 products live
Conventional
25% down · 7.5% · 30yr
- Down + closing
- —
- Monthly P&I
- —
- Monthly cashflow
- —
- DSCR
- —
- Eligible?
- —
Personal DTI + credit; lowest rate.
DSCR
20% down · 8.5% · 30yr
- Down + closing
- —
- Monthly P&I
- —
- Monthly cashflow
- —
- DSCR
- —
- Eligible?
- —
No personal income docs; deal must DSCR.
Hard money
10% down · 12.0% · 12mo
- Down + closing
- —
- Monthly P&I
- —
- Monthly cashflow
- —
- DSCR
- —
- Eligible?
- —
Short-term bridge; refi at stabilization.
Listing history 22 events
-
2026-06-21days on market $165,000 Active 109 DOM
-
2026-06-18days on market $165,000 Active 106 DOM
-
2026-06-17days on market $165,000 Active 105 DOM
-
2026-06-16days on market $165,000 Active 104 DOM
-
2026-06-15days on market $165,000 Active 103 DOM
-
2026-06-13days on market $165,000 Active 101 DOM
-
2026-06-10days on market $165,000 Active 98 DOM
-
2026-06-09days on market $165,000 Active 97 DOM
-
2026-06-08days on market $165,000 Active 96 DOM
-
2026-06-07days on market $165,000 Active 95 DOM
-
2026-06-03days on market $165,000 Active 91 DOM
-
2026-06-03days on market $165,000 Active 90 DOM
-
2026-06-01days on market $165,000 Active 89 DOM
-
2026-05-31days on market $165,000 Active 88 DOM
-
2026-05-22price $165,000
-
2026-05-18status Active
-
2026-05-15historical
-
2026-02-28$175,000 Active
-
2007-11-30soldstatus $20,000 142-char remark
Show marketing remark (142 chars)
Property Sold AS IS. A prequlification letter and a $1000 earnest money check to accompany all offers. Buyers agent to verify all information.
-
2007-10-29historical 142-char remark
Show marketing remark (142 chars)
Property Sold AS IS. A prequlification letter and a $1000 earnest money check to accompany all offers. Buyers agent to verify all information.
-
2006-03-23$22,050 142-char remark
Show marketing remark (142 chars)
Property Sold AS IS. A prequlification letter and a $1000 earnest money check to accompany all offers. Buyers agent to verify all information.
-
1992-07-10soldstatus $31,747
ⓘ Source: listings_history table (triggers on properties + properties_extension) + one-shot
backfill from property_details.listing_events for pre-trigger history.
Tax reassessment forecast SC · Resets to sale price
- Current annual tax
- $470 · $39/mo
- Projected year-2 tax
- $940 · $78/mo
- Expected delta
- +$471/yr (+$39/mo · 100.1%)
ⓘ Screening estimate from a state-policy table — verify with the county assessor before closing.
Climate risk First Street
- Flood 1/10 Low FEMA zone X (unshaded) · 0% chance over 30 yrs
- Wildfire 3/10 Moderate
- Heat 5/10 Major 7 d/yr ≥104°F today · 16 d/yr by 30 yrs out
- Wind 2/10 Low 100% chance of damaging wind over 30 yrs
- Air quality 4/10 Moderate 3 unhealthy d/yr today · 4 by 30 yrs out
Nearby sold comps map
Loading sold comps map…
Walkable amenities ~0.75 mi
Loading nearby amenities…
Taxation est. · year 1
- Rental income
- $25,922
- − Mortgage interest
- −$9,243
- − Property taxes
- −$470
- − Insurance
- −$825
- − Repairs & maintenance
- −$2,074
- − Management
- −$2,074
- − Depreciation
- −$4,800
- Taxable income
- $6,437
- Est. tax owed @ 24.0%
- −$1,545
- After-tax cash flow
- $7,255/yr
For passive investors: Depreciation is non-cash, so a rental often shows a tax loss while cash-flowing — sheltering income. Rental losses are passive: they offset passive income freely, and up to $25,000/yr can offset ordinary (W-2) income if you actively participate and your MAGI is under $100k (phasing out to $0 by $150k); unused losses carry forward. On sale, claimed depreciation is recaptured at up to 25%, and gains may owe capital-gains tax (a 1031 exchange can defer both). Figures are a year-1 estimate at your 24.0% rate — not tax advice; consult a CPA.
Schools (NCES district)
- District
- Anderson 01
- NCES district ID
- 4500780
- Math proficiency
- 58% ▼ -6.00%
- Reading proficiency
- 60% ▼ -1.00%
- Median HH income
- $52,196
- Composite
- 50.46/100
- National rank
- #1861
- State rank
- #3 of 80 in SC
Livability — Easley
- Score
- 71/100
- State rank
- #47
- US rank
- #6783
Category grades
Schools grade is shown separately in the Schools card above.
Census & demographics
- County
- Pickens County · 102,825 people
- City population
- 69,994
- Metro
- Greenville-Anderson, SC
- Population (ZIP)
- 36,852
- Household income
- $78,221
- Rent vs Own
- Severe rent burden
- 915.0
Population outlook (Anderson County) Hauer SSP2
- Today (2025)
- 210,546 people
- By 2030
- 217,791 · +3.4%
- By 2040
- 230,643 · +9.5%
- By 2050
- 240,220 · +14.1%
- By 2075
- 259,518 · +23.3%
- By 2100
- 258,696 · +22.9%
Race, ethnicity, and origin ACS 2023
- Neighborhood character
- Predominantly White (82%)
- Race & ethnicity
- White 82% Black 7% Two or more races 7% Hispanic / Latino 6%
- Hispanic origin (detail)
- Mexican 2%
- Common ancestry
- Slovak 4% Serbian 3% Italian 2%
- Foreign-born
- 4% · Canada, Jamaica
- Languages at home
- 95% English-only · Spanish 3% Other Indo-European 1%
Political lean MEDSL · Anderson
- 2024 margin
- Solid R (+47.4) · D 25.7% · R 73.1% · Other 1.2%
- 2008→2024 swing
- -14.1pp toward R · 2008: -33.3pp · 2024: -47.4pp
- All cycles
- 2024: R+47.4 2020: R+42.0 2016: R+43.7 2012: R+36.4 2008: R+33.3
Not yet ingested
- Civics
- —
Market trends
- HPI YoY
- ▼ -103.03%
- Current HPI
- 222.4976
- Rent YoY
- ▲ 5.30%
- Metro
- Greenville-Anderson, SC
- State GDP YoY
- ▲ 4.51%
- F500 in state
- 2
Industry mix (Fortune 500 HQ in SC)
| Industry | F500 HQs | Revenue |
|---|---|---|
| Packaging | 1 | $7B |
|
||
Price history
+419.7% since first listed8 events — show timeline
- 2026-05-22 Price Changed $165,000 Greater Greenville MLS
- 2026-05-18 Relisted — Greater Greenville MLS
- 2026-05-15 Listing Removed — Greater Greenville MLS
- 2026-02-28 Listed $175,000 Greater Greenville MLS
- 2007-11-30 Sold (MLS) $20,000 Greater Greenville MLS
- 2007-10-29 Listing Removed — Greater Greenville MLS
- 2006-03-23 Listed $22,050 Greater Greenville MLS
- 1992-07-10 Sold (Public Records) $31,747 Public Records
Property tax history
+2.3%/yrLatest (2025): $470 · +17.0% YoY. Source: county tax records.
Cash-flow waterfall
monthlySold comps — $/sqft
last 12 mo · ≤1 miLoading sold comps…