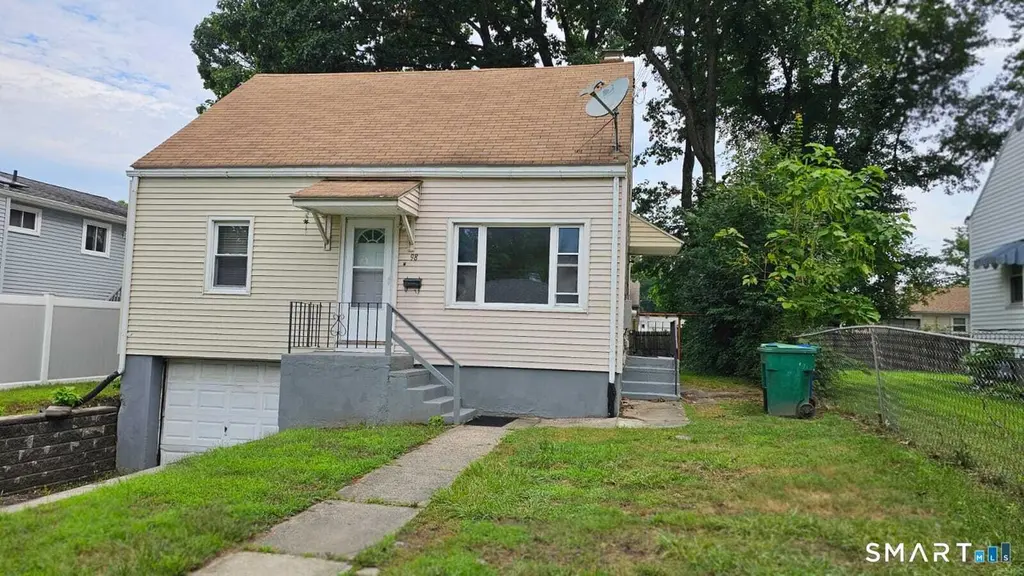
98 E Burnham St · Blue Hills, CT
Flood risk No data
- FEMA flood zone
- —
- Chance of flooding over 30 yrs
- —
- Est. flood insurance / yr
- —
Fire risk No data
- Est. fire insurance / yr
- —
Heat risk No data
- Hot days now (above threshold)
- —
- Hot days in 30 yrs
- —
Wind risk No data
- Chance of severe wind over 30 yrs
- —
Air-quality risk No data
- Unhealthy air days now
- —
- Unhealthy air days in 30 yrs
- —
Risk factors via First Street. Map © Google.
Why this score? — see what drove the C- grade
The composite is a weighted blend of 9 inputs, each scored 0–100. Each bar is that input's sub-score; the figure is the points it added to the 100-point composite (weight × sub-score).
- Cash flow +21.6/30.0
- DSCR +6.9/10.0
- ARV discount +6.5/15.0
- 1% rule +6.0/10.0
- Livability +4.0/5.0
- Rent growth +3.3/5.0
- Condition / age +2.5/5.0
- Schools +2.2/10.0
- Appreciation +0.0/10.0
$279,000
🖨 Deal sheet (PDF) 📄 Offer letter ✓ Due diligence
Listing remarks MLS
Charming 4-bedroom, 2-bath Cape located in Bloomfield. This well-maintained home offers a flexible layout with providing options for a home office. The property features a bright and inviting interior, a functional floor plan, and ample natural light throughout. The kitchen and living spaces offer comfortable everyday living with potential for customization. 1 car attached garage and a level fenced in back yard to enjoy your summer activities. Conveniently situated near local amenities and shopping, this home provides both accessibility and neighborhood appeal.
Key facts
- Fenced in back yard
- Local amenities
- Home office
Tags
Neighborhood map
What this means for you Summary
Snapshot
- This is a 4-bed/2.0-bath single-family listed at $279k.
Deal economics
- At list price, monthly cash flow is $424 ($5k/yr) — positive.
- The deal already cash-flows at list — no discount required.
- Meets the 1% rule at list price ($3k rent vs $279k).
- Recommended offer: $271k (3.0% below list) — sets the bar for market timing.
Location & tenants
- Location reads 81/100 on livability (#14 in CT, #1,343 nationally) — a professional / high-income tenant draw. Strengths: crime A+, commute A+, housing A+; Watch: schools F, amenities F.
- Bloomfield School District (suburban): math 16% / reading 30% proficiency, ranked #137 of 153 in CT (top 90%) — low school quality limits family demand, transient renter base, plan for 1-2y turnover.
- Market conditions: Rents rising (+3.1%/yr); 64 active listings in the ZIP; 1 comparable units currently listed for rent nearby; solid renter incomes; 1,867 units permitted in Capitol Planning Region in 2024 (1,399 in 5+ unit buildings).
- This rent runs 38% of the median local income ($98k/yr) — at the standard rent-burdened threshold; future hikes will face affordability resistance.
Forward outlook
- Local home prices are declining (-3.0%/yr); year-one equity from $2k of loan paydown is wiped out by about $8k of value loss. Plan a longer hold.
Negotiation context
- It's been on market 36 days — a 3% lower offer ($271k) is reasonable based on typical stale-listing flexibility.
- 14 sale attempts since 26y ago; this cycle's ask has dropped $20k (7%) from the opening price — seller is motivated, your offer sets the floor, not the list.
- Current owner paid $83k; list at $279k implies a 236% gain — meaningful room to come down on a strong offer.
Risks & watch-outs
- Watch-outs: built in 1949 — expect roof / HVAC / electrical / plumbing capex.
Questions for the listing agent
- It's been on market 36 days. Have you received any prior offers? Is the seller open to a 3% concession, seller financing, or rate buy-down credit?
- Built in 1949 — when were the roof, HVAC, electrical panel, plumbing, and water heater last replaced?
- Is there a deadline driving the sale (1031 exchange, divorce, estate, relocation)? That informs how much negotiation room exists.
- Schools are F-rated, which usually means shorter tenancies and higher turnover. Who's the typical renter profile here, and what's been the actual vacancy rate?
- What's the average days-on-market for RENTAL listings here right now (not sales)? A rising rental-DOM trend means longer vacancies and softer asking-rent achievability than the comps imply.
- What's the recent tenant-quality profile in this submarket — average credit score on applications, eviction rate, late-payment / NSF rate, and stable-employment percentage? A property-management company in the area should have these aggregated.
- How much new for-sale + rental construction is in the pipeline within 1–3 miles? Heavy new supply typically softens prices + rents 12–24 months out; constrained supply supports both.
Investment metrics
- 1% rule
- 1.10% ✓
- Cap rate
- 8.12%
- Cash-on-cash
- 6.52%
- DSCR
- 1.29
- GRM
- 7.6
CMA / ARV
- ARV (median comp)
- $272,660
- List price
- $279,000
- Delta
- 2.33%
- Verdict
- FAIR
- Comps
- 20 within 1.0 mi
Show comp detail 2 sales within ~0.75 mi
| Address | Dist | Beds/Ba | Sqft | Sold | Price | $/sf | Match |
|---|---|---|---|---|---|---|---|
| 75 Elizabeth Ave | 0.29mi | 3/1.0 (-1) | 1,023 (+9%) | 1mo | $280,000 | $274 | 62 |
| 91 E Harold St | 0.08mi | 4/1.0 | 1,075 (+14%) | 11mo | $260,000 | $242 | 59 |
Match score weights: distance 35% · size 25% · config 20% · recency 20%. Top-matched comps best support the ARV.
Projected returns pro-forma
-3.0% appreciation · 3.11% rent growth · sell at horizon
- IRR
- -6.1%
- Equity multiple
- 0.77×
- Total profit
- $-17,747
- Equity at exit
- $41,600
- IRR
- 3.7%
- Equity multiple
- 1.27×
- Total profit
- $21,130
- Equity at exit
- $24,123
Cash invested: $78,120 (down + closing). Projections, not guarantees.
Landlord ↔ Tenant lean methodology
- Overall (STATE)
- 27 Tenant-Leaning
- State Connecticut
- 27 Tenant-Leaning · D+7
- County
- — inherits STATE
- City
- — inherits STATE
ZIP-level market 06002
- Rents YoY
- 3.1%
- Active inventory
- 64
- Price-to-rent
- 7.6×
Monthly cashflow live
- Estimated rent
- $3,074 medium interval (Pro) →
- Mortgage (P&I)
- −$1,463
- Tax from tax record
- −$425 /mo · $5,095/yr
- Insurance
- −$116
- HOA
- −$0
- Vacancy / Maint / Mgmt
- −$646
- Net cashflow
- $424
Break-even live
Sensitivity live
| Price | -10% $582 | -5% $503 | +0% $424 | +5% $345 | +10% $266 |
|---|---|---|---|---|---|
| Rent | -10% $182 | -5% $303 | +0% $424 | +5% $546 | +10% $667 |
| Rate | -1.0pp $565 | -0.5pp $495 | base $424 | +0.5pp $352 | +1.0pp $279 |
UW: 25.0% down · 7.5% · 30yr · 1.5% tax · 5.0% vac · 8.0% maint · 8.0% mgmt
Financing live
Cash to close
- Down payment
- $69,750
- Closing costs
- $8,370
- Reserves months
- —
- Total cash needed
- —
Loan-product check · same deal, 3 products live
Conventional
25% down · 7.5% · 30yr
- Down + closing
- —
- Monthly P&I
- —
- Monthly cashflow
- —
- DSCR
- —
- Eligible?
- —
Personal DTI + credit; lowest rate.
DSCR
20% down · 8.5% · 30yr
- Down + closing
- —
- Monthly P&I
- —
- Monthly cashflow
- —
- DSCR
- —
- Eligible?
- —
No personal income docs; deal must DSCR.
Hard money
10% down · 12.0% · 12mo
- Down + closing
- —
- Monthly P&I
- —
- Monthly cashflow
- —
- DSCR
- —
- Eligible?
- —
Short-term bridge; refi at stabilization.
Rent comps 1 comps
| Address | Beds | Baths | Sqft | Rent | $/sqft | DOM | Units | Dist |
|---|---|---|---|---|---|---|---|---|
| 31 Forest Ln Bloomfield, CT | 4.0 | 1.5 | 1004 | $3,200 | $3.19 | 4d | 1 | 1.44mi |
Listing history 42 events
-
2026-05-07status Under Contract 569-char remark
Show marketing remark (569 chars)
Charming 4-bedroom, 2-bath Cape located in Bloomfield. This well-maintained home offers a flexible layout with providing options for a home office. The property features a bright and inviting interior, a functional floor plan, and ample natural light throughout. The kitchen and living spaces offer comfortable everyday living with potential for customization. 1 car attached garage and a level fenced in back yard to enjoy your summer activities. Conveniently situated near local amenities and shopping, this home provides both accessibility and neighborhood appeal.
-
2026-04-30price $279,000 569-char remark
Show marketing remark (569 chars)
Charming 4-bedroom, 2-bath Cape located in Bloomfield. This well-maintained home offers a flexible layout with providing options for a home office. The property features a bright and inviting interior, a functional floor plan, and ample natural light throughout. The kitchen and living spaces offer comfortable everyday living with potential for customization. 1 car attached garage and a level fenced in back yard to enjoy your summer activities. Conveniently situated near local amenities and shopping, this home provides both accessibility and neighborhood appeal.
-
2026-04-01$299,000 Active 569-char remark
Show marketing remark (569 chars)
Charming 4-bedroom, 2-bath Cape located in Bloomfield. This well-maintained home offers a flexible layout with providing options for a home office. The property features a bright and inviting interior, a functional floor plan, and ample natural light throughout. The kitchen and living spaces offer comfortable everyday living with potential for customization. 1 car attached garage and a level fenced in back yard to enjoy your summer activities. Conveniently situated near local amenities and shopping, this home provides both accessibility and neighborhood appeal.
-
2024-08-23historical $2,000
-
2024-08-16$2,000
-
2024-08-09historical
-
2024-07-18$299,900 Active
-
2019-09-18soldstatus $83,000
-
2019-09-06soldstatus $83,000 Closed
-
2019-06-07historical
-
2019-05-31price $83,000
-
2019-05-31status Active
-
2019-05-26historical
-
2019-03-27historical Under Contract - Continue to Show
-
2019-03-18price $88,000
-
2019-03-14price $95,000
-
2019-03-10price $102,000
-
2019-02-22price $106,000
-
2019-02-16price $110,000
-
2019-02-12$120,000 Active
-
2018-10-06historical
-
2018-10-05status Active
-
2018-10-05historical
-
2018-08-17price $122,000
-
2018-08-05price $127,000
-
2018-07-27price $129,000
-
2018-07-02$130,000 Active
-
2017-11-29historical
-
2017-07-12$103,000
-
2016-06-26historical
-
2016-06-05$89,900
-
2013-11-16historical
-
2013-05-21$119,900
-
2009-04-30historical
-
2009-01-12$139,900
-
2009-01-04historical
-
2008-09-05$149,000
-
2007-06-30historical
-
2006-12-27$144,800
-
2001-05-25soldstatus $91,900
-
2001-05-25soldstatus $91,900
-
2000-12-09$89,900
ⓘ Source: listings_history table (triggers on properties + properties_extension) + one-shot
backfill from property_details.listing_events for pre-trigger history.
Tax reassessment forecast CT · Partial reset (capped growth)
- Current annual tax
- $5,095 · $425/mo
- Projected year-2 tax
- $5,533 · $461/mo
- Expected delta
- +$438/yr (+$36/mo · 8.6%)
ⓘ Screening estimate from a state-policy table — verify with the county assessor before closing.
Nearby sold comps map
Loading sold comps map…
Walkable amenities ~0.75 mi
Loading nearby amenities…
Taxation est. · year 1
- Rental income
- $36,886
- − Mortgage interest
- −$15,628
- − Property taxes
- −$5,095
- − Insurance
- −$1,395
- − Repairs & maintenance
- −$2,951
- − Management
- −$2,951
- − Depreciation
- −$8,116
- Taxable income
- $750
- Est. tax owed @ 24.0%
- −$180
- After-tax cash flow
- $4,913/yr
For passive investors: Depreciation is non-cash, so a rental often shows a tax loss while cash-flowing — sheltering income. Rental losses are passive: they offset passive income freely, and up to $25,000/yr can offset ordinary (W-2) income if you actively participate and your MAGI is under $100k (phasing out to $0 by $150k); unused losses carry forward. On sale, claimed depreciation is recaptured at up to 25%, and gains may owe capital-gains tax (a 1031 exchange can defer both). Figures are a year-1 estimate at your 24.0% rate — not tax advice; consult a CPA.
Schools (NCES district)
- District
- Bloomfield School District
- NCES district ID
- 0900330
- Math proficiency
- 16% ▼ -13.00%
- Reading proficiency
- 30% ▼ -12.00%
- Median HH income
- $71,180
- Composite
- 22.37/100
- National rank
- #8120
- State rank
- #137 of 153 in CT
Livability — Blue Hills
- Score
- 81/100
- State rank
- #14
- US rank
- #1343
Category grades
Schools grade is shown separately in the Schools card above.
Census & demographics
- Census place
- Blue Hills, CT
- County
- Hartford County · 754,208 people
- Metro
- Hartford-East Hartford-Middletown, CT
- Population (ZIP)
- 21,865
- Household income
- $98,162
- Rent vs Own
- Severe rent burden
- 692.0
Population outlook (Capitol County) Hauer SSP2
- By 2040
- 1,063,519
Race, ethnicity, and origin ACS 2023
- Neighborhood character
- Diverse neighborhood (Simpson 0.61)
- Race & ethnicity
- Black 54% White 30% Hispanic / Latino 8% Two or more races 6% Asian 4%
- Hispanic origin (detail)
- Puerto Rican 4%
- Common ancestry
- Romanian 2% Lithuanian 2% Scotch-Irish 2%
- Foreign-born
- 25% · Canada, Vietnam, China
- Languages at home
- 82% English-only · Spanish 6% Other Indo-European 2% French/Haitian/Cajun 2%
Political lean MEDSL · Capitol
- 2024 margin
- Strong D (+21.9) · D 60.1% · R 38.2% · Other 1.7%
- All cycles
- 2024: D+21.9
Not yet ingested
- Civics
- —
Market trends
- HPI YoY
- ▼ -175.76%
- Current HPI
- 198.4604
- Rent YoY
- ▲ 3.11%
- Metro
- Hartford-East Hartford-Middletown, CT
- State GDP YoY
- ▲ 1.06%
- F500 in state
- 38
Industry mix (Fortune 500 HQ in CT)
| Industry | F500 HQs | Revenue |
|---|---|---|
| Industrial Machinery | 4 | $38B |
|
||
| Insurance | 3 | $71B |
|
||
| Financial Services | 2 | $25B |
|
||
| Transportation / Logistics | 2 | $18B |
|
||
| Healthcare | 1 | $247B |
|
||
| Telecommunications | 1 | $55B |
|
||
Price history
+210.3% since first listed42 events — show timeline
- 2026-05-07 Pending — Smart MLS
- 2026-04-30 Price Changed $279,000 Smart MLS
- 2026-04-01 Listed $299,000 Smart MLS
- 2024-08-23 Rental Removed $2,000 APPFOLIO
- 2024-08-16 Listed for Rent $2,000 APPFOLIO
- 2024-08-09 Listing Removed — Smart MLS
- 2024-07-18 Listed $299,900 Smart MLS
- 2019-09-18 Sold (Public Records) $83,000 Public Records
- 2019-09-06 Sold (MLS) $83,000 Smart MLS
- 2019-06-07 Listing Removed — Smart MLS
- 2019-05-31 Price Changed $83,000 Smart MLS
- 2019-05-31 Relisted — Smart MLS
- 2019-05-26 Listing Removed — Smart MLS
- 2019-03-27 Contingent — Smart MLS
- 2019-03-18 Price Changed $88,000 Smart MLS
- 2019-03-14 Price Changed $95,000 Smart MLS
- 2019-03-10 Price Changed $102,000 Smart MLS
- 2019-02-22 Price Changed $106,000 Smart MLS
- 2019-02-16 Price Changed $110,000 Smart MLS
- 2019-02-12 Listed $120,000 Smart MLS
- 2018-10-06 Listing Removed — Smart MLS
- 2018-10-05 Relisted — Smart MLS
- 2018-10-05 Listing Removed — Smart MLS
- 2018-08-17 Price Changed $122,000 Smart MLS
- 2018-08-05 Price Changed $127,000 Smart MLS
- 2018-07-27 Price Changed $129,000 Smart MLS
- 2018-07-02 Listed $130,000 Smart MLS
- 2017-11-29 Listing Removed — Smart MLS
- 2017-07-12 Listed $103,000 Smart MLS
- 2016-06-26 Listing Removed — Smart MLS
- 2016-06-05 Listed $89,900 Smart MLS
- 2013-11-16 Listing Removed — Smart MLS
- 2013-05-21 Listed $119,900 Smart MLS
- 2009-04-30 Listing Removed — Smart MLS
- 2009-01-12 Listed $139,900 Smart MLS
- 2009-01-04 Listing Removed — Smart MLS
- 2008-09-05 Listed $149,000 Smart MLS
- 2007-06-30 Listing Removed — Smart MLS
- 2006-12-27 Listed $144,800 Smart MLS
- 2001-05-25 Sold (Public Records) $91,900 Public Records
- 2001-05-25 Sold (MLS) $91,900 Smart MLS
- 2000-12-09 Listed $89,900 Smart MLS
Property tax history
+3.5%/yrLatest (2025): $5,095 · +45.8% YoY. Source: county tax records.
Cash-flow waterfall
monthlySold comps — $/sqft
last 12 mo · ≤1 miLoading sold comps…