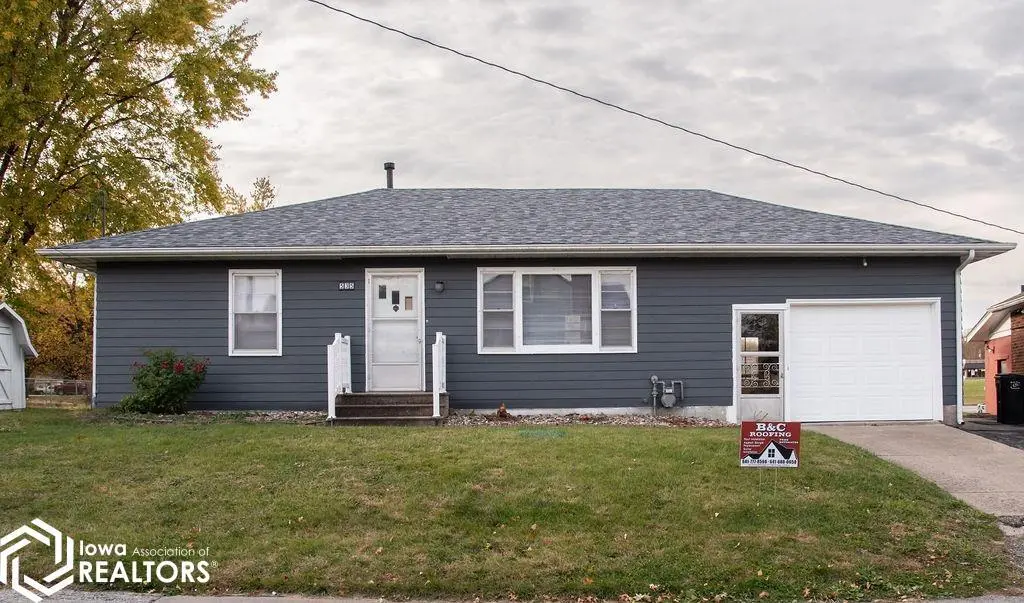
535 Osceola St · Ottumwa, IA
Flood risk 1/10 · Minimal
- FEMA flood zone
- X (unshaded)
- Chance of flooding over 30 yrs
- 0.0%
- Est. flood insurance / yr
- $473 – $860
Fire risk 4/10 · Minor
- Est. fire insurance / yr
- $902 – $1,676
Heat risk 3/10 · Minor
- Hot days now (above 105°F)
- 7 days/yr
- Hot days in 30 yrs
- 15 days/yr
Wind risk 2/10 · Minimal
- Chance of severe wind over 30 yrs
- —
Air-quality risk 2/10 · Minimal
- Unhealthy air days now
- 1 days/yr
- Unhealthy air days in 30 yrs
- 1 days/yr
Risk factors via First Street. Map © Google.
Why this score? — see what drove the D grade
The composite is a weighted blend of 9 inputs, each scored 0–100. Each bar is that input's sub-score; the figure is the points it added to the 100-point composite (weight × sub-score).
- Cash flow +17.9/30.0
- DSCR +5.6/10.0
- 1% rule +4.6/10.0
- Schools +4.3/10.0
- Livability +4.0/5.0
- Rent growth +2.5/5.0
- Condition / age +2.5/5.0
- ARV discount +0.0/15.0
- Appreciation +0.0/10.0
$132,000
🖨 Deal sheet (PDF) 📄 Offer letter ✓ Due diligence
Listing remarks
Welcome to this charming and thoughtfully updated 3-bedroom home perfectly situated in one of Ottumwa’s most convenient neighborhoods. From the moment you arrive, you’ll notice the pride of ownership throughout, from the fresh curb appeal to the brand-new roof installed in 2025. Step inside and discover a comfortable, move-in-ready layout featuring modern updates throughout while maintaining a warm, inviting feel. The spacious living area flows easily into the dining and kitchen spaces, creating the perfect spot for family gatherings or cozy nights in. The full basement offers ample storage and laundry space, plus the potential to finish for even more living area. Outside, enjoy
Key facts
- Manageable yard
- Attached garage
- Full basement
Tags
Property features AI
Finance
- Financial info: Annual tax amount reported
Exterior
- Parking: Attached garage with 1 garage space
- Utilities: Public water; Public sewer
- Home design: Single-family residence; Residential property
- Construction: Wood siding
- Exterior features: Lot approximately 0.16 acres (77 x 50)
Interior
- Bathrooms: 1 full bathroom
- Heating & cooling: Central air; Forced air heating
- Interior features: Basement
Neighborhood map
What this means for you Summary
Snapshot
- This is a 2-bed/1.0-bath single-family listed at $132k.
Deal economics
- At list price, monthly cash flow is $110 ($1k/yr) — positive.
- The deal already cash-flows at list — no discount required.
- To meet the 1% rule (rent ≥ 1% of price), the offer needs to be $127k (3.6% below list).
- Recommended offer: $127k (3.6% below list) — sets the bar for 1% rule.
- Cap rate 7.3% vs local median 5.6% in Ottumwa — meaningfully above typical; check what's discounted (condition, days-on-market, listing class) to confirm the premium yield is real.
Location & tenants
- Location reads 80/100 on livability (#91 in IA, #1,900 nationally) — a professional / high-income tenant draw. Strengths: cost of living A+, housing A+, health & safety A+; Watch: crime D-, employment D-.
- Ottumwa Community School District (town): math 50% / reading 54% proficiency, ranked #277 of 289 in IA (top 96%) — acceptable for families but not a draw, mixed tenant base, ~2y average lease.
- Zoned schools: Evans Middle School (math 45% / reading 53%, grade C-, #219 of 246 statewide, top 90%, 1,047 students, 46% FRL) — zoned schools at 46% FRL track the district average.
- Market conditions: 192 active listings in the ZIP; 44 units permitted in Wapello County in 2024 (0 in 5+ unit buildings).
Forward outlook
- Local home prices are declining (-3.0%/yr); year-one equity from $913 of loan paydown is wiped out by about $4k of value loss. Plan a longer hold.
- Wapello County population projected at +5% by 2050 — modest demand growth; plan on rents tracking national, not racing it.
Negotiation context
- It's been on market 43 days — a 3% lower offer ($128k) is reasonable based on typical stale-listing flexibility.
- 3 sale attempts since 2y ago with the ask held roughly flat each time — persistent listings suggest the price (not the market) is what's stuck; bring a comps-based counter.
- Current owner paid $70k; list at $132k implies a 89% gain — meaningful room to come down on a strong offer.
Questions for the listing agent
- It's been on market 43 days. Have you received any prior offers? Is the seller open to a 4% concession, seller financing, or rate buy-down credit?
- Built in 1967 — when were the roof, HVAC, electrical panel, plumbing, and water heater last replaced?
- Is there a deadline driving the sale (1031 exchange, divorce, estate, relocation)? That informs how much negotiation room exists.
- Crime grade is D in this area — have there been break-ins, vandalism, or insurance claims at this property in the last 3 years? What carrier currently insures it and at what premium?
- The area grade is low — what's the realistic commute time and amenity access for the typical tenant pool here? Any planned neighborhood developments (good or bad) we should know about?
- What's the average days-on-market for RENTAL listings here right now (not sales)? A rising rental-DOM trend means longer vacancies and softer asking-rent achievability than the comps imply.
- What's the recent tenant-quality profile in this submarket — average credit score on applications, eviction rate, late-payment / NSF rate, and stable-employment percentage? A property-management company in the area should have these aggregated.
- How much new for-sale + rental construction is in the pipeline within 1–3 miles? Heavy new supply typically softens prices + rents 12–24 months out; constrained supply supports both.
Investment metrics
- 1% rule
- 0.96% ✗
- Cap rate
- 7.30%
- Cash-on-cash
- 3.58%
- DSCR
- 1.16
- GRM
- 8.6
CMA / ARV
- ARV (median comp)
- $98,947
- List price
- $132,000
- Delta
- 33.41%
- Verdict
- OVERPRICED
- Comps
- 20 within 1.0 mi
Show comp detail 12 sales within ~0.75 mi
| Address | Dist | Beds/Ba | Sqft | Sold | Price | $/sf | Match |
|---|---|---|---|---|---|---|---|
| 703 Mckinley Ave | 0.35mi | 3/2.0 (+1) | 1,404 (-2%) | 4mo | $217,000 | $155 | 68 |
| 311 Minneopa Ave | 0.55mi | 2/1.5 | 1,460 (+2%) | 6mo | $185,000 | $127 | 64 |
| 120 Shaul Ave | 0.65mi | 3/2.0 (+1) | 1,448 (+1%) | 4mo | $215,000 | $148 | 56 |
| 428 Osceola St | 0.19mi | 3/1.0 (+1) | 1,252 (-13%) | 13mo | $55,000 | $44 | 55 |
| 519 Wildwood Dr | 0.57mi | 2/2.0 | 1,560 (+9%) | 1mo | $136,500 | $88 | 54 |
| 1401 W Finley Ave | 0.51mi | 3/1.0 (+1) | 1,571 (+10%) | 2mo | $72,000 | $46 | 54 |
| 945 W Williams St | 0.72mi | 2/1.0 | 1,475 (+3%) | 10mo | $140,000 | $95 | 53 |
| 1529 Swanson Ave | 0.57mi | 2/1.0 | 1,270 (-11%) | 3mo | $117,000 | $92 | 52 |
| 1110 Chester Ave | 0.38mi | 3/2.0 (+1) | 1,576 (+10%) | 10mo | $233,000 | $148 | 48 |
| 1410 W Finley Ave | 0.55mi | 2/1.0 | 1,230 (-14%) | 6mo | $175,000 | $142 | 45 |
| 920 W Finley Ave | 0.51mi | 3/1.5 (+1) | 1,252 (-13%) | 5mo | $163,400 | $131 | 44 |
| 310 Lake Dr | 0.71mi | 3/2.5 (+1) | 1,548 (+8%) | 13mo | $172,000 | $111 | 32 |
Match score weights: distance 35% · size 25% · config 20% · recency 20%. Top-matched comps best support the ARV.
Projected returns pro-forma
-3.0% appreciation · 3.0% rent growth · sell at horizon
- IRR
- -10.7%
- Equity multiple
- 0.61×
- Total profit
- $-14,360
- Equity at exit
- $19,682
- IRR
- -1.4%
- Equity multiple
- 0.91×
- Total profit
- $-3,428
- Equity at exit
- $11,413
Cash invested: $36,960 (down + closing). Projections, not guarantees.
Landlord ↔ Tenant lean methodology
- Overall (STATE)
- 83 Strongly Landlord-Friendly
- State Iowa
- 83 Strongly Landlord-Friendly · R+6
- County
- — inherits STATE
- City
- — inherits STATE
ZIP-level market 52501
- Active inventory
- 192
- Price-to-rent
- 8.6×
Monthly cashflow live
- Estimated rent
- $1,273 medium interval (Pro) →
- Mortgage (P&I)
- −$692
- Tax from tax record
- −$148 /mo · $1,778/yr
- Insurance
- −$55
- HOA
- −$0
- Vacancy / Maint / Mgmt
- −$267
- Net cashflow
- $110
Break-even live
Sensitivity live
| Price | -10% $185 | -5% $148 | +0% $110 | +5% $73 | +10% $36 |
|---|---|---|---|---|---|
| Rent | -10% $10 | -5% $60 | +0% $110 | +5% $161 | +10% $211 |
| Rate | -1.0pp $177 | -0.5pp $144 | base $110 | +0.5pp $76 | +1.0pp $41 |
UW: 25.0% down · 7.5% · 30yr · 1.5% tax · 5.0% vac · 8.0% maint · 8.0% mgmt
Financing live
Cash to close
- Down payment
- $33,000
- Closing costs
- $3,960
- Reserves months
- —
- Total cash needed
- —
Loan-product check · same deal, 3 products live
Conventional
25% down · 7.5% · 30yr
- Down + closing
- —
- Monthly P&I
- —
- Monthly cashflow
- —
- DSCR
- —
- Eligible?
- —
Personal DTI + credit; lowest rate.
DSCR
20% down · 8.5% · 30yr
- Down + closing
- —
- Monthly P&I
- —
- Monthly cashflow
- —
- DSCR
- —
- Eligible?
- —
No personal income docs; deal must DSCR.
Hard money
10% down · 12.0% · 12mo
- Down + closing
- —
- Monthly P&I
- —
- Monthly cashflow
- —
- DSCR
- —
- Eligible?
- —
Short-term bridge; refi at stabilization.
Listing history 26 events
-
2026-06-21days on market $132,000 Active 43 DOM
-
2026-06-21days on market $132,000 Active 42 DOM
-
2026-06-18days on market $132,000 Active 40 DOM
-
2026-06-17days on market $132,000 Active 39 DOM
-
2026-06-16days on market $132,000 Active 38 DOM
-
2026-06-15days on market $132,000 Active 37 DOM
-
2026-06-13days on market $132,000 Active 35 DOM
-
2026-06-12pricedays on market $132,000 Active 34 DOM
-
2026-06-09days on market $138,000 Active 31 DOM
-
2026-06-08days on market $138,000 Active 30 DOM
-
2026-06-07days on market $138,000 Active 29 DOM
-
2026-06-07days on market $138,000 Active 28 DOM
-
2026-06-04days on market $138,000 Active 25 DOM
-
2026-06-02days on market $138,000 Active 24 DOM
-
2026-06-01days on market $138,000 Active 23 DOM
-
2026-05-31days on market $138,000 Active 22 DOM
-
2026-05-31days on market $138,000 Active 21 DOM
-
2026-05-09$138,000 Active 1145-char remark
-
2026-03-16price $138,000
-
2026-02-14price $143,500
-
2025-11-18price $148,500
-
2025-11-15price $154,900
-
2025-11-08$159,900 Active
-
2025-08-18soldstatus $70,000
-
2024-08-02price $145,000
-
2024-06-22$150,000 Active
ⓘ Source: listings_history table (triggers on properties + properties_extension) + one-shot
backfill from property_details.listing_events for pre-trigger history.
Tax reassessment forecast IA · Partial reset (capped growth)
- Current annual tax
- $1,778 · $148/mo
- Projected year-2 tax
- $1,925 · $160/mo
- Expected delta
- +$147/yr (+$12/mo · 8.3%)
ⓘ Screening estimate from a state-policy table — verify with the county assessor before closing.
Climate risk First Street
- Flood 1/10 Low FEMA zone X (unshaded) · 0% chance over 30 yrs
- Wildfire 4/10 Moderate
- Heat 3/10 Moderate 7 d/yr ≥105°F today · 15 d/yr by 30 yrs out
- Wind 2/10 Low
- Air quality 2/10 Low 1 unhealthy d/yr today · 1 by 30 yrs out
Nearby sold comps map
Loading sold comps map…
Walkable amenities ~0.75 mi
Loading nearby amenities…
Taxation est. · year 1
- Rental income
- $15,275
- − Mortgage interest
- −$7,394
- − Property taxes
- −$1,778
- − Insurance
- −$660
- − Repairs & maintenance
- −$1,222
- − Management
- −$1,222
- − Depreciation
- −$3,840
- Taxable loss
- −$841
- Est. tax savings @ 24.0%
- +$202
- After-tax cash flow
- $1,525/yr
For passive investors: Depreciation is non-cash, so a rental often shows a tax loss while cash-flowing — sheltering income. Rental losses are passive: they offset passive income freely, and up to $25,000/yr can offset ordinary (W-2) income if you actively participate and your MAGI is under $100k (phasing out to $0 by $150k); unused losses carry forward. On sale, claimed depreciation is recaptured at up to 25%, and gains may owe capital-gains tax (a 1031 exchange can defer both). Figures are a year-1 estimate at your 24.0% rate — not tax advice; consult a CPA.
Schools (NCES district)
- District
- Ottumwa Community School District
- NCES district ID
- 1922110
- Math proficiency
- 50% ▼ -9.00%
- Reading proficiency
- 54% ▲ 1.00%
- Median HH income
- $39,864
- Composite
- 43.46/100
- National rank
- #3004
- State rank
- #277 of 289 in IA
Livability — Ottumwa
- Score
- 80/100
- State rank
- #91
- US rank
- #1900
Category grades
Schools grade is shown separately in the Schools card above.
Census & demographics
- Census place
- Ottumwa, IA
- Population (ZIP)
- 30,341
Population outlook (Wapello County) Hauer SSP2
- Today (2025)
- 35,472 people
- By 2030
- 35,563 · +0.3%
- By 2040
- 36,083 · +1.7%
- By 2050
- 37,287 · +5.1%
- By 2075
- 43,898 · +23.8%
- By 2100
- 52,973 · +49.3%
Race, ethnicity, and origin ACS 2023
- Neighborhood character
- Predominantly White (74%)
- Race & ethnicity
- White 74% Hispanic / Latino 14% Two or more races 7% Black 4% Pacific Islander 2% Asian 2%
- Hispanic origin (detail)
- Mexican 9%
- Common ancestry
- Iranian 4% Italian 1% Slovak 1%
- Foreign-born
- 11% · Canada
- Languages at home
- 84% English-only · Spanish 10% Other Asian/Pacific 3% Tagalog/Filipino 1%
Political lean MEDSL · Wapello
- 2024 margin
- Solid R (+31.4) · D 33.6% · R 65.0% · Other 1.4%
- 2008→2024 swing
- -45.0pp toward R · 2008: 13.5pp · 2024: -31.4pp
- All cycles
- 2024: R+31.4 2020: R+23.6 2016: R+20.8 2012: D+11.8 2008: D+13.5
Not yet ingested
- Civics
- —
Market trends
- HPI YoY
- ▼ -94.66%
- Current HPI
- 174.6021
- Rent YoY
- —
- Metro
- —
- State GDP YoY
- ▲ 2.48%
- F500 in state
- 4
Industry mix (Fortune 500 HQ in IA)
| Industry | F500 HQs | Revenue |
|---|---|---|
| Financial Services | 1 | $16B |
|
||
| Retail / Convenience | 1 | $15B |
|
||
Price history
-12.0% since first listed10 events — show timeline
- 2026-06-10 Price Changed $132,000 IAR
- 2026-05-09 Listed $138,000 IAR
- 2026-03-16 Price Changed $138,000 IAR
- 2026-02-14 Price Changed $143,500 IAR
- 2025-11-18 Price Changed $148,500 IAR
- 2025-11-15 Price Changed $154,900 IAR
- 2025-11-08 Listed $159,900 IAR
- 2025-08-18 Sold (Public Records) $70,000 Public Records
- 2024-08-02 Price Changed $145,000 IAR
- 2024-06-22 Listed $150,000 IAR
Property tax history
+0.2%/yrLatest (2025): $1,778 · +5.8% YoY. Source: county tax records.
Cash-flow waterfall
monthlySold comps — $/sqft
last 12 mo · ≤1 miLoading sold comps…