1841 N Miller St · Rockaway Beach, OR
Flood risk 1/10 · Minimal
- FEMA flood zone
- X (unshaded)
- Chance of flooding over 30 yrs
- 0.0%
- Est. flood insurance / yr
- $507 – $1,088
Fire risk 1/10 · Minimal
- Est. fire insurance / yr
- $498 – $926
Heat risk 1/10 · Minimal
- Hot days now (above 76°F)
- 9 days/yr
- Hot days in 30 yrs
- 18 days/yr
Wind risk 1/10 · Minimal
- Chance of severe wind over 30 yrs
- —
Air-quality risk 6/10 · Moderate
- Unhealthy air days now
- 8 days/yr
- Unhealthy air days in 30 yrs
- 9 days/yr
Risk factors via First Street. Map © Google.
Why this score? — see what drove the B- grade
The composite is a weighted blend of 9 inputs, each scored 0–100. Each bar is that input's sub-score; the figure is the points it added to the 100-point composite (weight × sub-score).
- Cash flow +29.1/30.0
- ARV discount +10.1/15.0
- DSCR +10.0/10.0
- 1% rule +7.0/10.0
- Schools +4.2/10.0
- Livability +3.7/5.0
- Rent growth +2.5/5.0
- Condition / age +2.5/5.0
- Appreciation +0.0/10.0
$499,900
🖨 Deal sheet (PDF) 📄 Offer letter ✓ Due diligence
Listing remarks
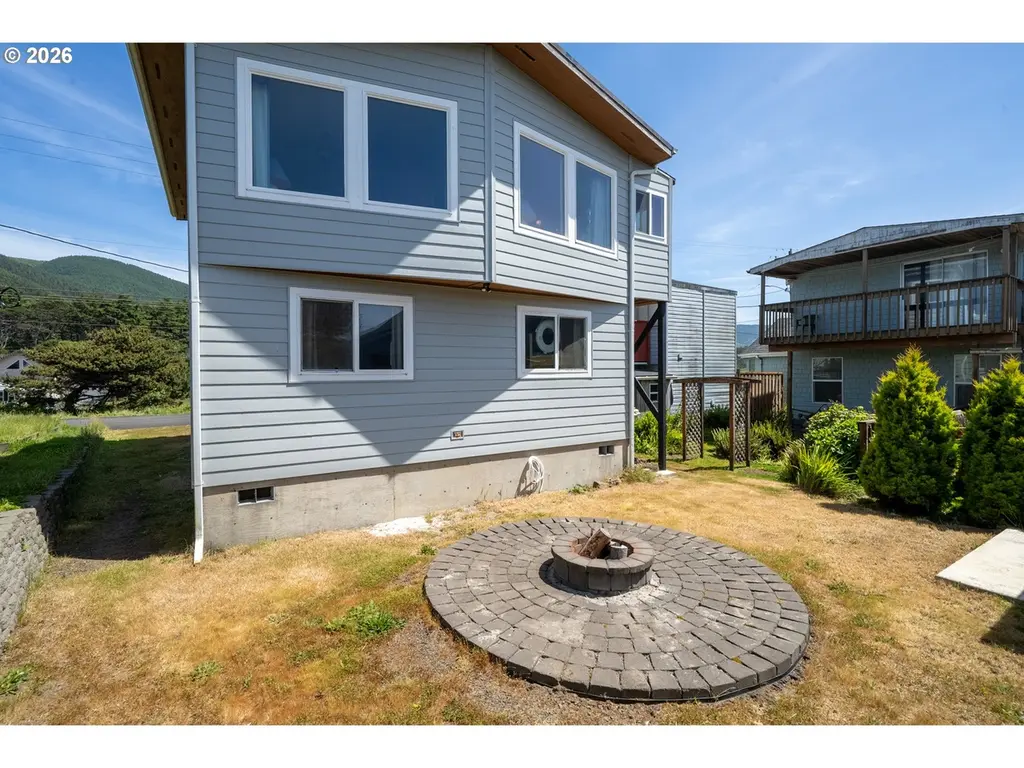
Ocean View Retreat in Rockaway Beach! Wake up to the Breathtaking ocean views from this charming 3-bedroom, 2 bath home in Rockaway OR! The upper level features a spacious living room and open-concept kitchen with center island, creating an inviting gathering space. The large picture windows fill the room with natural light, creating the perfect backdrop for relaxing or entertaining. On the Main floor, you have 3 comfortable bedrooms, a full bath, and laundry. Whether you are looking for a full-time residence or weekend getaway, this coastal retreat offers all the beach town charm. Just moments from the sand, you will enjoy everything that makes Oregon coast living so special!
Key facts
- Coastal retreat
- Open-concept kitchen
- 3,049 sq ft lot
Tags
Property features AI
Finance
- Other: Property has ocean view; Lot in the 3,000 to 4,999 sqft range
- HOA & community: Not a senior community; Zoning: R1
Exterior
- Parking: Driveway
- Utilities: Public water; Public sewer; Electric service
- Home design: Single-family residence (residential property); Unattached; Resale; Upper and main level living areas
- Construction: Built in 1997; Composition roof; Pillar/post/pier foundation
- Exterior features: Fire pit; Tool shed; Vinyl siding; Ocean view; Located within a quarter mile of the beach
Interior
- Kitchen: Island; Microwave; Dishwasher; Free-standing range; Free-standing refrigerator
- Bedrooms: Primary bedroom on main level; Second bedroom on main level; Third bedroom on main level
- Bathrooms: Two full bathrooms (one on main level, one on upper level)
- Heating & cooling: Forced air heating; No central cooling reported
- Interior features: Ceiling fans; Vinyl window frames; Crawl space basement; Washer and dryer present
- Laundry & utility: Main-level laundry; Electric hot water
Neighborhood map
What this means for you Summary
Snapshot
- This is a 3-bed/2.0-bath single-family listed at $500k.
Deal economics
- At list price, monthly cash flow is $2k ($21k/yr) — positive.
- The deal already cash-flows at list — no discount required.
- Meets the 1% rule at list price ($6k rent vs $500k).
- Recommended offer: $492k (1.5% below list) — sets the bar for market timing.
- Cap rate 10.5% vs local median 6.6% in Rockaway Beach — top-decile yield for the area; either an underpriced asset or a hidden risk that comps aren't pricing in. Stress-test before assuming the spread holds.
Location & tenants
- Location reads 74/100 on livability (#94 in OR, #4,777 nationally) — a middle-class / working-renter tenant base. Strengths: crime A+, housing A+, cost of living A-; Watch: health & safety C-, employment D, amenities F.
- Neah-Kah-Nie SD 56 (rural): math 39% / reading 55% proficiency, ranked #62 of 183 in OR (top 34%) — families likely to look elsewhere, expect single-tenant / working-renter base with shorter leases.
- Zoned schools: Garibaldi Elementary School (math 24% / reading 30%, grade F, #288 of 412 statewide, top 73%, 120 students, 52% FRL); Neah-Kah-Nie Middle School (math 24% / reading 57%, grade F, #41 of 128 statewide, top 32%, 177 students, 44% FRL); Neah-Kah-Nie High School (math 24% / reading 75%, grade D+, #32 of 143 statewide, top 34%, 280 students, 35% FRL).
- Market conditions: 130 active listings in the ZIP; 1 comparable units currently listed for rent nearby; 86 units permitted in Tillamook County in 2024 (0 in 5+ unit buildings).
Forward outlook
- Local home prices are declining (-3.0%/yr); year-one equity from $3k of loan paydown is wiped out by about $15k of value loss. Plan a longer hold.
- Tillamook County population projected at +3% by 2050 — modest demand growth; plan on rents tracking national, not racing it.
- At projected returns (-3.0% appreciation + 3.0% rent growth), your $140k cash investment doubles in ~8 years — after that, you're playing with house money.
Negotiation context
- It's been on market 16 days — a 2% lower offer ($492k) is reasonable based on typical stale-listing flexibility.
- Current owner paid $70k; list at $500k implies a 614% gain — meaningful room to come down on a strong offer.
Questions for the listing agent
- Is there a deadline driving the sale (1031 exchange, divorce, estate, relocation)? That informs how much negotiation room exists.
- What's the average days-on-market for RENTAL listings here right now (not sales)? A rising rental-DOM trend means longer vacancies and softer asking-rent achievability than the comps imply.
- What's the recent tenant-quality profile in this submarket — average credit score on applications, eviction rate, late-payment / NSF rate, and stable-employment percentage? A property-management company in the area should have these aggregated.
- How much new for-sale + rental construction is in the pipeline within 1–3 miles? Heavy new supply typically softens prices + rents 12–24 months out; constrained supply supports both.
Investment metrics
- 1% rule
- 1.20% ✓
- Cap rate
- 10.45%
- Cash-on-cash
- 14.86%
- DSCR
- 1.66
- GRM
- 6.9
CMA / ARV
- ARV (on-the-fly)
- $530,784
- Comps found
- 6
Show comp detail 6 sales within ~0.75 mi
| Address | Dist | Beds/Ba | Sqft | Sold | Price | $/sf | Match |
|---|---|---|---|---|---|---|---|
| 1702 N Highway 101 | 0.07mi | 3/2.0 | 1,382 (+1%) | 20mo | $499,900 | $362 | 78 |
| 151 NE 19th Ave | 0.07mi | 3/2.0 | 1,190 (-13%) | 10mo | $430,000 | $361 | 67 |
| 1353 N Pacific Ln | 0.19mi | 3/2.0 | 1,464 (+7%) | 16mo | $750,000 | $512 | 66 |
| 1064 Necarney St | 0.60mi | 3/2.0 | 1,263 (-8%) | 4mo | $475,000 | $376 | 56 |
| 1068 Necarney St | 0.60mi | 3/2.0 | 1,263 (-8%) | 8mo | $490,000 | $388 | 52 |
| 1176 Necarney St | 0.58mi | 3/2.0 | 1,263 (-8%) | 15mo | $490,000 | $388 | 48 |
Match score weights: distance 35% · size 25% · config 20% · recency 20%. Top-matched comps best support the ARV.
Projected returns pro-forma
-3.0% appreciation · 3.0% rent growth · sell at horizon
- IRR
- 5.4%
- Equity multiple
- 1.21×
- Total profit
- $29,174
- Equity at exit
- $74,537
- IRR
- 14.8%
- Equity multiple
- 2.19×
- Total profit
- $166,765
- Equity at exit
- $43,222
Cash invested: $139,972 (down + closing). Projections, not guarantees.
Landlord ↔ Tenant lean methodology
- Overall (STATE)
- 28 Tenant-Leaning
- State Oregon
- 28 Tenant-Leaning · D+6
- County
- — inherits STATE
- City
- — inherits STATE
ZIP-level market 97136
- Home prices YoY
- -34.6%
- Active inventory
- 130
- Price-to-rent
- 6.9×
Monthly cashflow live
- Estimated rent
- $6,000 medium interval (Pro) →
- Mortgage (P&I)
- −$2,622
- Tax from tax record
- −$177 /mo · $2,128/yr
- Insurance
- −$208
- HOA
- −$0
- Vacancy / Maint / Mgmt
- −$1,260
- Net cashflow
- $1,733
Break-even live
Sensitivity live
| Price | -10% $2,016 | -5% $1,874 | +0% $1,733 | +5% $1,591 | +10% $1,450 |
|---|---|---|---|---|---|
| Rent | -10% $1,259 | -5% $1,496 | +0% $1,733 | +5% $1,970 | +10% $2,207 |
| Rate | -1.0pp $1,985 | -0.5pp $1,860 | base $1,733 | +0.5pp $1,603 | +1.0pp $1,471 |
UW: 25.0% down · 7.5% · 30yr · 1.5% tax · 5.0% vac · 8.0% maint · 8.0% mgmt
Financing live
Cash to close
- Down payment
- $124,975
- Closing costs
- $14,997
- Reserves months
- —
- Total cash needed
- —
Loan-product check · same deal, 3 products live
Conventional
25% down · 7.5% · 30yr
- Down + closing
- —
- Monthly P&I
- —
- Monthly cashflow
- —
- DSCR
- —
- Eligible?
- —
Personal DTI + credit; lowest rate.
DSCR
20% down · 8.5% · 30yr
- Down + closing
- —
- Monthly P&I
- —
- Monthly cashflow
- —
- DSCR
- —
- Eligible?
- —
No personal income docs; deal must DSCR.
Hard money
10% down · 12.0% · 12mo
- Down + closing
- —
- Monthly P&I
- —
- Monthly cashflow
- —
- DSCR
- —
- Eligible?
- —
Short-term bridge; refi at stabilization.
Rent comps 1 comps
| Address | Beds | Baths | Sqft | Rent | $/sqft | DOM | Units | Dist |
|---|---|---|---|---|---|---|---|---|
| 145 N Dolphin St Rockaway Beach, OR | 2.0 | 2.0 | 1020 | $6,000 | $5.88 | 45d | 1 | 1.17mi |
Listing history 13 events
-
2026-06-21days on market $499,900 Active 16 DOM
-
2026-06-21days on market $499,900 Active 15 DOM
-
2026-06-18days on market $499,900 Active 13 DOM
-
2026-06-17days on market $499,900 Active 12 DOM
-
2026-06-16days on market $499,900 Active 11 DOM
-
2026-06-15days on market $499,900 Active 10 DOM
-
2026-06-13days on market $499,900 Active 8 DOM
-
2026-06-12days on market $499,900 Active 7 DOM
-
2026-06-09days on market $499,900 Active 4 DOM
-
2026-06-08days on market $499,900 Active 3 DOM
-
2026-06-08days on market $499,900 Active 2 DOM
-
2026-06-07remarks 685-char remark
-
2026-06-07$499,900 Active 1 DOM
ⓘ Source: listings_history table (triggers on properties + properties_extension) + one-shot
backfill from property_details.listing_events for pre-trigger history.
Tax reassessment forecast OR · Resets to sale price
- Current annual tax
- $2,128 · $177/mo
- Projected year-2 tax
- $4,849 · $404/mo
- Expected delta
- +$2,721/yr (+$227/mo · 127.8%)
ⓘ Screening estimate from a state-policy table — verify with the county assessor before closing.
Climate risk First Street
- Flood 1/10 Low FEMA zone X (unshaded) · 0% chance over 30 yrs
- Wildfire 1/10 Low
- Heat 1/10 Low 9 d/yr ≥76°F today · 18 d/yr by 30 yrs out
- Wind 1/10 Low
- Air quality 6/10 Major 8 unhealthy d/yr today · 9 by 30 yrs out
Nearby sold comps map
Loading sold comps map…
Walkable amenities ~0.75 mi
Loading nearby amenities…
Taxation est. · year 1
- Rental income
- $72,000
- − Mortgage interest
- −$28,002
- − Property taxes
- −$2,128
- − Insurance
- −$2,500
- − Repairs & maintenance
- −$5,760
- − Management
- −$5,760
- − Depreciation
- −$14,543
- Taxable income
- $13,307
- Est. tax owed @ 24.0%
- −$3,194
- After-tax cash flow
- $17,600/yr
For passive investors: Depreciation is non-cash, so a rental often shows a tax loss while cash-flowing — sheltering income. Rental losses are passive: they offset passive income freely, and up to $25,000/yr can offset ordinary (W-2) income if you actively participate and your MAGI is under $100k (phasing out to $0 by $150k); unused losses carry forward. On sale, claimed depreciation is recaptured at up to 25%, and gains may owe capital-gains tax (a 1031 exchange can defer both). Figures are a year-1 estimate at your 24.0% rate — not tax advice; consult a CPA.
Schools (NCES district)
- District
- Neah-Kah-Nie SD 56
- NCES district ID
- 4108650
- Math proficiency
- 39% ▼ -4.00%
- Reading proficiency
- 55% ▼ -4.00%
- Median HH income
- $42,437
- Composite
- 41.68/100
- National rank
- #7205
- State rank
- #62 of 183 in OR
Livability — Rockaway Beach
- Score
- 74/100
- State rank
- #94
- US rank
- #4777
Category grades
Schools grade is shown separately in the Schools card above.
Census & demographics
- Census place
- Rockaway Beach, OR
- Population (ZIP)
- 2,422
Population outlook (Tillamook County) Hauer SSP2
- Today (2025)
- 26,318 people
- By 2030
- 26,603 · +1.1%
- By 2040
- 26,898 · +2.2%
- By 2050
- 27,129 · +3.1%
- By 2075
- 27,858 · +5.9%
- By 2100
- 26,212 · -0.4%
Race, ethnicity, and origin ACS 2023
- Neighborhood character
- Predominantly White (94%)
- Race & ethnicity
- White 94% Hispanic / Latino 2% Two or more races 2% Asian 1%
- Common ancestry
- Slovak 4% Iranian 4% Portuguese 3%
- Foreign-born
- 2% · Canada
- Languages at home
- 93% English-only · Spanish 4% French/Haitian/Cajun 1% Other Indo-European 1%
Political lean MEDSL · Tillamook
- 2024 margin
- Toss-up / Even · D 47.9% · R 49.2% · Other 2.9%
- 2008→2024 swing
- -11.2pp toward R · 2008: 9.9pp · 2024: -1.4pp
- All cycles
- 2024: R+1.4 2020: R+1.7 2016: R+5.9 2012: D+4.7 2008: D+9.9
Not yet ingested
- Civics
- —
Market trends
- HPI YoY
- ▼ -121.02%
- Current HPI
- 228.3227
- Rent YoY
- —
- Metro
- —
- State GDP YoY
- ▲ 2.05%
- F500 in state
- 2
Industry mix (Fortune 500 HQ in OR)
| Industry | F500 HQs | Revenue |
|---|---|---|
| Consumer Goods | 1 | $51B |
|
||
Price history
+614.1% since first listed2 events — show timeline
- 2026-06-05 Listed $499,900 RMLS
- 2013-02-13 Sold (Public Records) $70,000 Public Records
Property tax history
+3.0%/yrLatest (2025): $2,128 · +8.6% YoY. Source: county tax records.
Cash-flow waterfall
monthlySold comps — $/sqft
last 12 mo · ≤1 miLoading sold comps…