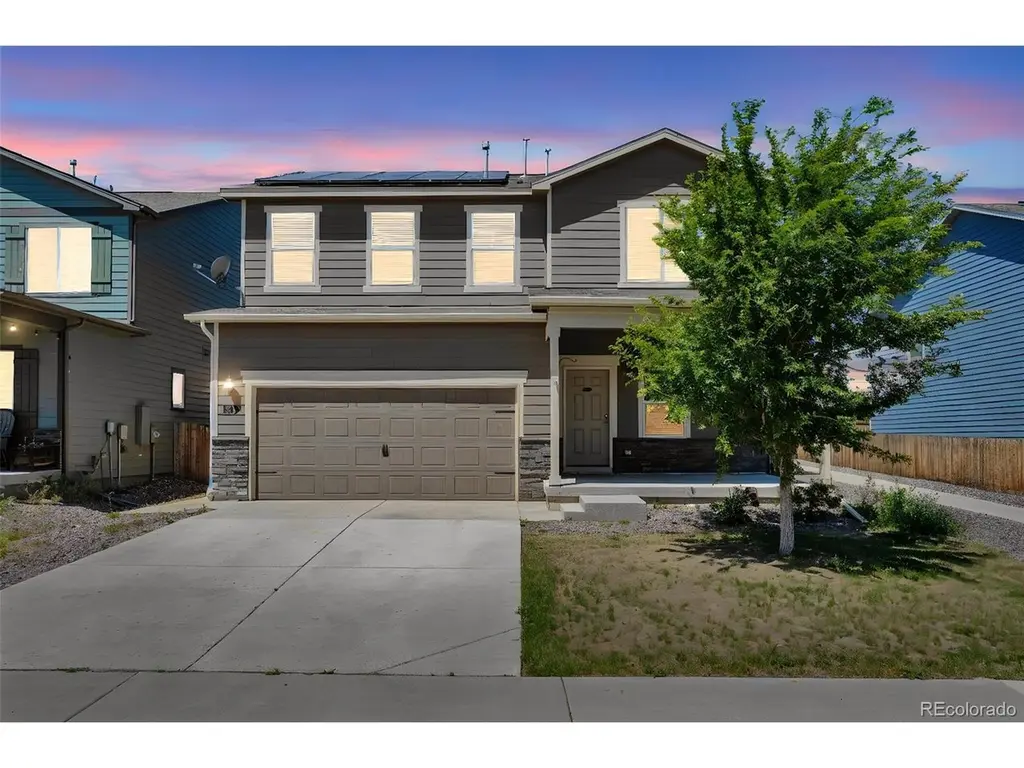
359 Maple St · Bennett, CO
Flood risk 1/10 · Minimal
- FEMA flood zone
- X (unshaded)
- Chance of flooding over 30 yrs
- 0.0%
- Est. flood insurance / yr
- $507 – $1,088
Fire risk 5/10 · Moderate
- Est. fire insurance / yr
- $939 – $1,743
Heat risk 3/10 · Minor
- Hot days now (above 93°F)
- 6 days/yr
- Hot days in 30 yrs
- 14 days/yr
Wind risk 2/10 · Minimal
- Chance of severe wind over 30 yrs
- —
Air-quality risk 2/10 · Minimal
- Unhealthy air days now
- 1 days/yr
- Unhealthy air days in 30 yrs
- 2 days/yr
Risk factors via First Street. Map © Google.
Why this score? — see what drove the D grade
The composite is a weighted blend of 9 inputs, each scored 0–100. Each bar is that input's sub-score; the figure is the points it added to the 100-point composite (weight × sub-score).
- Appreciation +10.0/10.0
- ARV discount +9.5/15.0
- Cash flow +7.8/30.0
- Livability +3.0/5.0
- Rent growth +2.5/5.0
- Condition / age +2.5/5.0
- Schools +2.1/10.0
- 1% rule +2.0/10.0
- DSCR +1.9/10.0
$435,000
🖨 Deal sheet (PDF) 📄 Offer letter ✓ Due diligence
Listing remarks MLS
Welcome home! Built in 2021, this beautiful 3-bedroom, 3-bathroom home offers modern finishes, an open and functional floor plan, and the peace of newer construction without the wait. The bright and inviting main living area flows seamlessly into the kitchen and dining space, creating the perfect setting for everyday living and entertaining. Upstairs, you'll find an open loft and spacious bedrooms, including a comfortable primary suite with a private bath and ample closet space. Thoughtfully designed with today's lifestyle in mind, this home provides the ideal balance of comfort, style, and practicality. This premium location backing to the neighborhood park, offering scenic views, added privacy, and easy access to open green space, playgrounds, and walking paths right from your backyard. Whether you're enjoying a morning coffee on the patio or watching the sunset over the park, this home delivers a truly special outdoor experience. Conveniently located near schools, shopping, dining, and easy access to I-70, this move-in-ready home is a fantastic opportunity to enjoy small-town charm with modern conveniences.
Key facts
- Open loft
- Private bath
- Newer construction
Tags
Property features AI
Finance
- HOA & community: Homeowners association managed by Homestead Management Corporation; Professionally managed; Monthly HOA fee of $50 (annual $600); HOA covers grounds maintenance; Community amenities include a park and a playground; Pets allowed (cats and dogs)
Exterior
- Parking: Attached 2-car garage; Concrete driveway/parking; Finished garage
- Utilities: Electricity connected (110V and 220V); Natural gas connected; Public sewer; Cable available; Wired internet available; Phone service available
- Home design: Single family residence; House with two levels; Ground-level entry
- Construction: Frame construction with wood siding; Composition roof; Crawl space foundation; Built as a house (residential)
- Exterior features: Front porch; Patio; Full yard fencing; Public water
Interior
- Kitchen: Dishwasher; Microwave; Oven; Range; Refrigerator; Freezer; Eat-in kitchen; Granite counters; Pantry
- Bedrooms: Three bedrooms (all on upper level); Primary suite on upper level
- Flooring: Carpet; Laminate; Tile; Vinyl
- Bathrooms: Three bathrooms total — two full (upper level) and one half (main level); En suite bathroom in one bedroom
- Heating & cooling: Forced air heating (natural gas); Central air conditioning
- Interior features: Eat-in kitchen; Granite counters; Pantry; Primary suite; Smoke free; Walk-in closet(s)
- Laundry & utility: In-unit laundry; Washer; Dryer; Gas water heater
Neighborhood map
What this means for you Summary
Snapshot
- This is a 3-bed/3.0-bath single-family listed at $435k.
Deal economics
- At list price, monthly cash flow is $-476 ($-6k/yr) — negative.
- To cash-flow at today's rent, offer at most $351k (19.3% below list).
- To meet the 1% rule (rent ≥ 1% of price), the offer needs to be $306k (29.6% below list).
- Recommended offer: $306k (29.6% below list) — sets the bar for 1% rule.
Location & tenants
- Location reads 59/100 on livability (#263 in CO) — a working-class tenant base; expect higher turnover. Strengths: housing A+, crime A-; Watch: cost of living D+, amenities F, commute F.
- Bennett School District No. 29J (rural): math 13% / reading 31% proficiency, ranked #69 of 86 in CO (top 80%) — low school quality limits family demand, transient renter base, plan for 1-2y turnover.
- Zoned schools: Bennett Preschool (71 students, 11% FRL); Bennett Middle School (math 8% / reading 42%, grade F, #168 of 270 statewide, top 63%, 304 students, 38% FRL); Bennett High School (math 22% / reading 47%, grade F, #209 of 381 statewide, top 56%, 427 students, 25% FRL) — zoned schools at 25% FRL track the district average.
- Market conditions: 213 active listings in the ZIP; 2 comparable units currently listed for rent nearby; 2,299 units permitted in Adams County in 2024 (343 in 5+ unit buildings).
Forward outlook
- In year one you build about $47k of equity ($3k loan paydown + $44k appreciation (10.0% local appreciation)).
- Adams County population projected at +44% by 2050 — long-run rental-demand tailwind backs the buy-and-hold thesis.
- By year 2, paydown + projected appreciation supports a ~$75k cash-out refi (75% LTV) — recoverable capital for the next deal without selling this one.
Negotiation context
- It's been on market 16 days — a 2% lower offer ($428k) is reasonable based on typical stale-listing flexibility.
- 6 sale attempts since 5y ago with the ask held roughly flat each time — persistent listings suggest the price (not the market) is what's stuck; bring a comps-based counter.
Risks & watch-outs
- Climate carrying-cost: moderate wildfire risk — expect insurance premiums to compound above CPI over the hold.
Questions for the listing agent
- What do current leases actually rent for vs. the listed asking? Can we see a recent rent roll and the last 12 months of T-12 income?
- What does the HOA fee cover, when was the last increase, and are there any pending special assessments or reserve-fund shortfalls?
- Is there a deadline driving the sale (1031 exchange, divorce, estate, relocation)? That informs how much negotiation room exists.
- Schools are F-rated, which usually means shorter tenancies and higher turnover. Who's the typical renter profile here, and what's been the actual vacancy rate?
- The area grade is low — what's the realistic commute time and amenity access for the typical tenant pool here? Any planned neighborhood developments (good or bad) we should know about?
- What's the average days-on-market for RENTAL listings here right now (not sales)? A rising rental-DOM trend means longer vacancies and softer asking-rent achievability than the comps imply.
- What's the recent tenant-quality profile in this submarket — average credit score on applications, eviction rate, late-payment / NSF rate, and stable-employment percentage? A property-management company in the area should have these aggregated.
- How much new for-sale + rental construction is in the pipeline within 1–3 miles? Heavy new supply typically softens prices + rents 12–24 months out; constrained supply supports both.
Investment metrics
- 1% rule
- 0.70% ✗
- Cap rate
- 4.98%
- Cash-on-cash
- -4.69%
- DSCR
- 0.79
- GRM
- 11.8
CMA / ARV
- ARV (on-the-fly)
- $455,716
- Comps found
- 12
Show comp detail 12 sales within ~0.75 mi
| Address | Dist | Beds/Ba | Sqft | Sold | Price | $/sf | Match |
|---|---|---|---|---|---|---|---|
| 325 Walnut St | 0.12mi | 3/3.0 | 1,931 (0%) | 1mo | $432,000 | $224 | 94 |
| 47373 Lily Ave | 0.11mi | 3/3.0 | 1,931 (0%) | 2mo | $430,000 | $223 | 93 |
| 47322 Iris Ave | 0.17mi | 3/3.0 | 1,931 (0%) | 3mo | $430,000 | $223 | 90 |
| 625 Aspen Ave | 0.20mi | 3/3.0 | 1,733 (-10%) | 1mo | $393,900 | $227 | 73 |
| 625 Aspen Ave | 0.20mi | 3/2.5 | 1,733 (-10%) | 1mo | $393,900 | $227 | 71 |
| 46589 Sunflower Ln | 0.66mi | 3/3.0 | 1,944 (+1%) | 1mo | $459,390 | $236 | 67 |
| 46573 Sunflower Ln | 0.68mi | 3/3.0 | 1,944 (+1%) | 3mo | $467,999 | $241 | 65 |
| 46569 Sunflower Ln | 0.69mi | 3/3.0 | 1,944 (+1%) | 4mo | $424,999 | $219 | 63 |
| 271 Birch St | 0.28mi | 4/2.0 (+1) | 1,786 (-8%) | 3mo | $425,000 | $238 | 63 |
| 46581 Sunflower Ln | 0.67mi | 4/4.0 (+1) | 1,930 (-0%) | 3mo | $481,720 | $250 | 58 |
| 46570 Avery Ln | 0.70mi | 3/3.0 | 1,643 (-15%) | 4mo | $404,999 | $246 | 39 |
| 46526 Avery Ln | 0.74mi | 3/2.0 | 1,643 (-15%) | 3mo | $419,990 | $256 | 34 |
Match score weights: distance 35% · size 25% · config 20% · recency 20%. Top-matched comps best support the ARV.
Projected returns pro-forma
10.0% appreciation · 3.0% rent growth · sell at horizon
- IRR
- 20.9%
- Equity multiple
- 2.70×
- Total profit
- $206,555
- Equity at exit
- $391,882
- IRR
- 19.0%
- Equity multiple
- 6.19×
- Total profit
- $632,086
- Equity at exit
- $845,109
Cash invested: $121,800 (down + closing). Projections, not guarantees.
Landlord ↔ Tenant lean methodology
- Overall (STATE)
- 38 Tenant-Leaning
- State Colorado
- 38 Tenant-Leaning · D+4
- County
- — inherits STATE
- City
- — inherits STATE
ZIP-level market 80102
- Home prices YoY
- 3.1%
- Active inventory
- 213
- Price-to-rent
- 11.8×
Monthly cashflow live
- Estimated rent
- $3,064 medium interval (Pro) →
- Mortgage (P&I)
- −$2,281
- Tax from tax record
- −$385 /mo · $4,617/yr
- Insurance
- −$181
- HOA
- −$50
- Vacancy / Maint / Mgmt
- −$644
- Net cashflow
- $-476
Break-even live
Sensitivity live
| Price | -10% $-230 | -5% $-353 | +0% $-476 | +5% $-599 | +10% $-723 |
|---|---|---|---|---|---|
| Rent | -10% $-718 | -5% $-597 | +0% $-476 | +5% $-355 | +10% $-234 |
| Rate | -1.0pp $-257 | -0.5pp $-366 | base $-476 | +0.5pp $-589 | +1.0pp $-704 |
UW: 25.0% down · 7.5% · 30yr · 1.5% tax · 5.0% vac · 8.0% maint · 8.0% mgmt
Financing live
Cash to close
- Down payment
- $108,750
- Closing costs
- $13,050
- Reserves months
- —
- Total cash needed
- —
Loan-product check · same deal, 3 products live
Conventional
25% down · 7.5% · 30yr
- Down + closing
- —
- Monthly P&I
- —
- Monthly cashflow
- —
- DSCR
- —
- Eligible?
- —
Personal DTI + credit; lowest rate.
DSCR
20% down · 8.5% · 30yr
- Down + closing
- —
- Monthly P&I
- —
- Monthly cashflow
- —
- DSCR
- —
- Eligible?
- —
No personal income docs; deal must DSCR.
Hard money
10% down · 12.0% · 12mo
- Down + closing
- —
- Monthly P&I
- —
- Monthly cashflow
- —
- DSCR
- —
- Eligible?
- —
Short-term bridge; refi at stabilization.
Rent comps 2 comps
| Address | Beds | Baths | Sqft | Rent | $/sqft | DOM | Units | Dist |
|---|---|---|---|---|---|---|---|---|
| 239 Adams St Bennett, CO | 3.0 | 2.5 | 1653 | $3,000 | $1.81 | 26d | 1 | 0.19mi |
| 129 Racer St Bennett, CO | 4.0 | 3.0 | 2536 | $3,500 | $1.38 | 26d | 1 | 1.12mi |
HOA detail
- Monthly dues
- $50 · $600/yr
- Likely covers
- landscaping
Listing history 11 events
-
2026-06-21days on market $435,000 Active 16 DOM
-
2026-06-18days on market $435,000 Active 13 DOM
-
2026-06-17days on market $435,000 Active 12 DOM
-
2026-06-16days on market $435,000 Active 11 DOM
-
2026-06-15days on market $435,000 Active 10 DOM
-
2026-06-13days on market $435,000 Active 8 DOM
-
2026-06-13days on market $435,000 Active 7 DOM
-
2026-06-09days on market $435,000 Active 4 DOM
-
2026-06-08days on market $435,000 Active 3 DOM
-
2026-06-07remarks 699-char remark
-
2026-06-07$435,000 Active 2 DOM
ⓘ Source: listings_history table (triggers on properties + properties_extension) + one-shot
backfill from property_details.listing_events for pre-trigger history.
Tax reassessment forecast CO · Resets to sale price
- Current annual tax
- $4,617 · $385/mo
- Projected year-2 tax
- $4,617 · $385/mo
- Expected delta
- $0/yr ($0/mo · 0.0%)
ⓘ Screening estimate from a state-policy table — verify with the county assessor before closing.
Climate risk First Street
- Flood 1/10 Low FEMA zone X (unshaded) · 0% chance over 30 yrs
- Wildfire 5/10 Major
- Heat 3/10 Moderate 6 d/yr ≥93°F today · 14 d/yr by 30 yrs out
- Wind 2/10 Low
- Air quality 2/10 Low 1 unhealthy d/yr today · 2 by 30 yrs out
Nearby sold comps map
Loading sold comps map…
Walkable amenities ~0.75 mi
Loading nearby amenities…
Taxation est. · year 1
- Rental income
- $36,773
- − Mortgage interest
- −$24,367
- − Property taxes
- −$4,617
- − Insurance
- −$2,175
- − Repairs & maintenance
- −$2,942
- − Management
- −$2,942
- − HOA
- −$600
- − Depreciation
- −$12,655
- Taxable loss
- −$13,524
- Est. tax savings @ 24.0%
- +$3,246
- After-tax cash flow
- $-2,470/yr
For passive investors: Depreciation is non-cash, so a rental often shows a tax loss while cash-flowing — sheltering income. Rental losses are passive: they offset passive income freely, and up to $25,000/yr can offset ordinary (W-2) income if you actively participate and your MAGI is under $100k (phasing out to $0 by $150k); unused losses carry forward. On sale, claimed depreciation is recaptured at up to 25%, and gains may owe capital-gains tax (a 1031 exchange can defer both). Figures are a year-1 estimate at your 24.0% rate — not tax advice; consult a CPA.
Schools (NCES district)
- District
- Bennett School District No. 29J
- NCES district ID
- 0802430
- Math proficiency
- 13% ▼ -10.00%
- Reading proficiency
- 31% ▼ -9.00%
- Median HH income
- $69,795
- Composite
- 21.39/100
- National rank
- #8353
- State rank
- #69 of 86 in CO
Livability — Bennett
- Score
- 59/100
- State rank
- #263
- US rank
- #19691
Category grades
Schools grade is shown separately in the Schools card above.
Census & demographics
- Census place
- Bennett, CO
- City population
- 5,994
- Population (ZIP)
- 5,994
Population outlook (Adams County) Hauer SSP2
- Today (2025)
- 598,184 people
- By 2030
- 651,880 · +9.0%
- By 2040
- 759,778 · +27.0%
- By 2050
- 862,889 · +44.3%
- By 2075
- 1,085,994 · +81.5%
- By 2100
- 1,211,318 · +102.5%
Race, ethnicity, and origin ACS 2023
- Neighborhood character
- Predominantly White (72%)
- Race & ethnicity
- White 72% Hispanic / Latino 21% Two or more races 11% Black 2%
- Hispanic origin (detail)
- Mexican 17% Puerto Rican 1%
- Common ancestry
- Serbian 4% Italian 3% Lithuanian 2%
- Foreign-born
- 6% · Canada, China
- Languages at home
- 87% English-only · Spanish 10% German/W. Germanic 1% Chinese 1%
Political lean MEDSL · Adams
- 2024 margin
- Lean D (+9.0) · D 53.2% · R 44.1% · Other 2.7%
- 2008→2024 swing
- -9.3pp toward R · 2008: 18.4pp · 2024: 9.0pp
- All cycles
- 2024: D+9.0 2020: D+16.3 2016: D+7.2 2012: D+15.1 2008: D+18.4
Not yet ingested
- Civics
- —
Market trends
- HPI YoY
- ▲ 14.94%
- Current HPI
- 494.39
- Rent YoY
- —
- Metro
- —
- State GDP YoY
- ▲ 1.95%
- F500 in state
- 14
Industry mix (Fortune 500 HQ in CO)
| Industry | F500 HQs | Revenue |
|---|---|---|
| Technology Distribution | 1 | $31B |
|
||
| Food / Agriculture | 1 | $18B |
|
||
| Packaging | 1 | $14B |
|
||
| Healthcare | 1 | $13B |
|
||
| Energy | 1 | $10B |
|
||
| Technology | 1 | $4B |
|
||
Price history
+7.2% since first listed15 events — show timeline
- 2026-06-05 Listed $435,000 REColorado as Distributed by MLS Grid
- 2026-06-05 Listed $435,000 IRES
- 2023-03-06 Sold (MLS) $475,000 IRES
- 2023-03-06 Sold (MLS) $475,000 REColorado as Distributed by MLS Grid
- 2023-02-01 Pending — IRES
- 2023-02-01 Pending — REColorado as Distributed by MLS Grid
- 2023-01-27 Price Changed $478,000 IRES
- 2023-01-27 Listed $475,000 IRES
- 2023-01-27 Listed $478,000 REColorado as Distributed by MLS Grid
- 2021-05-21 Sold (MLS) $405,900 REColorado as Distributed by MLS Grid
- 2021-05-21 Sold (MLS) $405,900 IRES
- 2021-01-26 Price Changed $405,900 REColorado as Distributed by MLS Grid
- 2021-01-26 Pending — REColorado as Distributed by MLS Grid
- 2021-01-22 Listed $409,900 REColorado as Distributed by MLS Grid
- 2021-01-22 Listed $405,900 IRES
Property tax history
+174.3%/yrLatest (2025): $4,617 · -2.8% YoY. Source: county tax records.
Cash-flow waterfall
monthlySold comps — $/sqft
last 12 mo · ≤1 miLoading sold comps…