 🔨 Auction
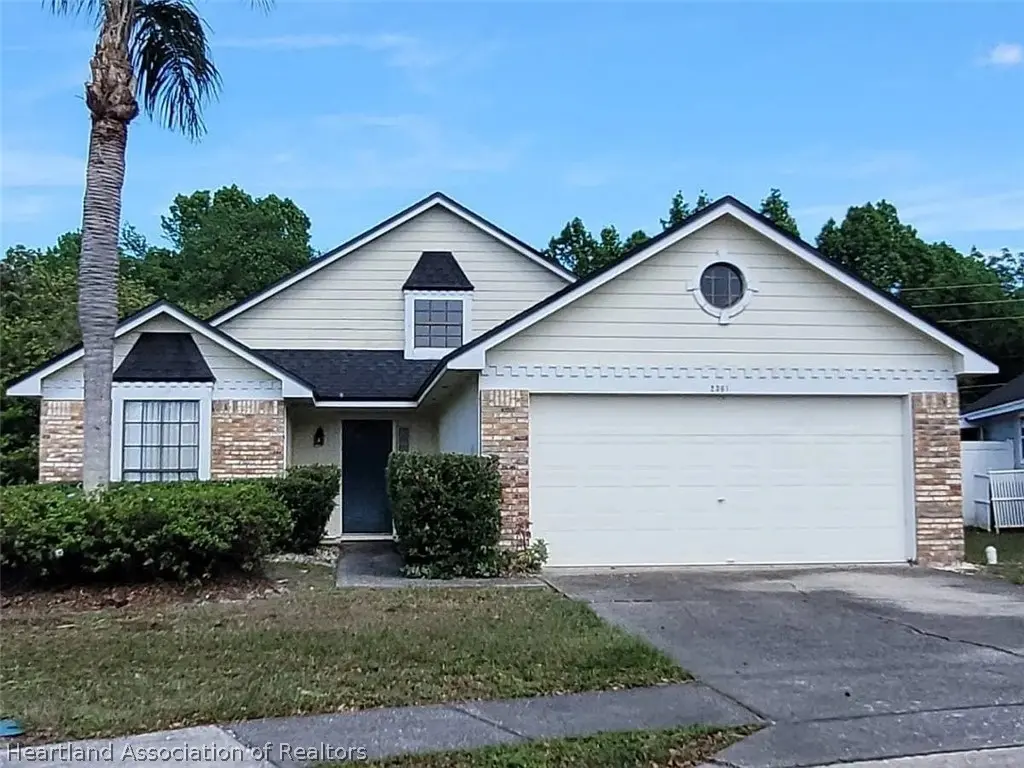
2361 Roanoke Ct · Lake Mary, FL
Flood risk 1/10 · Minimal
- FEMA flood zone
- X (unshaded)
- Chance of flooding over 30 yrs
- 0.0%
- Est. flood insurance / yr
- $507 – $1,088
Fire risk 3/10 · Minor
- Est. fire insurance / yr
- $947 – $1,759
Heat risk 8/10 · Major
- Hot days now (above 107°F)
- 7 days/yr
- Hot days in 30 yrs
- 22 days/yr
Wind risk 9/10 · Severe
- Chance of severe wind over 30 yrs
- 99.0%
Air-quality risk 2/10 · Minimal
- Unhealthy air days now
- 1 days/yr
- Unhealthy air days in 30 yrs
- 2 days/yr
Risk factors via First Street. Map © Google.
Why this score? — see what drove the F grade
The composite is a weighted blend of 9 inputs, each scored 0–100. Each bar is that input's sub-score; the figure is the points it added to the 100-point composite (weight × sub-score).
- ARV discount +7.5/15.0
- Cash flow +5.9/30.0
- Schools +5.1/10.0
- Livability +4.0/5.0
- Rent growth +2.8/5.0
- Condition / age +2.5/5.0
- 1% rule +1.3/10.0
- DSCR +0.3/10.0
- Appreciation +0.0/10.0
$5,000
🖨 Deal sheet 📄 Offer letter ✓ Due diligence
Listing remarks
Foreclosure Auction Ends June 25, 2026 at 11:00 AM EST. Explore this charming 3-bedroom, 2.5-bath residence set in a peaceful and well-located Lake Mary community. The list price is the opening bid for the online auction. Sold As-is. Explore more details and submit your bid through Federa Home App.
Key facts
- 7,405 sq ft lot
- 2 garage spots
- Built 1990
Property features AI
Exterior
- Parking: 2-car garage
- Utilities: Water: Other; Sewer: Other
- Home design: Single-family residence; One story; Planned Development (PD) zoning
- Construction: Construction details: see remarks; Other roof
- Exterior features: Front porch; Cul-de-sac-facing lot; Road surface: Other
Interior
- Bedrooms: 1 total room
- Flooring: Other
- Bathrooms: 2 full bathrooms; 1 half bathroom
- Heating & cooling: No heating; No cooling
- Interior features: Other flooring
Neighborhood map
What this means for you Summary
Snapshot
- This is a 3-bed/2.5-bath single-family listed at $5k.
Deal economics
- At list price, monthly cash flow is $-723 ($-9k/yr) — negative.
- The deal already cash-flows at list — no discount required.
- Meets the 1% rule at list price ($2k rent vs $5k).
Location & tenants
- Location reads 80/100 on livability (#128 in FL, #1,923 nationally) — a professional / high-income tenant draw. Strengths: employment A+, housing A+, health & safety A+; Watch: commute F, cost of living D-.
- Seminole (suburban): math 57% / reading 61% proficiency, ranked #13 of 73 in FL (top 18%) — acceptable for families but not a draw, mixed tenant base, ~2y average lease.
- Market conditions: Rents rising (+1.0%/yr); 317 active listings in the ZIP; 31 comparable units currently listed for rent nearby; rentals leasing fast (median 12d on market — plan ~1-2 weeks tenant-placement turnaround); solid renter incomes; 1,979 units permitted in Seminole County in 2024 (1,191 in 5+ unit buildings).
Forward outlook
- Local home prices are declining (-3.0%/yr); year-one equity from $3k of loan paydown is wiped out by about $11k of value loss. Plan a longer hold.
- Seminole County population projected at +24% by 2050 — long-run rental-demand tailwind backs the buy-and-hold thesis.
Negotiation context
- Only 2 days on market — expect competitive offers; lowballing is unlikely to land.
Risks & watch-outs
- Watch-outs: property tax is 110.7% of price.
- Climate carrying-cost: severe wind risk, 99% chance of damaging wind over 30y; extreme-heat days projected 7→22/yr by 2055 (HVAC capex compounding) — expect insurance premiums to compound above CPI over the hold.
Questions for the listing agent
- What do current leases actually rent for vs. the listed asking? Can we see a recent rent roll and the last 12 months of T-12 income?
- Property tax is high relative to price — has the assessment been appealed recently, and will the sale trigger a re-assessment?
- Is there a deadline driving the sale (1031 exchange, divorce, estate, relocation)? That informs how much negotiation room exists.
- Schools are B-rated — typically a magnet for longer-tenancy family renters. What's the average tenant stay here, and is there a school-zone premium baked into asking?
- The area grade is low — what's the realistic commute time and amenity access for the typical tenant pool here? Any planned neighborhood developments (good or bad) we should know about?
- What's the average days-on-market for RENTAL listings here right now (not sales)? A rising rental-DOM trend means longer vacancies and softer asking-rent achievability than the comps imply.
- What's the recent tenant-quality profile in this submarket — average credit score on applications, eviction rate, late-payment / NSF rate, and stable-employment percentage? A property-management company in the area should have these aggregated.
- How much new for-sale + rental construction is in the pipeline within 1–3 miles? Heavy new supply typically softens prices + rents 12–24 months out; constrained supply supports both.
Investment metrics
- 1% rule
- 0.63% ✗
- Cap rate
- 3.94%
- Cash-on-cash
- -8.40%
- DSCR
- 0.63
- GRM
- 13.3
CMA / ARV
- ARV (on-the-fly)
- $369,000
- Comps found
- 12
Show comp detail 12 sales within ~0.75 mi
| Address | Dist | Beds/Ba | Sqft | Sold | Price | $/sf | Match |
|---|---|---|---|---|---|---|---|
| 533 Remington Oak Dr | 0.37mi | 2/2.0 (-1) | 1,494 (+1%) | 2mo | $335,000 | $224 | 72 |
| 568 Tall Oaks Ter | 0.62mi | 3/2.0 | 1,513 (+2%) | 3mo | $400,000 | $264 | 63 |
| 364 Howard Blvd | 0.66mi | 3/2.0 | 1,428 (-3%) | 5mo | $350,000 | $245 | 58 |
| 330 Marjorie Blvd | 0.61mi | 3/2.0 | 1,375 (-7%) | 1mo | $357,000 | $260 | 57 |
| 445 Amethyst Way | 0.66mi | 2/2.5 (-1) | 1,412 (-4%) | 1mo | $429,500 | $304 | 56 |
| 158 Burns Ave | 0.68mi | 4/2.0 (+1) | 1,470 (-0%) | 6mo | $294,000 | $200 | 56 |
| 479 Cidermill Pl | 0.63mi | 2/2.5 (-1) | 1,412 (-4%) | 4mo | $390,000 | $276 | 54 |
| 257 Gary Blvd | 0.45mi | 3/2.0 | 1,267 (-14%) | 1mo | $365,000 | $288 | 52 |
| 116 Exeter Ave | 0.74mi | 3/2.0 | 1,582 (+7%) | 4mo | $352,000 | $223 | 49 |
| 170 Clyde Ave | 0.63mi | 3/2.0 | 1,658 (+12%) | 5mo | $399,000 | $241 | 44 |
| 459 Cidermill Pl | 0.68mi | 3/2.0 | 1,660 (+12%) | 3mo | $350,000 | $211 | 43 |
| 466 Cidermill Pl | 0.66mi | 3/2.0 | 1,660 (+12%) | 6mo | $415,000 | $250 | 41 |
Match score weights: distance 35% · size 25% · config 20% · recency 20%. Top-matched comps best support the ARV.
Projected returns pro-forma
-3.0% appreciation · 1.0% rent growth · sell at horizon
- IRR
- -33.3%
- Equity multiple
- -0.07×
- Total profit
- $-110,386
- Equity at exit
- $55,019
- IRR
- -54.5%
- Equity multiple
- -0.68×
- Total profit
- $-173,280
- Equity at exit
- $31,904
Cash invested: $103,320 (down + closing). Projections, not guarantees.
Landlord ↔ Tenant lean methodology
- Overall (STATE)
- 87 Strongly Landlord-Friendly
- State Florida
- 87 Strongly Landlord-Friendly · R+3
- County
- — inherits STATE
- City
- — inherits STATE
ZIP-level market 32746
- Home prices YoY
- -21.9%
- Rents YoY
- 1.0%
- Active inventory
- 317
- Price-to-rent
- 0.2×
Monthly cashflow live
- Estimated rent
- $2,312 high interval (Pro) →
- Mortgage (P&I)
- −$1,935
- Tax est. 1.5%
- −$461 /mo · $5,535/yr
- Insurance
- −$154
- HOA
- −$0
- Vacancy / Maint / Mgmt
- −$486
- Net cashflow
- $-723
Break-even live
UW: 25.0% down · 7.5% · 30yr · 1.5% tax · 5.0% vac · 8.0% maint · 8.0% mgmt
Financing live
Cash to close
- Down payment
- $92,250
- Closing costs
- $11,070
- Reserves months
- —
- Total cash needed
- —
Loan-product check · same deal, 3 products live
Conventional
25% down · 7.5% · 30yr
- Down + closing
- —
- Monthly P&I
- —
- Monthly cashflow
- —
- DSCR
- —
- Eligible?
- —
Personal DTI + credit; lowest rate.
DSCR
20% down · 8.5% · 30yr
- Down + closing
- —
- Monthly P&I
- —
- Monthly cashflow
- —
- DSCR
- —
- Eligible?
- —
No personal income docs; deal must DSCR.
Hard money
10% down · 12.0% · 12mo
- Down + closing
- —
- Monthly P&I
- —
- Monthly cashflow
- —
- DSCR
- —
- Eligible?
- —
Short-term bridge; refi at stabilization.
Rent comps 31 comps
| Address | Beds | Baths | Sqft | Rent | $/sqft | DOM | Units | Dist |
|---|---|---|---|---|---|---|---|---|
| 2233 Grand Tree Ct Lake Mary, FL | 3.0 | 2.5 | 1781 | $2,595 | $1.46 | 2d | 1 | 0.23mi |
| 625 Remington Oak Dr Lake Mary, FL | 2.0 | 2.0 | 1108 | $2,167 | $1.96 | 1d | 1 | 0.24mi |
| 1903 Wizard Ct Longwood, FL | 2.0 | 1.0 | 1020 | $1,750 | $1.72 | 23d | 1 | 0.45mi |
| 828 Shell Ln Longwood, FL | 3.0 | 2.0 | 1412 | $2,275 | $1.61 | 23d | 1 | 0.56mi |
| 837 Shell Ln Longwood, FL | 3.0 | 2.0 | 1596 | $2,475 | $1.55 | 17d | 1 | 0.59mi |
| 544 Tall Oaks Ter Longwood, FL | 3.0 | 2.0 | 1601 | $2,325 | $1.45 | 4d | 1 | 0.61mi |
| 1651 Smokey Oak Way Longwood, FL | 2.0 | 2.5 | 1293 | $1,950 | $1.51 | 23d | 1 | 0.62mi |
| 141 Clyde Ave Longwood, FL | 3.0 | 2.0 | 1589 | $1,995 | $1.26 | 3d | 1 | 0.68mi |
| 356 Amethyst Ct Lake Mary, FL | 3.0 | 2.0 | 1666 | $1,200 | $0.72 | 12d | 1 | 0.83mi |
| 542 Queensbridge Dr Lake Mary, FL | 3.0 | 2.0 | 1408 | $2,395 | $1.70 | 23d | 1 | 0.86mi |
| 650 Whittingham Pl Lake Mary, FL | 4.0 | 2.5 | 1640 | $3,100 | $1.89 | 10d | 1 | 0.95mi |
| 797 Minerva Ln Lake Mary, FL | 3.0 | 2.0 | 1518 | $2,345 | $1.54 | 3d | 1 | 1.03mi |
| 901 Beresford Way Lake Mary, FL | 3.0 | 2.0 | 1389 | $2,495 | $1.80 | 12d | 1 | 1.07mi |
| 600 Birgham Pl Lake Mary, FL | 3.0 | 2.0 | 1544 | $2,490 | $1.61 | 4d | 1 | 1.08mi |
| 726 Birgham Pl Lake Mary, FL | 3.0 | 2.0 | 1518 | $1,995 | $1.31 | 14d | 1 | 1.15mi |
| 2504 Grassy Point Dr #214 Lake Mary, FL | 2.0 | 2.0 | 899 | $1,495 | $1.66 | 14d | 1 | 1.26mi |
| 2504 Grassy Point Dr #204 Lake Mary, FL | 2.0 | 2.0 | 899 | $1,895 | $2.11 | 23d | 1 | 1.26mi |
| 291 Ruskin St Lake Mary, FL | 2.0 | 2.0 | 981 | $1,395 | $1.42 | 4d | 1 | 1.27mi |
| 780 Creekwater Ter Lake Mary, FL | 1.0–3.0 | 1.0–2.0 | 957 | $1,930 | $2.02 | 23d | 1 | 1.29mi |
| 2516 Grassy Point Dr #200 Lake Mary, FL | 2.0 | 2.0 | 899 | $2,095 | $2.33 | 23d | 1 | 1.30mi |
| 2520 Grassy Point Dr Lake Mary, FL | 3.0 | 2.0 | 1103 | $1,800 | $1.63 | 23d | 1 | 1.31mi |
| 1011 Lychee Ct Lake Mary, FL | 3.0 | 2.5 | 1612 | $2,800 | $1.74 | 4d | 1 | 1.34mi |
| 474 Wishbone Ln Lake Mary, FL | 3.0 | 2.5 | 1733 | $2,750 | $1.59 | 23d | 1 | 1.35mi |
| 717 Secret Harbor Ln Lake Mary, FL | 2.0 | 2.0 | 954 | $1,599 | $1.68 | 4d | 1 | 1.37mi |
| 727 Sugar Bay Way #205 Lake Mary, FL | 2.0 | 2.0 | 912 | $1,650 | $1.81 | 23d | 1 | 1.40mi |
| 240 Donegal Ave Lake Mary, FL | 4.0 | 2.0 | 1778 | $2,661 | $1.50 | 2d | 1 | 1.42mi |
| 296 Morning Glory Dr Lake Mary, FL | 4.0 | 2.0 | 1553 | $2,445 | $1.57 | 2d | 1 | 1.42mi |
| 729 Secret Harbor Ln #201 Lake Mary, FL | 2.0 | 2.0 | 947 | $1,700 | $1.80 | 23d | 1 | 1.42mi |
| 252 Wheelhouse Ln Lake Mary, FL | 3.0 | 1.0–2.0 | 1043 | $3,237 | $3.10 | 1d | 12 | 1.43mi |
| 420 Sun Lake Cir Lake Mary, FL | 1.0–3.0 | 1.0–2.0 | 949 | $2,290 | $2.41 | 2d | 17 | 1.48mi |
| 714 Eagle Ave Longwood, FL | 3.0 | 2.0 | 1266 | $2,285 | $1.80 | 23d | 1 | 1.49mi |
Listing history 3 events
-
2026-06-18days on market $5,000 Active 2 DOM
-
2026-06-17remarks 299-char remark
-
2026-06-17$5,000 Active 1 DOM
ⓘ Source: listings_history table (triggers on properties + properties_extension) + one-shot
backfill from property_details.listing_events for pre-trigger history.
Climate risk First Street
- Flood 1/10 Low FEMA zone X (unshaded) · 0% chance over 30 yrs
- Wildfire 3/10 Moderate
- Heat 8/10 Severe 7 d/yr ≥107°F today · 22 d/yr by 30 yrs out
- Wind 9/10 Extreme 99% chance of damaging wind over 30 yrs
- Air quality 2/10 Low 1 unhealthy d/yr today · 2 by 30 yrs out
Nearby sold comps map
Loading sold comps map…
Walkable amenities ~0.75 mi
Loading nearby amenities…
Taxation est. · year 1
- Rental income
- $27,749
- − Mortgage interest
- −$20,670
- − Property taxes
- −$5,535
- − Insurance
- −$1,845
- − Repairs & maintenance
- −$2,220
- − Management
- −$2,220
- − Depreciation
- −$10,735
- Taxable loss
- −$15,475
- Est. tax savings @ 24.0%
- +$3,714
- After-tax cash flow
- $-4,965/yr
For passive investors: Depreciation is non-cash, so a rental often shows a tax loss while cash-flowing — sheltering income. Rental losses are passive: they offset passive income freely, and up to $25,000/yr can offset ordinary (W-2) income if you actively participate and your MAGI is under $100k (phasing out to $0 by $150k); unused losses carry forward. On sale, claimed depreciation is recaptured at up to 25%, and gains may owe capital-gains tax (a 1031 exchange can defer both). Figures are a year-1 estimate at your 24.0% rate — not tax advice; consult a CPA.
Schools (NCES district)
- District
- Seminole
- NCES district ID
- 1201710
- Math proficiency
- 57% ▼ -7.00%
- Reading proficiency
- 61% ▼ -1.00%
- Median HH income
- $58,478
- Composite
- 51.05/100
- National rank
- #1769
- State rank
- #13 of 73 in FL
Livability — Lake Mary
- Score
- 80/100
- State rank
- #128
- US rank
- #1923
Category grades
Schools grade is shown separately in the Schools card above.
Census & demographics
- County
- Seminole County · 436,154 people
- City population
- 46,684
- Metro
- Orlando-Kissimmee-Sanford, FL
- Population (ZIP)
- 46,684
- Household income
- $104,775
- Rent vs Own
- Severe rent burden
- 1929.0
Population outlook (Seminole County) Hauer SSP2
- Today (2025)
- 515,494 people
- By 2030
- 545,713 · +5.9%
- By 2040
- 598,068 · +16.0%
- By 2050
- 640,663 · +24.3%
- By 2075
- 724,461 · +40.5%
- By 2100
- 755,530 · +46.6%
Race, ethnicity, and origin ACS 2023
- Neighborhood character
- Diverse neighborhood (Simpson 0.55)
- Race & ethnicity
- White 64% Hispanic / Latino 17% Two or more races 11% Asian 9% Black 7%
- Hispanic origin (detail)
- Puerto Rican 7% Cuban 2% Dominican 2%
- Common ancestry
- Romanian 3% Italian 2% Lithuanian 2%
- Foreign-born
- 18% · Canada, Jamaica, China
- Languages at home
- 77% English-only · Spanish 12% Other Indo-European 5% Other Asian/Pacific 1%
Political lean MEDSL · Seminole
- 2024 margin
- Toss-up / Even · D 47.6% · R 51.1% · Other 1.3%
- 2008→2024 swing
- -0.8pp no change · 2008: -2.8pp · 2024: -3.5pp
- All cycles
- 2024: R+3.5 2020: D+2.8 2016: R+1.6 2012: R+6.5 2008: R+2.8
Not yet ingested
- Civics
- —
Market trends
- HPI YoY
- ▼ -77.09%
- Current HPI
- 274.7765
- Rent YoY
- ▲ 1.00%
- Metro
- Orlando-Kissimmee-Sanford, FL
- State GDP YoY
- ▲ 3.28%
- F500 in state
- 36
Industry mix (Fortune 500 HQ in FL)
| Industry | F500 HQs | Revenue |
|---|---|---|
| Industrial Technology | 2 | $29B |
|
||
| Insurance | 2 | $17B |
|
||
| Retail | 1 | $60B |
|
||
| Technology Distribution | 1 | $58B |
|
||
| Homebuilding | 1 | $35B |
|
||
| Technology Manufacturing | 1 | $35B |
|
||
Price history
-99.5% since first listed3 events — show timeline
- 2026-06-16 Listed $5,000 HAOR as distributed by MLS GRID
- 1998-11-13 Sold (Public Records) $98,900 Public Records
- 1989-04-01 Sold (Public Records) $923,900 Public Records
Property tax history
+8.1%/yrLatest (2025): $4,354 · +1.4% YoY. Source: county tax records.
Cash-flow waterfall
monthlySold comps — $/sqft
last 12 mo · ≤1 miLoading sold comps…