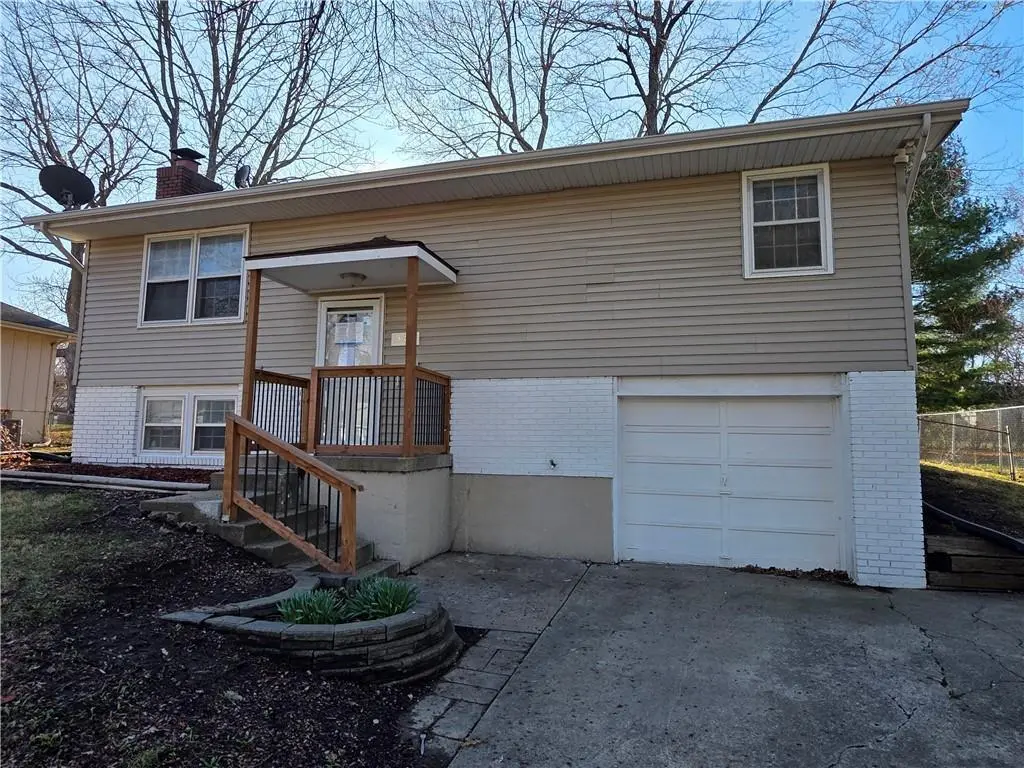
13420 Belmeade Ave · Grandview, MO
Flood risk 3/10 · Minor
- FEMA flood zone
- X (unshaded)
- Chance of flooding over 30 yrs
- 0.2%
- Est. flood insurance / yr
- $473 – $860
Fire risk 1/10 · Minimal
- Est. fire insurance / yr
- $1,054 – $1,958
Heat risk 4/10 · Minor
- Hot days now (above 107°F)
- 7 days/yr
- Hot days in 30 yrs
- 17 days/yr
Wind risk 2/10 · Minimal
- Chance of severe wind over 30 yrs
- —
Air-quality risk 3/10 · Minor
- Unhealthy air days now
- 3 days/yr
- Unhealthy air days in 30 yrs
- 3 days/yr
Risk factors via First Street. Map © Google.
Why this score? — see what drove the C grade
The composite is a weighted blend of 9 inputs, each scored 0–100. Each bar is that input's sub-score; the figure is the points it added to the 100-point composite (weight × sub-score).
- Cash flow +19.3/30.0
- ARV discount +15.0/15.0
- DSCR +6.1/10.0
- 1% rule +4.8/10.0
- Rent growth +4.0/5.0
- Livability +3.1/5.0
- Condition / age +2.5/5.0
- Schools +2.1/10.0
- Appreciation +0.0/10.0
$193,200
🖨 Deal sheet (PDF) 📄 Offer letter ✓ Due diligence
Listing remarks MLS
Fantastic find, gleaming hardwoods, fireplace in living room, family room addition on back of home, combination kitchen and dining room, oversized 1 car garage, 2 full updated baths, convenient location large lot with mature trees, private deck, storage shed. HUD CASE# 291-639506 Please call me or your Realtor® to schedule an appointment to view this home. HUD Homes are sold “as is”. Ask agent for details and have them submit offer online.
Key facts
- Private deck
- Family room addition
- Storage shed
Tags
Neighborhood map
What this means for you Summary
Snapshot
- This is a 3-bed/1.5-bath single-family listed at $193k.
Deal economics
- At list price, monthly cash flow is $210 ($3k/yr) — positive.
- The deal already cash-flows at list — no discount required.
- To meet the 1% rule (rent ≥ 1% of price), the offer needs to be $189k (2.3% below list).
- Recommended offer: $182k (6.0% below list) — sets the bar for market timing.
- Cap rate 7.6% vs local median 5.0% in Grandview — top-decile yield for the area; either an underpriced asset or a hidden risk that comps aren't pricing in. Stress-test before assuming the spread holds.
Location & tenants
- Location reads 61/100 on livability (#454 in MO) — a middle-class / working-renter tenant base. Strengths: cost of living A+, housing A+; Watch: employment D, crime F, amenities F.
- Grandview C-4 (suburban): math 17% / reading 32% proficiency, ranked #284 of 324 in MO (top 88%) — low school quality limits family demand, transient renter base, plan for 1-2y turnover; 65% free/reduced lunch — lower-income household profile, screen leases tightly.
- Zoned schools: Meadowmere Elem. (math 32% / reading 37%, grade F, #676 of 1,115 statewide, top 66%, 349 students, 66% FRL); Grandview Middle (math 18% / reading 39%, grade F, #303 of 391 statewide, top 78%, 517 students, 68% FRL); Grandview Sr. High (math 15% / reading 41%, grade F, #414 of 521 statewide, top 80%, 1,122 students, 62% FRL) — zoned schools at 65% FRL track the district average.
- Market conditions: Rents rising fast (+6.1%/yr); 120 active listings in the ZIP; 20 comparable units currently listed for rent nearby; rentals at typical pace (median 19d on market — plan ~3-4 weeks tenant-placement turnaround); 4,002 units permitted in Jackson County in 2024 (2,271 in 5+ unit buildings).
- This rent runs 43% of the median local income ($53k/yr) — at the standard rent-burdened threshold; future hikes will face affordability resistance.
Forward outlook
- Local home prices are declining (-3.0%/yr); year-one equity from $1k of loan paydown is wiped out by about $6k of value loss. Plan a longer hold.
- Jackson County population projected at +4% by 2050 — modest demand growth; plan on rents tracking national, not racing it.
Negotiation context
- It's been on market 62 days — a 6% lower offer ($182k) is reasonable based on typical stale-listing flexibility.
- 13 sale attempts since 29y ago; this cycle's ask has dropped $17k (8%) from the opening price — seller is motivated, your offer sets the floor, not the list.
Questions for the listing agent
- It's been on market 62 days. Have you received any prior offers? Is the seller open to a 6% concession, seller financing, or rate buy-down credit?
- Built in 1967 — when were the roof, HVAC, electrical panel, plumbing, and water heater last replaced?
- Why hasn't it sold? Are there any deal-killer items the seller is aware of (foundation, flood, title, zoning, code violations)?
- Is there a deadline driving the sale (1031 exchange, divorce, estate, relocation)? That informs how much negotiation room exists.
- Schools are D-rated, which usually means shorter tenancies and higher turnover. Who's the typical renter profile here, and what's been the actual vacancy rate?
- Crime grade is F in this area — have there been break-ins, vandalism, or insurance claims at this property in the last 3 years? What carrier currently insures it and at what premium?
- What's the average days-on-market for RENTAL listings here right now (not sales)? A rising rental-DOM trend means longer vacancies and softer asking-rent achievability than the comps imply.
- What's the recent tenant-quality profile in this submarket — average credit score on applications, eviction rate, late-payment / NSF rate, and stable-employment percentage? A property-management company in the area should have these aggregated.
- How much new for-sale + rental construction is in the pipeline within 1–3 miles? Heavy new supply typically softens prices + rents 12–24 months out; constrained supply supports both.
Investment metrics
- 1% rule
- 0.98% ✗
- Cap rate
- 7.60%
- Cash-on-cash
- 4.67%
- DSCR
- 1.21
- GRM
- 8.5
CMA / ARV
- ARV (median comp)
- $259,862
- List price
- $193,200
- Delta
- -25.65%
- Verdict
- UNDERPRICED
- Comps
- 20 within 1.0 mi
Show comp detail 12 sales within ~0.75 mi
| Address | Dist | Beds/Ba | Sqft | Sold | Price | $/sf | Match |
|---|---|---|---|---|---|---|---|
| 6700 E 135th St | 0.18mi | 3/1.5 | 1,776 (+4%) | 1mo | $175,000 | $99 | 84 |
| 6105 E 136th St | 0.28mi | 3/2.0 | 1,775 (+4%) | 3mo | $285,000 | $161 | 75 |
| 6712 E 134th St | 0.26mi | 3/2.0 | 1,844 (+8%) | 2mo | $289,500 | $157 | 71 |
| 13218 Craig Ave | 0.27mi | 3/2.0 | 1,554 (-9%) | 1mo | $215,000 | $138 | 70 |
| 13804 Bennington Ave | 0.49mi | 3/2.5 | 1,688 (-1%) | 4mo | $260,000 | $154 | 69 |
| 13413 Lowell Ave | 0.04mi | 4/3.0 (+1) | 1,944 (+14%) | 2mo | $300,000 | $154 | 62 |
| 13205 Bristol Ave | 0.43mi | 3/3.0 | 1,580 (-7%) | 0mo | $260,000 | $165 | 62 |
| 13213 Winchester Ave | 0.36mi | 3/2.0 | 1,920 (+13%) | 1mo | $223,900 | $117 | 59 |
| 13112 Winchester Ave | 0.44mi | 3/1.5 | 1,500 (-12%) | 1mo | $165,000 | $110 | 59 |
| 13001 Bristol Ave | 0.72mi | 3/2.5 | 1,835 (+8%) | 1mo | $275,000 | $150 | 49 |
| 13747 Parker Ave | 0.51mi | 4/2.5 (+1) | 1,864 (+9%) | 4mo | $280,000 | $150 | 48 |
| 6905 E 129th St | 0.74mi | 3/2.5 | 1,545 (-9%) | 1mo | $250,000 | $162 | 45 |
Match score weights: distance 35% · size 25% · config 20% · recency 20%. Top-matched comps best support the ARV.
Projected returns pro-forma
-3.0% appreciation · 6.1% rent growth · sell at horizon
- IRR
- -5.7%
- Equity multiple
- 0.78×
- Total profit
- $-11,836
- Equity at exit
- $28,807
- IRR
- 7.2%
- Equity multiple
- 1.62×
- Total profit
- $33,490
- Equity at exit
- $16,704
Cash invested: $54,096 (down + closing). Projections, not guarantees.
Landlord ↔ Tenant lean methodology
- Overall (STATE)
- 81 Strongly Landlord-Friendly
- State Missouri
- 81 Strongly Landlord-Friendly · R+10
- County
- — inherits STATE
- City
- — inherits STATE
ZIP-level market 64030
- Home prices YoY
- -30.7%
- Rents YoY
- 6.1%
- Active inventory
- 120
- Price-to-rent
- 8.5×
Monthly cashflow live
- Estimated rent
- $1,888 high interval (Pro) →
- Mortgage (P&I)
- −$1,013
- Tax from tax record
- −$188 /mo · $2,250/yr
- Insurance
- −$80
- HOA
- −$0
- Vacancy / Maint / Mgmt
- −$397
- Net cashflow
- $210
Break-even live
Sensitivity live
| Price | -10% $320 | -5% $265 | +0% $210 | +5% $156 | +10% $101 |
|---|---|---|---|---|---|
| Rent | -10% $61 | -5% $136 | +0% $210 | +5% $285 | +10% $360 |
| Rate | -1.0pp $308 | -0.5pp $260 | base $210 | +0.5pp $160 | +1.0pp $109 |
UW: 25.0% down · 7.5% · 30yr · 1.5% tax · 5.0% vac · 8.0% maint · 8.0% mgmt
Financing live
Cash to close
- Down payment
- $48,300
- Closing costs
- $5,796
- Reserves months
- —
- Total cash needed
- —
Loan-product check · same deal, 3 products live
Conventional
25% down · 7.5% · 30yr
- Down + closing
- —
- Monthly P&I
- —
- Monthly cashflow
- —
- DSCR
- —
- Eligible?
- —
Personal DTI + credit; lowest rate.
DSCR
20% down · 8.5% · 30yr
- Down + closing
- —
- Monthly P&I
- —
- Monthly cashflow
- —
- DSCR
- —
- Eligible?
- —
No personal income docs; deal must DSCR.
Hard money
10% down · 12.0% · 12mo
- Down + closing
- —
- Monthly P&I
- —
- Monthly cashflow
- —
- DSCR
- —
- Eligible?
- —
Short-term bridge; refi at stabilization.
Rent comps 20 comps
| Address | Beds | Baths | Sqft | Rent | $/sqft | DOM | Units | Dist |
|---|---|---|---|---|---|---|---|---|
| 5940 E 136th St Grandview, MO | 4.0 | 2.0 | 1897 | $1,575 | $0.83 | 25d | 1 | 0.30mi |
| 6003 E 133rd St Grandview, MO | 4.0 | 2.5 | 1560 | $1,990 | $1.28 | 13d | 1 | 0.31mi |
| 6501 E 137th St Grandview, MO | 4.0 | 3.0 | 1469 | $2,135 | $1.45 | 45d | 1 | 0.31mi |
| 6505 Yorkshire Ct Grandview, MO | 3.0 | 2.0 | 1697 | $2,090 | $1.23 | 5d | 1 | 0.33mi |
| 13206 15th St Grandview, MO | 3.0 | 2.0 | 1204 | $1,735 | $1.44 | 22d | 1 | 0.59mi |
| 7002 E 140th Ter Grandview, MO | 3.0 | 2.0 | 2095 | $2,321 | $1.11 | 5d | 1 | 0.69mi |
| 7502 E 132nd Ter Grandview, MO | 3.0 | 2.0 | 1754 | $2,135 | $1.22 | 25d | 1 | 0.74mi |
| 14011 Dunbar Ct Grandview, MO | 3.0 | 3.0 | 1750 | $1,725 | $0.99 | 5d | 1 | 0.77mi |
| 13701 11th Ter Grandview, MO | 4.0 | 2.0 | 1900 | $1,940 | $1.02 | 45d | 1 | 0.82mi |
| 13915 Grandboro Ln Grandview, MO | 4.0 | 2.5 | 1515 | $1,895 | $1.25 | 3d | 1 | 1.03mi |
| 13915 Grandboro Ln Grandview, MO | 4.0 | 2.5 | 1515 | $1,895 | $1.25 | 4d | 1 | 1.03mi |
| 1325 Duck Rd Grandview, MO | 3.0 | 1.5 | 1480 | $1,600 | $1.08 | 45d | 1 | 1.09mi |
| 8011 E 130th Ct Unit 1 Grandview, MO | 3.0 | 1.5 | 1160 | $1,600 | $1.38 | 18d | 1 | 1.10mi |
| 13100 Sycamore Ave Grandview, MO | 3.0 | 2.0 | 1056 | $1,775 | $1.68 | 45d | 1 | 1.12mi |
| 13144 Ashland Ave Grandview, MO | 3.0 | 2.0 | 1056 | $1,706 | $1.62 | 45d | 1 | 1.13mi |
| 14411 Craig Ave Grandview, MO | 3.0 | 2.5 | 1284 | $1,891 | $1.47 | 25d | 1 | 1.21mi |
| 7508 E 127th Pl Grandview, MO | 3.0 | 2.0 | 1396 | $1,945 | $1.39 | 3d | 1 | 1.23mi |
| 14412 Wilshire Cir Grandview, MO | 3.0 | 3.0 | 2040 | $2,205 | $1.08 | 14d | 1 | 1.23mi |
| 13718 Cypress Ave Grandview, MO | 3.0 | 1.0 | 1050 | $1,445 | $1.38 | 9d | 1 | 1.26mi |
| 12712 7th St Grandview, MO | 3.0 | 2.0 | 1050 | $1,545 | $1.47 | 14d | 1 | 1.38mi |
Listing history 50 events
-
2026-06-21days on market $193,200 Active 62 DOM
-
2026-06-18days on market $193,200 Active 59 DOM
-
2026-06-17days on market $193,200 Active 58 DOM
-
2026-06-16days on market $193,200 Active 57 DOM
-
2026-06-15days on market $193,200 Active 56 DOM
-
2026-06-13days on market $193,200 Active 54 DOM
-
2026-06-13days on market $193,200 Active 53 DOM
-
2026-06-09days on market $193,200 Active 50 DOM
-
2026-06-08days on market $193,200 Active 49 DOM
-
2026-06-07days on market $193,200 Active 48 DOM
-
2026-06-03days on market $193,200 Active 44 DOM
-
2026-06-02pricedays on market $193,200 Active 43 DOM
-
2026-06-01days on market $210,000 Active 42 DOM
-
2026-05-31days on market $210,000 Active 41 DOM
-
2026-05-15status Active 459-char remark
Show marketing remark (459 chars)
Fantastic find, gleaming hardwoods, fireplace in living room, family room addition on back of home, combination kitchen and dining room, oversized 1 car garage, 2 full updated baths, convenient location large lot with mature trees, private deck, storage shed. HUD CASE# 291-639506 Please call me or your Realtor® to schedule an appointment to view this home. HUD Homes are sold “as is”. Ask agent for details and have them submit offer online.
-
2026-05-12status Pending 459-char remark
Show marketing remark (459 chars)
Fantastic find, gleaming hardwoods, fireplace in living room, family room addition on back of home, combination kitchen and dining room, oversized 1 car garage, 2 full updated baths, convenient location large lot with mature trees, private deck, storage shed. HUD CASE# 291-639506 Please call me or your Realtor® to schedule an appointment to view this home. HUD Homes are sold “as is”. Ask agent for details and have them submit offer online.
-
2026-05-02status Active 459-char remark
Show marketing remark (459 chars)
Fantastic find, gleaming hardwoods, fireplace in living room, family room addition on back of home, combination kitchen and dining room, oversized 1 car garage, 2 full updated baths, convenient location large lot with mature trees, private deck, storage shed. HUD CASE# 291-639506 Please call me or your Realtor® to schedule an appointment to view this home. HUD Homes are sold “as is”. Ask agent for details and have them submit offer online.
-
2026-04-02status Pending 459-char remark
Show marketing remark (459 chars)
Fantastic find, gleaming hardwoods, fireplace in living room, family room addition on back of home, combination kitchen and dining room, oversized 1 car garage, 2 full updated baths, convenient location large lot with mature trees, private deck, storage shed. HUD CASE# 291-639506 Please call me or your Realtor® to schedule an appointment to view this home. HUD Homes are sold “as is”. Ask agent for details and have them submit offer online.
-
2026-03-18$210,000 Active 459-char remark
Show marketing remark (459 chars)
Fantastic find, gleaming hardwoods, fireplace in living room, family room addition on back of home, combination kitchen and dining room, oversized 1 car garage, 2 full updated baths, convenient location large lot with mature trees, private deck, storage shed. HUD CASE# 291-639506 Please call me or your Realtor® to schedule an appointment to view this home. HUD Homes are sold “as is”. Ask agent for details and have them submit offer online.
-
2025-11-04$209,000 Active
-
2024-09-23historical
-
2024-08-21price $219,000
-
2024-08-02$225,000 Active
-
2024-03-13soldstatus
-
2024-03-11soldstatus Closed
-
2024-02-05status Pending
-
2024-01-28status Active
-
2024-01-15historical Active Under Contract
-
2024-01-04price $219,900
-
2023-12-29price $229,800
-
2023-11-30price $229,900
-
2023-11-03$239,900 Active
-
2023-09-14soldstatus
-
2023-09-08soldstatus Closed
-
2023-08-21status Pending
-
2023-08-16price $145,000
-
2023-08-16status Active
-
2023-08-08status Pending
-
2023-07-31price $192,500
-
2023-07-18price $197,500
-
2023-07-08$205,000 Active
-
2023-03-31historical
-
2023-01-11$190,000 Active
-
2023-01-10historical
-
2023-01-05$190,000 Active
-
2016-10-18soldstatus
-
2005-04-25soldstatus
-
2005-04-21soldstatus
-
2004-11-04$104,950
-
2004-09-23soldstatus
ⓘ Source: listings_history table (triggers on properties + properties_extension) + one-shot
backfill from property_details.listing_events for pre-trigger history.
Tax reassessment forecast MO · Resets to sale price
- Current annual tax
- $2,250 · $188/mo
- Projected year-2 tax
- $2,250 · $188/mo
- Expected delta
- $0/yr ($0/mo · 0.0%)
ⓘ Screening estimate from a state-policy table — verify with the county assessor before closing.
Climate risk First Street
- Flood 3/10 Moderate FEMA zone X (unshaded) · 20% chance over 30 yrs
- Wildfire 1/10 Low
- Heat 4/10 Moderate 7 d/yr ≥107°F today · 17 d/yr by 30 yrs out
- Wind 2/10 Low
- Air quality 3/10 Moderate 3 unhealthy d/yr today · 3 by 30 yrs out
Nearby sold comps map
Loading sold comps map…
Walkable amenities ~0.75 mi
Loading nearby amenities…
Taxation est. · year 1
- Rental income
- $22,657
- − Mortgage interest
- −$10,822
- − Property taxes
- −$2,250
- − Insurance
- −$966
- − Repairs & maintenance
- −$1,813
- − Management
- −$1,813
- − Depreciation
- −$5,620
- Taxable loss
- −$626
- Est. tax savings @ 24.0%
- +$150
- After-tax cash flow
- $2,676/yr
For passive investors: Depreciation is non-cash, so a rental often shows a tax loss while cash-flowing — sheltering income. Rental losses are passive: they offset passive income freely, and up to $25,000/yr can offset ordinary (W-2) income if you actively participate and your MAGI is under $100k (phasing out to $0 by $150k); unused losses carry forward. On sale, claimed depreciation is recaptured at up to 25%, and gains may owe capital-gains tax (a 1031 exchange can defer both). Figures are a year-1 estimate at your 24.0% rate — not tax advice; consult a CPA.
Schools (NCES district)
- District
- Grandview C-4
- NCES district ID
- 2913140
- Math proficiency
- 17% ▼ -12.00%
- Reading proficiency
- 32% ▼ -3.00%
- Median HH income
- $48,934
- Composite
- 21.49/100
- National rank
- #8326
- State rank
- #284 of 324 in MO
Livability — Grandview
- Score
- 61/100
- State rank
- #454
- US rank
- #18350
Category grades
Schools grade is shown separately in the Schools card above.
Census & demographics
- Census place
- Grandview, MO
- County
- Jackson County · 687,798 people
- City population
- 26,422
- Metro
- Kansas City, MO-KS
- Population (ZIP)
- 26,422
- Household income
- $53,216
- Rent vs Own
- Severe rent burden
- 1449.0
Population outlook (Jackson County) Hauer SSP2
- Today (2025)
- 719,589 people
- By 2030
- 731,456 · +1.6%
- By 2040
- 746,689 · +3.8%
- By 2050
- 749,289 · +4.1%
- By 2075
- 736,227 · +2.3%
- By 2100
- 668,210 · -7.1%
Race, ethnicity, and origin ACS 2023
- Neighborhood character
- Diverse neighborhood (Simpson 0.68)
- Race & ethnicity
- White 44% Black 33% Hispanic / Latino 14% Two or more races 7% Asian 3%
- Hispanic origin (detail)
- Mexican 8%
- Common ancestry
- Lithuanian 1% Romanian 1% Slovak 1%
- Foreign-born
- 9% · Canada, South Korea
- Languages at home
- 86% English-only · Spanish 11% Korean 1% Arabic 1%
Political lean MEDSL · Jackson
- 2024 margin
- D (+19.3) · D 58.9% · R 39.5% · Other 1.6%
- 2008→2024 swing
- -6.1pp toward R · 2008: 25.4pp · 2024: 19.3pp
- All cycles
- 2024: D+19.3 2020: D+22.0 2016: D+16.6 2012: D+19.0 2008: D+25.4
Not yet ingested
- Civics
- —
Market trends
- HPI YoY
- ▼ -142.24%
- Current HPI
- 321.6905
- Rent YoY
- ▲ 6.10%
- Metro
- Kansas City, MO-KS
- State GDP YoY
- ▲ 1.84%
- F500 in state
- 20
Industry mix (Fortune 500 HQ in MO)
| Industry | F500 HQs | Revenue |
|---|---|---|
| Healthcare | 1 | $163B |
|
||
| Insurance | 1 | $21B |
|
||
| Industrial Technology | 1 | $17B |
|
||
| Retail | 1 | $16B |
|
||
| Industrial Distribution | 1 | $10B |
|
||
| Utilities | 1 | $9B |
|
||
Price history
+225.6% since first listed40 events — show timeline
- 2026-05-15 Relisted — Heartland MLS as Distributed by MLS Grid
- 2026-05-12 Pending — Heartland MLS as Distributed by MLS Grid
- 2026-05-02 Relisted — Heartland MLS as Distributed by MLS Grid
- 2026-04-02 Pending — Heartland MLS as Distributed by MLS Grid
- 2026-03-18 Listed $210,000 Heartland MLS as Distributed by MLS Grid
- 2025-11-04 Listed $209,000 MARIS as Distributed by MLS Grid
- 2024-09-23 Listing Removed — Heartland MLS as Distributed by MLS Grid
- 2024-08-21 Price Changed $219,000 Heartland MLS as Distributed by MLS Grid
- 2024-08-02 Listed $225,000 Heartland MLS as Distributed by MLS Grid
- 2024-03-13 Sold (Public Records) — Public Records
- 2024-03-11 Sold (MLS) — Heartland MLS as Distributed by MLS Grid
- 2024-02-05 Pending — Heartland MLS as Distributed by MLS Grid
- 2024-01-28 Relisted — Heartland MLS as Distributed by MLS Grid
- 2024-01-15 Contingent — Heartland MLS as Distributed by MLS Grid
- 2024-01-04 Price Changed $219,900 Heartland MLS as Distributed by MLS Grid
- 2023-12-29 Price Changed $229,800 Heartland MLS as Distributed by MLS Grid
- 2023-11-30 Price Changed $229,900 Heartland MLS as Distributed by MLS Grid
- 2023-11-03 Listed $239,900 Heartland MLS as Distributed by MLS Grid
- 2023-09-14 Sold (Public Records) — Public Records
- 2023-09-08 Sold (MLS) — Heartland MLS as Distributed by MLS Grid
- 2023-08-21 Pending — Heartland MLS as Distributed by MLS Grid
- 2023-08-16 Price Changed $145,000 Heartland MLS as Distributed by MLS Grid
- 2023-08-16 Relisted — Heartland MLS as Distributed by MLS Grid
- 2023-08-08 Pending — Heartland MLS as Distributed by MLS Grid
- 2023-07-31 Price Changed $192,500 Heartland MLS as Distributed by MLS Grid
- 2023-07-18 Price Changed $197,500 Heartland MLS as Distributed by MLS Grid
- 2023-07-08 Listed $205,000 Heartland MLS as Distributed by MLS Grid
- 2023-03-31 Listing Removed — Heartland MLS as Distributed by MLS Grid
- 2023-01-11 Listed $190,000 Heartland MLS as Distributed by MLS Grid
- 2023-01-10 Listing Removed — Heartland MLS as Distributed by MLS Grid
- 2023-01-05 Listed $190,000 Heartland MLS as Distributed by MLS Grid
- 2016-10-18 Sold (Public Records) — Public Records
- 2005-04-25 Sold (Public Records) — Public Records
- 2005-04-21 Sold (MLS) — Heartland MLS as Distributed by MLS Grid
- 2004-11-04 Listed $104,950 Heartland MLS as Distributed by MLS Grid
- 2004-09-23 Sold (Public Records) — Public Records
- 1997-06-26 Sold (Public Records) — Public Records
- 1997-06-26 Sold (MLS) — Heartland MLS as Distributed by MLS Grid
- 1997-05-07 Listed $64,500 Heartland MLS as Distributed by MLS Grid
- 1984-06-01 Sold (Public Records) — Public Records
Property tax history
+6.5%/yrLatest (2025): $2,250 · -12.3% YoY. Source: county tax records.
Cash-flow waterfall
monthlySold comps — $/sqft
last 12 mo · ≤1 miLoading sold comps…