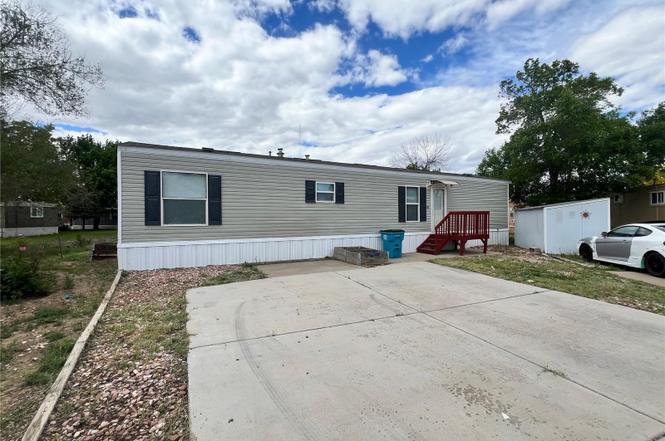
2700 W C St · Greeley, CO
Flood risk 1/10 · Minimal
- FEMA flood zone
- X (unshaded)
- Chance of flooding over 30 yrs
- 0.0%
- Est. flood insurance / yr
- $507 – $1,088
Fire risk 2/10 · Minimal
- Est. fire insurance / yr
- $939 – $1,743
Heat risk 3/10 · Minor
- Hot days now (above 94°F)
- 7 days/yr
- Hot days in 30 yrs
- 19 days/yr
Wind risk 2/10 · Minimal
- Chance of severe wind over 30 yrs
- —
Air-quality risk 4/10 · Minor
- Unhealthy air days now
- 5 days/yr
- Unhealthy air days in 30 yrs
- 5 days/yr
Risk factors via First Street. Map © Google.
Why this score? — see what drove the C+ grade
The composite is a weighted blend of 9 inputs, each scored 0–100. Each bar is that input's sub-score; the figure is the points it added to the 100-point composite (weight × sub-score).
- Cash flow +30.0/30.0
- 1% rule +10.0/10.0
- DSCR +10.0/10.0
- Livability +3.4/5.0
- Condition / age +2.5/5.0
- Rent growth +2.3/5.0
- Schools +2.0/10.0
- ARV discount +0.9/15.0
- Appreciation +0.0/10.0
$81,600
🖨 Deal sheet 📄 Offer letter ✓ Due diligence
Key facts
- Swimming pool
- Playground
- Built 2025
Tags
Property features AI
Finance
- Financial info: List price $81,600
Exterior
- Utilities: Natural gas and central air available
- Home design: Spec home, Plan 87018; Active status
- Exterior features: Located at 2700 W C St, Greeley, CO 80631
Interior
- Bedrooms: 3 bedrooms
- Bathrooms: 2 full bathrooms
- Heating & cooling: Natural gas heating; Central air conditioning
- Interior features: Living area of 1,248
Neighborhood map
What this means for you Summary
Snapshot
- This is a 3-bed/2.0-bath manufactured listed at $82k.
Deal economics
- At list price, monthly cash flow is $672 ($8k/yr) — positive.
- The deal already cash-flows at list — no discount required.
- Meets the 1% rule at list price ($2k rent vs $82k).
- Recommended offer: $72k (12.0% below list) — sets the bar for market timing.
- Cap rate 16.2% vs local median 3.3% in Greeley — top-decile yield for the area; either an underpriced asset or a hidden risk that comps aren't pricing in. Stress-test before assuming the spread holds.
Location & tenants
- Location reads 68/100 on livability (#115 in CO) — a middle-class / working-renter tenant base. Strengths: commute A+, housing A+, health & safety A; Watch: cost of living C-, schools D, crime F.
- Greeleyschool District No. 6 In The County Of Weld And Sta (urban): math 15% / reading 31% proficiency, ranked #71 of 86 in CO (top 83%) — low school quality limits family demand, transient renter base, plan for 1-2y turnover.
- Market conditions: Rents soft (-0.7%/yr); 180 active listings in the ZIP; 25 comparable units currently listed for rent nearby; rentals at typical pace (median 21d on market — plan ~3-4 weeks tenant-placement turnaround); 3,170 units permitted in Weld County in 2024 (278 in 5+ unit buildings).
- This rent runs 34% of the median local income ($55k/yr) — at the standard rent-burdened threshold; future hikes will face affordability resistance.
Forward outlook
- Local home prices are declining (-3.0%/yr); year-one equity from $564 of loan paydown is wiped out by about $2k of value loss. Plan a longer hold.
- Weld County population projected at +46% by 2050 — long-run rental-demand tailwind backs the buy-and-hold thesis.
- At projected returns (-3.0% appreciation + 0.0% rent growth), your $23k cash investment doubles in ~4 years — after that, you're playing with house money.
Negotiation context
- It's been on market 390 days — a 12% lower offer ($72k) is reasonable based on typical stale-listing flexibility.
Questions for the listing agent
- It's been on market 390 days. Have you received any prior offers? Is the seller open to a 12% concession, seller financing, or rate buy-down credit?
- Why hasn't it sold? Are there any deal-killer items the seller is aware of (foundation, flood, title, zoning, code violations)?
- Is there a deadline driving the sale (1031 exchange, divorce, estate, relocation)? That informs how much negotiation room exists.
- Schools are D-rated, which usually means shorter tenancies and higher turnover. Who's the typical renter profile here, and what's been the actual vacancy rate?
- Crime grade is F in this area — have there been break-ins, vandalism, or insurance claims at this property in the last 3 years? What carrier currently insures it and at what premium?
- What's the average days-on-market for RENTAL listings here right now (not sales)? A rising rental-DOM trend means longer vacancies and softer asking-rent achievability than the comps imply.
- What's the recent tenant-quality profile in this submarket — average credit score on applications, eviction rate, late-payment / NSF rate, and stable-employment percentage? A property-management company in the area should have these aggregated.
- How much new for-sale + rental construction is in the pipeline within 1–3 miles? Heavy new supply typically softens prices + rents 12–24 months out; constrained supply supports both.
Investment metrics
- 1% rule
- 1.92% ✓
- Cap rate
- 16.18%
- Cash-on-cash
- 35.30%
- DSCR
- 2.57
- GRM
- 4.3
CMA / ARV
- ARV (on-the-fly)
- $71,136
- Comps found
- 12
Show comp detail 12 sales within ~0.75 mi
| Address | Dist | Beds/Ba | Sqft | Sold | Price | $/sf | Match |
|---|---|---|---|---|---|---|---|
| 2700 W C St #74 | 0.08mi | 3/2.0 | 1,216 (-3%) | 6mo | $60,000 | $49 | 87 |
| 2700 W C St #88 | 0.11mi | 3/— | 1,216 (-3%) | 7mo | $60,000 | $49 | 85 |
| 2626 W 1st St #329 | 0.24mi | 3/2.0 | 1,216 (-3%) | 2mo | $60,000 | $49 | 83 |
| 200 N 35th Ave #178 | 0.39mi | 3/2.0 | 1,344 (+8%) | 4mo | $115,000 | $86 | 66 |
| 435 N 35th Ave #286 | 0.69mi | 3/2.0 | 1,216 (-3%) | 1mo | $34,000 | $28 | 63 |
| 435 N 35th Ave #468 | 0.69mi | 3/2.0 | 1,216 (-3%) | 2mo | $86,000 | $71 | 62 |
| 200 N 35th Ave #121 | 0.58mi | 3/2.0 | 1,216 (-3%) | 10mo | $65,000 | $53 | 61 |
| 435 N 35th Ave #360 | 0.69mi | 3/2.0 | 1,280 (+3%) | 4mo | $75,000 | $59 | 60 |
| 309 31st Ave #5 | 0.32mi | 3/2.0 | 1,078 (-14%) | 3mo | $255,000 | $237 | 60 |
| 435 N 35th Ave #320 | 0.69mi | 3/2.0 | 1,188 (-5%) | 1mo | $24,500 | $21 | 59 |
| 435 N 35th Ave #309 | 0.69mi | 3/2.0 | 1,280 (+3%) | 6mo | $73,000 | $57 | 58 |
| 431 N 35th Ave #30 | 0.72mi | 3/2.0 | 1,216 (-3%) | 10mo | $103,000 | $85 | 54 |
Match score weights: distance 35% · size 25% · config 20% · recency 20%. Top-matched comps best support the ARV.
Projected returns pro-forma
-3.0% appreciation · 0.0% rent growth · sell at horizon
- IRR
- 27.5%
- Equity multiple
- 2.10×
- Total profit
- $25,023
- Equity at exit
- $12,167
- IRR
- 33.1%
- Equity multiple
- 3.59×
- Total profit
- $59,288
- Equity at exit
- $7,055
Cash invested: $22,848 (down + closing). Projections, not guarantees.
Landlord ↔ Tenant lean methodology
- Overall (STATE)
- 38 Tenant-Leaning
- State Colorado
- 38 Tenant-Leaning · D+4
- County
- — inherits STATE
- City
- — inherits STATE
ZIP-level market 80631
- Rents YoY
- -0.7%
- Active inventory
- 180
- Price-to-rent
- 4.3×
Monthly cashflow live
- Estimated rent
- $1,565 high interval (Pro) →
- Mortgage (P&I)
- −$428
- Tax est. 1.5%
- −$102 /mo · $1,224/yr
- Insurance
- −$34
- HOA
- −$0
- Vacancy / Maint / Mgmt
- −$329
- Net cashflow
- $672
Break-even live
UW: 25.0% down · 7.5% · 30yr · 1.5% tax · 5.0% vac · 8.0% maint · 8.0% mgmt
Financing live
Cash to close
- Down payment
- $20,400
- Closing costs
- $2,448
- Reserves months
- —
- Total cash needed
- —
Loan-product check · same deal, 3 products live
Conventional
25% down · 7.5% · 30yr
- Down + closing
- —
- Monthly P&I
- —
- Monthly cashflow
- —
- DSCR
- —
- Eligible?
- —
Personal DTI + credit; lowest rate.
DSCR
20% down · 8.5% · 30yr
- Down + closing
- —
- Monthly P&I
- —
- Monthly cashflow
- —
- DSCR
- —
- Eligible?
- —
No personal income docs; deal must DSCR.
Hard money
10% down · 12.0% · 12mo
- Down + closing
- —
- Monthly P&I
- —
- Monthly cashflow
- —
- DSCR
- —
- Eligible?
- —
Short-term bridge; refi at stabilization.
Rent comps 25 comps
| Address | Beds | Baths | Sqft | Rent | $/sqft | DOM | Units | Dist |
|---|---|---|---|---|---|---|---|---|
| 3004 W A Street Rd Greeley, CO | 2.0 | 1.0 | 750 | $1,395 | $1.86 | 14d | 8 | 0.29mi |
| 613 N 30th Ave Unit Basement 2br Greeley, CO | 2.0 | 1.0 | 1100 | $800 | $0.73 | 23d | 1 | 0.40mi |
| 705 26th Ave Greeley, CO | 2.0 | 1.0 | 850 | $1,190 | $1.40 | 14d | 1 | 0.67mi |
| 712 27th Ave Greeley, CO | 2.0 | 1.0 | 830 | $1,299 | $1.57 | 23d | 5 | 0.69mi |
| 724 27th Ave Greeley, CO | 3.0 | 2.0 | 1248 | $1,700 | $1.36 | 14d | 1 | 0.72mi |
| 2306 W 7th St Greeley, CO | 3.0 | 1.0 | 897 | $1,850 | $2.06 | 21d | 1 | 0.81mi |
| 3208 W 7th St Greeley, CO | 2.0–3.0 | 1.0–2.0 | 957 | $1,672 | $1.75 | 14d | 5 | 0.84mi |
| 314 18th Ave Greeley, CO | 2.0 | 1.0 | 790 | $1,560 | $1.97 | 14d | 1 | 0.95mi |
| 2004 8th St Unit 1B Greeley, CO | 3.0 | 1.0 | 1200 | $1,875 | $1.56 | 23d | 1 | 1.04mi |
| 821 35th Avenue Ct Greeley, CO | 2.0 | 1.0 | 950 | $1,530 | $1.61 | 14d | 1 | 1.05mi |
| 709 37th Ave Unit 3 Greeley, CO | 2.0 | 1.5 | 1000 | $1,195 | $1.20 | 23d | 1 | 1.07mi |
| 1126 26th Ave Greeley, CO | 2.0 | 1.0 | 909 | $1,335 | $1.47 | 23d | 1 | 1.08mi |
| 808 37th Ave Unit A Greeley, CO | 2.0 | 1.5 | 900 | $1,250 | $1.39 | 23d | 1 | 1.11mi |
| 1213 26th Ave Greeley, CO | 1.0–3.0 | 1.0–2.0 | 745 | $1,596 | $2.14 | 14d | 10 | 1.14mi |
| 804 37th Avenue Ct Unit 4 Greeley, CO | 2.0 | 1.5 | 975 | $995 | $1.02 | 23d | 1 | 1.14mi |
| 1250 28th Ave Greeley, CO | 1.0–2.0 | 1.0 | 788 | $1,370 | $1.74 | 14d | 5 | 1.17mi |
| 1436 5th St Greeley, CO | 3.0 | 1.0 | 1054 | $1,800 | $1.71 | 23d | 1 | 1.20mi |
| 1014 19th Ave Greeley, CO | 3.0 | 1.0 | 1470 | $2,100 | $1.43 | 14d | 1 | 1.25mi |
| 533 14th Ave Unit 9 Greeley, CO | 3.0 | 1.0 | 1197 | $1,395 | $1.17 | 23d | 1 | 1.30mi |
| 423 13th Ave Unit 1/2 Greeley, CO | 2.0 | 1.0 | 864 | $1,150 | $1.33 | 23d | 1 | 1.34mi |
| 3322 W 13th St Greeley, CO | 2.0–3.0 | 1.0–2.0 | 950 | $1,600 | $1.68 | 14d | 2 | 1.38mi |
| 1323 8th St Greeley, CO | 2.0 | 1.0 | 1440 | $2,150 | $1.49 | 14d | 1 | 1.42mi |
| 520 13th Ave Unit 11 Greeley, CO | 2.0 | 1.0 | 800 | $1,195 | $1.49 | 23d | 1 | 1.42mi |
| 1208 18th Ave Greeley, CO | 2.0 | 1.0 | 812 | $1,300 | $1.60 | 14d | 1 | 1.44mi |
| 3950 W 12th St #3 Greeley, CO | 2.0 | 2.0 | 1194 | $2,100 | $1.76 | 23d | 1 | 1.48mi |
Listing history 14 events
-
2026-06-18days on market $81,600 Active 390 DOM
-
2026-06-17days on market $81,600 Active 389 DOM
-
2026-06-16days on market $81,600 Active 388 DOM
-
2026-06-15days on market $81,600 Active 387 DOM
-
2026-06-14days on market $81,600 Active 385 DOM
-
2026-06-10days on market $81,600 Active 382 DOM
-
2026-06-09days on market $81,600 Active 381 DOM
-
2026-06-08days on market $81,600 Active 380 DOM
-
2026-06-07days on market $81,600 Active 379 DOM
-
2026-06-03days on market $81,600 Active 375 DOM
-
2026-06-02days on market $81,600 Active 374 DOM
-
2026-06-01days on market $81,600 Active 373 DOM
-
2026-05-31days on market $81,600 Active 372 DOM
-
2026-05-30days on market $81,600 Active 371 DOM
ⓘ Source: listings_history table (triggers on properties + properties_extension) + one-shot
backfill from property_details.listing_events for pre-trigger history.
Climate risk First Street
- Flood 1/10 Low FEMA zone X (unshaded) · 0% chance over 30 yrs
- Wildfire 2/10 Low
- Heat 3/10 Moderate 7 d/yr ≥94°F today · 19 d/yr by 30 yrs out
- Wind 2/10 Low
- Air quality 4/10 Moderate 5 unhealthy d/yr today · 5 by 30 yrs out
Nearby sold comps map
Loading sold comps map…
Walkable amenities ~0.75 mi
Loading nearby amenities…
Taxation est. · year 1
- Rental income
- $18,775
- − Mortgage interest
- −$4,571
- − Property taxes
- −$1,224
- − Insurance
- −$408
- − Repairs & maintenance
- −$1,502
- − Management
- −$1,502
- − Depreciation
- −$2,374
- Taxable income
- $7,195
- Est. tax owed @ 24.0%
- −$1,727
- After-tax cash flow
- $6,339/yr
For passive investors: Depreciation is non-cash, so a rental often shows a tax loss while cash-flowing — sheltering income. Rental losses are passive: they offset passive income freely, and up to $25,000/yr can offset ordinary (W-2) income if you actively participate and your MAGI is under $100k (phasing out to $0 by $150k); unused losses carry forward. On sale, claimed depreciation is recaptured at up to 25%, and gains may owe capital-gains tax (a 1031 exchange can defer both). Figures are a year-1 estimate at your 24.0% rate — not tax advice; consult a CPA.
Schools (NCES district)
- District
- Greeleyschool District No. 6 In The County Of Weld And Sta
- NCES district ID
- 0804410
- Math proficiency
- 15% ▼ -7.00%
- Reading proficiency
- 31% ▼ -4.00%
- Median HH income
- $46,417
- Composite
- 19.99/100
- National rank
- #8667
- State rank
- #71 of 86 in CO
Livability — Greeley
- Score
- 68/100
- State rank
- #115
- US rank
- #9841
Category grades
Schools grade is shown separately in the Schools card above.
Census & demographics
- Census place
- Greeley, CO
- County
- Weld County · 332,652 people
- City population
- 119,344
- Metro
- Greeley, CO
- Population (ZIP)
- 53,722
- Household income
- $54,591
- Rent vs Own
- Severe rent burden
- 3061.0
Population outlook (Weld County) Hauer SSP2
- Today (2025)
- 351,957 people
- By 2030
- 385,304 · +9.5%
- By 2040
- 451,818 · +28.4%
- By 2050
- 514,478 · +46.2%
- By 2075
- 648,733 · +84.3%
- By 2100
- 720,400 · +104.7%
Race, ethnicity, and origin ACS 2023
- Neighborhood character
- Diverse neighborhood (Simpson 0.55)
- Race & ethnicity
- Hispanic / Latino 54% White 39% Two or more races 15% Black 3% Native American 2% Asian 1%
- Hispanic origin (detail)
- Mexican 45%
- Common ancestry
- Italian 2% Slovak 2% Portuguese 2%
- Foreign-born
- 19% · Canada, Philippines
- Languages at home
- 65% English-only · Spanish 33%
Political lean MEDSL · Weld
- 2024 margin
- Strong R (+21.0) · D 38.2% · R 59.2% · Other 2.6%
- 2008→2024 swing
- -12.2pp toward R · 2008: -8.7pp · 2024: -21.0pp
- All cycles
- 2024: R+21.0 2020: R+18.0 2016: R+22.4 2012: R+13.2 2008: R+8.7
Not yet ingested
- Civics
- —
Market trends
- HPI YoY
- ▼ -329.59%
- Current HPI
- 295.4309
- Rent YoY
- ▼ -0.65%
- Metro
- Greeley, CO
- State GDP YoY
- ▲ 1.95%
- F500 in state
- 14
Industry mix (Fortune 500 HQ in CO)
| Industry | F500 HQs | Revenue |
|---|---|---|
| Technology Distribution | 1 | $31B |
|
||
| Food / Agriculture | 1 | $18B |
|
||
| Packaging | 1 | $14B |
|
||
| Healthcare | 1 | $13B |
|
||
| Energy | 1 | $10B |
|
||
| Technology | 1 | $4B |
|
||
Cash-flow waterfall
monthlySold comps — $/sqft
last 12 mo · ≤1 miLoading sold comps…