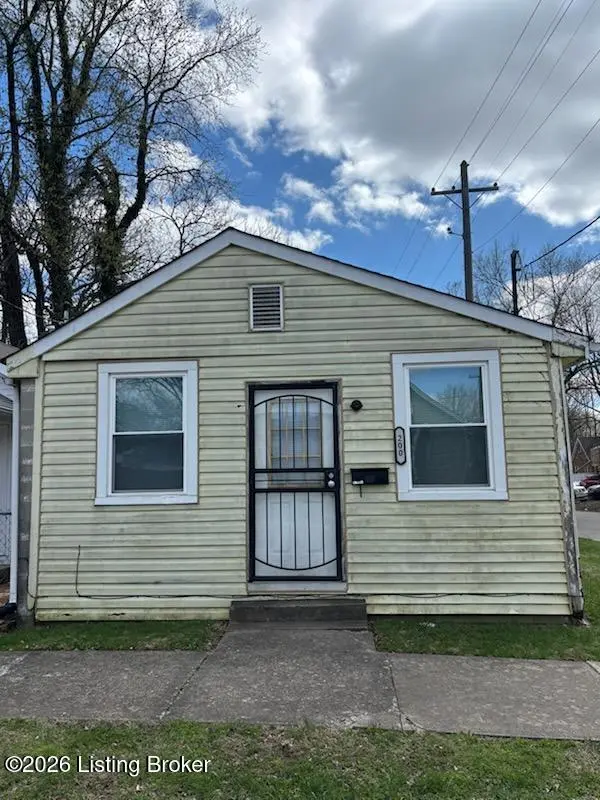
200 Mohawk Ave · Louisville, KY
Flood risk 6/10 · Moderate
- FEMA flood zone
- X (unshaded)
- Chance of flooding over 30 yrs
- 0.69%
- Est. flood insurance / yr
- $507 – $1,088
Fire risk 1/10 · Minimal
- Est. fire insurance / yr
- $839 – $1,559
Heat risk 5/10 · Moderate
- Hot days now (above 105°F)
- 7 days/yr
- Hot days in 30 yrs
- 20 days/yr
Wind risk 2/10 · Minimal
- Chance of severe wind over 30 yrs
- 2.0%
Air-quality risk 2/10 · Minimal
- Unhealthy air days now
- 1 days/yr
- Unhealthy air days in 30 yrs
- 3 days/yr
Risk factors via First Street. Map © Google.
Why this score? — see what drove the B grade
The composite is a weighted blend of 9 inputs, each scored 0–100. Each bar is that input's sub-score; the figure is the points it added to the 100-point composite (weight × sub-score).
- Cash flow +24.4/30.0
- ARV discount +15.0/15.0
- DSCR +7.9/10.0
- Appreciation +7.0/10.0
- 1% rule +5.6/10.0
- Livability +3.2/5.0
- Rent growth +2.5/5.0
- Condition / age +2.5/5.0
- Schools +2.3/10.0
$159,000
🖨 Deal sheet 📄 Offer letter ✓ Due diligence
Listing remarks MLS
SELLING AS-IS. NEEDS COMPLETE REHAB. OWNERS ANXIOUS AND MOTIVATED. BRING OFFER.
Key facts
- 2,744 sq ft lot
- Built 1915
- Listed 69 days
Property features AI
Finance
- Other: Subdivision: HIGHLAND PARK
- HOA & community: No association fee
Exterior
- Utilities: Electricity connected; Natural gas service
- Home design: Single family residence; Camelback architectural style; Two stories; Built in 1915
- Construction: Wood frame construction; Shingle roof; Crawl space foundation
- Exterior features: Chain-link fencing; Cleared and level lot
Interior
- Kitchen: Kitchen on the first floor
- Bedrooms: Four bedrooms total; Two bedrooms on the first floor; Two bedrooms on the second floor; Primary bedroom on the first floor
- Bathrooms: Two full bathrooms
- Heating & cooling: Forced air heating (natural gas); Central air conditioning; One HVAC unit for heating and one for cooling
- Interior features: Six total rooms; Five closets; Basement: None; First-floor laundry
- Laundry & utility: Laundry located on the first floor
Neighborhood map
What this means for you Summary
Snapshot
- This is a 4-bed/2.0-bath single-family listed at $159k.
Deal economics
- At list price, monthly cash flow is $324 ($4k/yr) — positive.
- The deal already cash-flows at list — no discount required.
- Meets the 1% rule at list price ($2k rent vs $159k).
- Recommended offer: $149k (6.0% below list) — sets the bar for market timing.
- Cap rate 8.7% vs local median 5.0% in Louisville — top-decile yield for the area; either an underpriced asset or a hidden risk that comps aren't pricing in. Stress-test before assuming the spread holds.
Location & tenants
- Location reads 63/100 on livability (#333 in KY) — a middle-class / working-renter tenant base. Strengths: cost of living A+, housing A+; Watch: employment C-, health & safety D+, schools D-.
- Jefferson County (urban): math 19% / reading 35% proficiency, ranked #121 of 165 in KY (top 73%) — low school quality limits family demand, transient renter base, plan for 1-2y turnover.
- Market conditions: 3 active listings in the ZIP; 14 comparable units currently listed for rent nearby; rentals at typical pace (median 24d on market — plan ~3-4 weeks tenant-placement turnaround); 2,836 units permitted in Jefferson County in 2024 (1,558 in 5+ unit buildings).
Forward outlook
- In year one you build about $8k of equity ($1k loan paydown + $6k appreciation (4.0% local appreciation)).
- Jefferson County population projected at +13% by 2050 — modest demand growth; plan on rents tracking national, not racing it.
- At projected returns (4.0% appreciation + 3.0% rent growth), your $45k cash investment doubles in ~4 years — after that, you're playing with house money.
- By year 5, paydown + projected appreciation supports a ~$33k cash-out refi (75% LTV) — recoverable capital for the next deal without selling this one.
Negotiation context
- It's been on market 70 days — a 6% lower offer ($149k) is reasonable based on typical stale-listing flexibility.
- 2 sale attempts since 18y ago with the ask held roughly flat each time — persistent listings suggest the price (not the market) is what's stuck; bring a comps-based counter.
- Current owner paid $32k; list at $159k implies a 397% gain — meaningful room to come down on a strong offer.
Risks & watch-outs
- Watch-outs: built in 1915 — expect roof / HVAC / electrical / plumbing capex.
- Climate carrying-cost: major flood risk; extreme-heat days projected 7→20/yr by 2055 (HVAC capex compounding) — expect insurance premiums to compound above CPI over the hold.
Questions for the listing agent
- It's been on market 70 days. Have you received any prior offers? Is the seller open to a 6% concession, seller financing, or rate buy-down credit?
- Built in 1915 — when were the roof, HVAC, electrical panel, plumbing, and water heater last replaced?
- Why hasn't it sold? Are there any deal-killer items the seller is aware of (foundation, flood, title, zoning, code violations)?
- Is there a deadline driving the sale (1031 exchange, divorce, estate, relocation)? That informs how much negotiation room exists.
- Schools are D-rated, which usually means shorter tenancies and higher turnover. Who's the typical renter profile here, and what's been the actual vacancy rate?
- Crime grade is F in this area — have there been break-ins, vandalism, or insurance claims at this property in the last 3 years? What carrier currently insures it and at what premium?
- What's the average days-on-market for RENTAL listings here right now (not sales)? A rising rental-DOM trend means longer vacancies and softer asking-rent achievability than the comps imply.
- What's the recent tenant-quality profile in this submarket — average credit score on applications, eviction rate, late-payment / NSF rate, and stable-employment percentage? A property-management company in the area should have these aggregated.
- How much new for-sale + rental construction is in the pipeline within 1–3 miles? Heavy new supply typically softens prices + rents 12–24 months out; constrained supply supports both.
Investment metrics
- 1% rule
- 1.06% ✓
- Cap rate
- 8.74%
- Cash-on-cash
- 8.74%
- DSCR
- 1.39
- GRM
- 7.8
CMA / ARV
- ARV (on-the-fly)
- $218,550
- Comps found
- 12
Show comp detail 12 sales within ~0.75 mi
| Address | Dist | Beds/Ba | Sqft | Sold | Price | $/sf | Match |
|---|---|---|---|---|---|---|---|
| 4608 S 1st St | 0.35mi | 4/2.0 | 1,638 (+6%) | 5mo | $295,000 | $180 | 70 |
| 4318 S Brook St | 0.41mi | 3/1.0 (-1) | 1,544 (-0%) | 5mo | $160,000 | $104 | 67 |
| 166 Gillette Ave | 0.11mi | 4/1.0 | 1,384 (-11%) | 8mo | $185,000 | $134 | 66 |
| 4513 S 6th St | 0.61mi | 3/2.0 (-1) | 1,581 (+2%) | 5mo | $195,800 | $124 | 59 |
| 102 W Florence Ave | 0.36mi | 3/2.0 (-1) | 1,344 (-13%) | 1mo | $190,000 | $141 | 55 |
| 4106 S Brook St | 0.65mi | 3/2.0 (-1) | 1,474 (-5%) | 5mo | $223,000 | $151 | 52 |
| 7 Hill Top Ct | 0.55mi | 3/2.5 (-1) | 1,480 (-4%) | 11mo | $186,000 | $126 | 51 |
| 4110 S 2nd St | 0.69mi | 4/2.0 | 1,653 (+7%) | 9mo | $240,000 | $145 | 49 |
| 4103 Southern Pkwy | 0.70mi | 3/2.0 (-1) | 1,646 (+6%) | 7mo | $240,000 | $146 | 46 |
| 4344 S 3rd St | 0.50mi | 3/2.0 (-1) | 1,742 (+12%) | 6mo | $172,000 | $99 | 46 |
| 335 W Kenwood Way | 0.65mi | 3/2.0 (-1) | 1,753 (+13%) | 5mo | $224,000 | $128 | 39 |
| 8 Hill Top Ct | 0.56mi | 3/2.0 (-1) | 1,321 (-15%) | 11mo | $240,000 | $182 | 36 |
Match score weights: distance 35% · size 25% · config 20% · recency 20%. Top-matched comps best support the ARV.
Projected returns pro-forma
4.04% appreciation · 3.0% rent growth · sell at horizon
- IRR
- 18.2%
- Equity multiple
- 2.09×
- Total profit
- $48,734
- Equity at exit
- $81,023
- IRR
- 18.8%
- Equity multiple
- 4.01×
- Total profit
- $133,952
- Equity at exit
- $132,847
Cash invested: $44,520 (down + closing). Projections, not guarantees.
Landlord ↔ Tenant lean methodology
- Overall (STATE)
- 83 Strongly Landlord-Friendly
- State Kentucky
- 83 Strongly Landlord-Friendly · R+16
- County
- — inherits STATE
- City
- — inherits STATE
ZIP-level market 40209
- Home prices YoY
- 2.9%
- Active inventory
- 3
- Price-to-rent
- 7.8×
Monthly cashflow live
- Estimated rent
- $1,692 high interval (Pro) →
- Mortgage (P&I)
- −$834
- Tax from tax record
- −$112 /mo · $1,349/yr
- Insurance
- −$66
- HOA
- −$0
- Vacancy / Maint / Mgmt
- −$355
- Net cashflow
- $324
Break-even live
UW: 25.0% down · 7.5% · 30yr · 1.5% tax · 5.0% vac · 8.0% maint · 8.0% mgmt
Financing live
Cash to close
- Down payment
- $39,750
- Closing costs
- $4,770
- Reserves months
- —
- Total cash needed
- —
Loan-product check · same deal, 3 products live
Conventional
25% down · 7.5% · 30yr
- Down + closing
- —
- Monthly P&I
- —
- Monthly cashflow
- —
- DSCR
- —
- Eligible?
- —
Personal DTI + credit; lowest rate.
DSCR
20% down · 8.5% · 30yr
- Down + closing
- —
- Monthly P&I
- —
- Monthly cashflow
- —
- DSCR
- —
- Eligible?
- —
No personal income docs; deal must DSCR.
Hard money
10% down · 12.0% · 12mo
- Down + closing
- —
- Monthly P&I
- —
- Monthly cashflow
- —
- DSCR
- —
- Eligible?
- —
Short-term bridge; refi at stabilization.
Rent comps 14 comps
| Address | Beds | Baths | Sqft | Rent | $/sqft | DOM | Units | Dist |
|---|---|---|---|---|---|---|---|---|
| 4513 S 6th St Louisville, KY | 3.0 | 2.0 | 1581 | $2,650 | $1.68 | 23d | 1 | 0.59mi |
| 4133 S 5th St Louisville, KY | 4.0 | 1.0 | 1200 | $1,435 | $1.20 | 16d | 1 | 0.61mi |
| 4007 Southern Pkwy Unit 1 Louisville, KY | 4.0 | 1.0 | 1500 | $1,395 | $0.93 | 3d | 1 | 0.75mi |
| 5013 Wabash Pl Louisville, KY | 3.0 | 2.0 | 1080 | $1,400 | $1.30 | 23d | 1 | 0.79mi |
| 5033 Wabash Pl Louisville, KY | 3.0 | 1.5 | 1156 | $1,350 | $1.17 | 23d | 1 | 0.82mi |
| 310 W Kenton St Louisville, KY | 3.0 | 2.0 | 1295 | $1,350 | $1.04 | 23d | 1 | 0.84mi |
| 551 Denmark St Louisville, KY | 3.0 | 1.5 | 1160 | $1,700 | $1.47 | 23d | 1 | 0.90mi |
| 3860 Southern Pkwy Louisville, KY | 3.0 | 1.0 | 1064 | $1,250 | $1.17 | 23d | 1 | 0.90mi |
| 910 W Whitney Ave Louisville, KY | 3.0 | 1.0 | 1186 | $1,450 | $1.22 | 11d | 1 | 1.01mi |
| 910 W Whitney Ave Louisville, KY | 3.0 | 1.0 | 1186 | $1,450 | $1.22 | 1d | 1 | 1.01mi |
| 3102 Grant Ave Louisville, KY | 4.0 | 2.0 | 1603 | $1,595 | $1.00 | 23d | 1 | 1.07mi |
| 519 Forum Ave Louisville, KY | 3.0 | 1.5 | 1693 | $1,600 | $0.95 | 23d | 1 | 1.14mi |
| 925 W Evelyn Ave Louisville, KY | 3.0 | 1.5 | 1520 | $1,650 | $1.09 | 23d | 1 | 1.16mi |
| 4010 Taylor Blvd Louisville, KY | 4.0 | 2.0 | 1612 | $3,000 | $1.86 | 16d | 1 | 1.38mi |
Listing history 10 events
-
2026-06-09days on market $159,000 Active 70 DOM
-
2026-06-08days on market $159,000 Active 69 DOM
-
2026-06-07days on market $159,000 Active 68 DOM
-
2026-06-03days on market $159,000 Active 64 DOM
-
2026-06-02days on market $159,000 Active 63 DOM
-
2026-06-01days on market $159,000 Active 62 DOM
-
2026-05-31days on market $159,000 Active 61 DOM
-
2026-03-17$159,000 Active
-
2008-10-24soldstatus $32,000 79-char remark
Show marketing remark (79 chars)
SELLING AS-IS. NEEDS COMPLETE REHAB. OWNERS ANXIOUS AND MOTIVATED. BRING OFFER.
-
2008-07-29$44,950 79-char remark
Show marketing remark (79 chars)
SELLING AS-IS. NEEDS COMPLETE REHAB. OWNERS ANXIOUS AND MOTIVATED. BRING OFFER.
ⓘ Source: listings_history table (triggers on properties + properties_extension) + one-shot
backfill from property_details.listing_events for pre-trigger history.
Tax reassessment forecast KY · Resets to sale price
- Current annual tax
- $1,349 · $112/mo
- Projected year-2 tax
- $1,367 · $114/mo
- Expected delta
- +$18/yr (+$2/mo · 1.4%)
ⓘ Screening estimate from a state-policy table — verify with the county assessor before closing.
Climate risk First Street
- Flood 6/10 Major FEMA zone X (unshaded) · 69% chance over 30 yrs
- Wildfire 1/10 Low
- Heat 5/10 Major 7 d/yr ≥105°F today · 20 d/yr by 30 yrs out
- Wind 2/10 Low 2% chance of damaging wind over 30 yrs
- Air quality 2/10 Low 1 unhealthy d/yr today · 3 by 30 yrs out
Nearby sold comps map
Loading sold comps map…
Walkable amenities ~0.75 mi
Loading nearby amenities…
Taxation est. · year 1
- Rental income
- $20,304
- − Mortgage interest
- −$8,906
- − Property taxes
- −$1,349
- − Insurance
- −$795
- − Repairs & maintenance
- −$1,624
- − Management
- −$1,624
- − Depreciation
- −$4,625
- Taxable income
- $1,380
- Est. tax owed @ 24.0%
- −$331
- After-tax cash flow
- $3,559/yr
For passive investors: Depreciation is non-cash, so a rental often shows a tax loss while cash-flowing — sheltering income. Rental losses are passive: they offset passive income freely, and up to $25,000/yr can offset ordinary (W-2) income if you actively participate and your MAGI is under $100k (phasing out to $0 by $150k); unused losses carry forward. On sale, claimed depreciation is recaptured at up to 25%, and gains may owe capital-gains tax (a 1031 exchange can defer both). Figures are a year-1 estimate at your 24.0% rate — not tax advice; consult a CPA.
Schools (NCES district)
- District
- Jefferson County
- NCES district ID
- 2102990
- Math proficiency
- 19% ▼ -17.00%
- Reading proficiency
- 35% ▼ -11.00%
- Median HH income
- $47,885
- Composite
- 23.45/100
- National rank
- #7884
- State rank
- #121 of 165 in KY
Livability — Louisville
- Score
- 63/100
- State rank
- #333
- US rank
- #15887
Category grades
Schools grade is shown separately in the Schools card above.
Census & demographics
- Census place
- Louisville, KY
- City population
- 769,292
- Population (ZIP)
- 571
Population outlook (Jefferson County) Hauer SSP2
- Today (2025)
- 823,112 people
- By 2030
- 849,343 · +3.2%
- By 2040
- 895,696 · +8.8%
- By 2050
- 933,630 · +13.4%
- By 2075
- 1,028,262 · +24.9%
- By 2100
- 1,072,675 · +30.3%
Race, ethnicity, and origin ACS 2023
- Neighborhood character
- Diverse neighborhood (Simpson 0.66)
- Race & ethnicity
- White 49% Two or more races 34% Hispanic / Latino 33% Black 2%
- Hispanic origin (detail)
- Mexican 15%
- Foreign-born
- 25% · Canada
- Languages at home
- 67% English-only · Spanish 33%
Political lean MEDSL · Jefferson
- 2024 margin
- D (+16.6) · D 57.4% · R 40.9% · Other 1.7%
- 2008→2024 swing
- +4.5pp toward D · 2008: 12.0pp · 2024: 16.6pp
- All cycles
- 2024: D+16.6 2020: D+20.1 2016: D+13.3 2012: D+11.1 2008: D+12.0
Not yet ingested
- Civics
- —
Market trends
- HPI YoY
- ▲ 4.04%
- Current HPI
- 144.1168
- Rent YoY
- —
- Metro
- —
- State GDP YoY
- ▲ 1.81%
- F500 in state
- 4
Industry mix (Fortune 500 HQ in KY)
| Industry | F500 HQs | Revenue |
|---|---|---|
| Healthcare | 1 | $118B |
|
||
| Food / Beverage | 1 | $7B |
|
||
Price history
+253.7% since first listed3 events — show timeline
- 2026-03-17 Listed $159,000 Metro Search MLS
- 2008-10-24 Sold (MLS) $32,000 Metro Search MLS
- 2008-07-29 Listed $44,950 Metro Search MLS
Property tax history
+11.1%/yrLatest (2025): $1,349 · +83.3% YoY. Source: county tax records.
Cash-flow waterfall
monthlySold comps — $/sqft
last 12 mo · ≤1 miLoading sold comps…