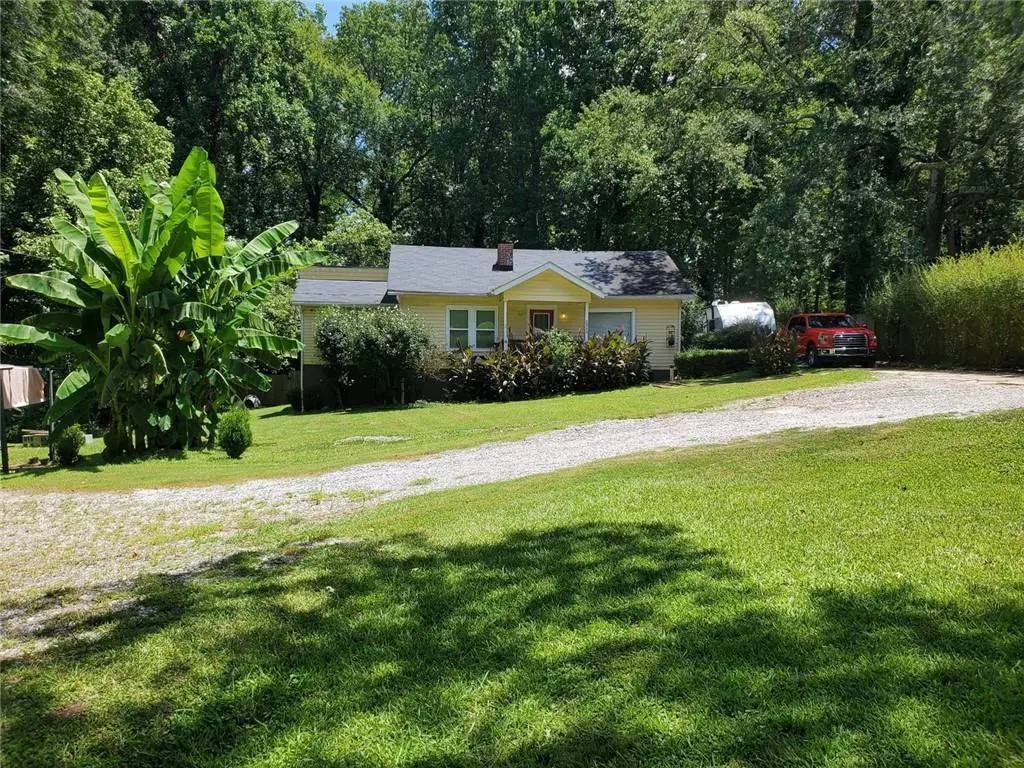
2920 Jonesboro Rd SE · Atlanta, GA
Flood risk 1/10 · Minimal
- FEMA flood zone
- X (unshaded)
- Chance of flooding over 30 yrs
- 0.0%
- Est. flood insurance / yr
- $473 – $860
Fire risk 3/10 · Minor
- Est. fire insurance / yr
- $963 – $1,789
Heat risk 5/10 · Moderate
- Hot days now (above 104°F)
- 7 days/yr
- Hot days in 30 yrs
- 18 days/yr
Wind risk 5/10 · Moderate
- Chance of severe wind over 30 yrs
- 26.0%
Air-quality risk 4/10 · Minor
- Unhealthy air days now
- 4 days/yr
- Unhealthy air days in 30 yrs
- 6 days/yr
Risk factors via First Street. Map © Google.
Why this score? — see what drove the D+ grade
The composite is a weighted blend of 9 inputs, each scored 0–100. Each bar is that input's sub-score; the figure is the points it added to the 100-point composite (weight × sub-score).
- Cash flow +18.1/30.0
- ARV discount +7.5/15.0
- DSCR +5.7/10.0
- 1% rule +4.9/10.0
- Livability +4.2/5.0
- Rent growth +3.9/5.0
- Schools +2.7/10.0
- Condition / age +2.5/5.0
- Appreciation +0.0/10.0
$200,000
🖨 Deal sheet 📄 Offer letter ✓ Due diligence
Listing remarks MLS
This magnificent home is conveniently located near Hartfield Jackson airport and major popular highways. It is priced to sell quickly and move in ready. The owner is extremely motivated and plan to retire so don't hesitate on this amazing bargain. Since the seller is still occupying the property and works from home, please notify 24 hours to view the listing. No signs or lockbox required. This property will not be available for long because of the popular demand.
Key facts
- 0.53 acre lot
- 4 parking spots
- Pool
Property features AI
Finance
- Other: Property located in Fulton County, GA; Road surfaces nearby include concrete, dirt, and gravel; Directions available
- HOA & community: Association fee includes sewer
Exterior
- Parking: Four total parking spaces; On-street parking available; Open parking
- Security: No specific security features listed
- Utilities: Public water; Public sewer; Sewer available; Electricity available; Water available; Phone available
- Home design: One-and-one-half levels; Frame construction; Shingle roof; Other roof material; Slab foundation
- Construction: Built with frame construction
- Exterior features: Front porch; Rear porch; Wood fencing; Fenced pool
Interior
- Kitchen: Kitchen with other features; Dining area with other features; Appliances: other
- Bedrooms: Three main-level bedrooms; Other bedroom features
- Flooring: Carpet; Laminate
- Bathrooms: Two full bathrooms (both on main level); Master bathroom: other features
- Heating & cooling: Central heating; Central air conditioning
- Interior features: One fireplace with brick surround; Partial basement; No shared/common walls; Resale condition; Other interior features
- Laundry & utility: Laundry/utility features not specified
Neighborhood map
What this means for you Summary
Snapshot
- This is a 3-bed/1.0-bath single-family listed at $200k.
Deal economics
- At list price, monthly cash flow is $176 ($2k/yr) — positive.
- The deal already cash-flows at list — no discount required.
- To meet the 1% rule (rent ≥ 1% of price), the offer needs to be $197k (1.4% below list).
- Recommended offer: $194k (3.0% below list) — sets the bar for market timing.
- Cap rate 7.3% vs local median 3.1% in Atlanta — top-decile yield for the area; either an underpriced asset or a hidden risk that comps aren't pricing in. Stress-test before assuming the spread holds.
Location & tenants
- Location reads 83/100 on livability (#6 in GA, #919 nationally) — a professional / high-income tenant draw. Strengths: amenities A+, commute A+, housing A+; Watch: cost of living C-.
- Atlanta Public Schools (urban): math 28% / reading 35% proficiency, ranked #80 of 174 in GA (top 46%) — families likely to look elsewhere, expect single-tenant / working-renter base with shorter leases; 71% free/reduced lunch — lower-income household profile, screen leases tightly.
- Zoned schools: Joseph Humphries Elementary School (math 5% / reading 15%, grade F, #1,076 of 1,228 statewide, top 89%, 262 students, 100% FRL); Crawford Long Middle School (math 2% / reading 8%, grade F, #462 of 470 statewide, top 99%, 705 students, 100% FRL); South Atlanta High School (math 2% / reading 12%, grade F, #385 of 424 statewide, top 92%, 928 students, 100% FRL) — zoned schools average 100% FRL vs 71% district-wide (29 pts higher); higher-poverty schools than district average — tighter screening recommended.
- Zoned-school proficiency averages 7% at this address vs 32% district-wide (-24 pts) — the specific schools serving this property underperform the Atlanta Public Schools average; the district grade overstates school quality for this exact location.
- Market conditions: Rents rising fast (+5.5%/yr); 175 active listings in the ZIP; 21 comparable units currently listed for rent nearby; rentals at typical pace (median 24d on market — plan ~3-4 weeks tenant-placement turnaround); 11,565 units permitted in Fulton County in 2024 (8,159 in 5+ unit buildings).
Forward outlook
- Local home prices are declining (-3.0%/yr); year-one equity from $1k of loan paydown is wiped out by about $6k of value loss. Plan a longer hold.
- Fulton County population projected at +38% by 2050 — long-run rental-demand tailwind backs the buy-and-hold thesis.
Negotiation context
- It's been on market 43 days — a 3% lower offer ($194k) is reasonable based on typical stale-listing flexibility.
- 4 sale attempts with the ask held roughly flat each time — persistent listings suggest the price (not the market) is what's stuck; bring a comps-based counter.
- Current owner paid $40k; list at $200k implies a 396% gain — meaningful room to come down on a strong offer.
Risks & watch-outs
- Watch-outs: built in 1936 — expect roof / HVAC / electrical / plumbing capex.
- Climate carrying-cost: moderate wind risk, 26% chance of damaging wind over 30y; extreme-heat days projected 7→18/yr by 2055 (HVAC capex compounding) — expect insurance premiums to compound above CPI over the hold.
Questions for the listing agent
- It's been on market 43 days. Have you received any prior offers? Is the seller open to a 3% concession, seller financing, or rate buy-down credit?
- Built in 1936 — when were the roof, HVAC, electrical panel, plumbing, and water heater last replaced?
- Is there a deadline driving the sale (1031 exchange, divorce, estate, relocation)? That informs how much negotiation room exists.
- The area grade is low — what's the realistic commute time and amenity access for the typical tenant pool here? Any planned neighborhood developments (good or bad) we should know about?
- What's the average days-on-market for RENTAL listings here right now (not sales)? A rising rental-DOM trend means longer vacancies and softer asking-rent achievability than the comps imply.
- What's the recent tenant-quality profile in this submarket — average credit score on applications, eviction rate, late-payment / NSF rate, and stable-employment percentage? A property-management company in the area should have these aggregated.
- How much new for-sale + rental construction is in the pipeline within 1–3 miles? Heavy new supply typically softens prices + rents 12–24 months out; constrained supply supports both.
Investment metrics
- 1% rule
- 0.99% ✗
- Cap rate
- 7.35%
- Cash-on-cash
- 3.76%
- DSCR
- 1.17
- GRM
- 8.5
CMA / ARV
- ARV (median comp)
- $411,653
- List price
- $200,000
- Delta
- -51.42%
- Verdict
- UNDERPRICED
- Comps
- 20 within 1.0 mi
Show comp detail 12 sales within ~0.75 mi
| Address | Dist | Beds/Ba | Sqft | Sold | Price | $/sf | Match |
|---|---|---|---|---|---|---|---|
| 2869 Allen Ln | 0.34mi | 3/2.0 | 1,331 (+7%) | 3mo | $202,000 | $152 | 67 |
| 633 Sandys Ln SE | 0.30mi | 3/2.0 | 1,314 (+5%) | 12mo | $200,000 | $152 | 64 |
| 2780 Fairlane Dr SE | 0.65mi | 3/2.0 | 1,318 (+6%) | 2mo | $295,000 | $224 | 55 |
| 3192 Belfort Rd SE | 0.61mi | 4/1.5 (+1) | 1,226 (-2%) | 11mo | $200,000 | $163 | 52 |
| 3267 Donnebrook Ln | 0.64mi | 3/2.0 | 1,326 (+6%) | 7mo | $258,800 | $195 | 50 |
| 607 Waynes Ct | 0.23mi | 3/2.0 | 1,379 (+10%) | 23mo | $229,700 | $167 | 49 |
| 2952 River Ridge Dr SW | 0.62mi | 2/0.5 (-1) | 1,300 (+4%) | 20mo | $111,000 | $85 | 41 |
| 2773 Fairlane Dr SE | 0.68mi | 3/1.5 | 1,324 (+6%) | 19mo | $192,000 | $145 | 40 |
| 2765 Fairlane Dr SE | 0.69mi | 3/1.5 | 1,324 (+6%) | 22mo | $218,000 | $165 | 37 |
| 886 Forrest Cir SE | 0.68mi | 4/2.0 (+1) | 1,300 (+4%) | 20mo | $255,000 | $196 | 36 |
| 3236 Jonesboro Rd SE | 0.61mi | 3/2.0 | 1,152 (-8%) | 22mo | $176,000 | $153 | 36 |
| 881 Forrest Cir SE | 0.65mi | 4/2.0 (+1) | 1,398 (+12%) | 22mo | $269,000 | $192 | 23 |
Match score weights: distance 35% · size 25% · config 20% · recency 20%. Top-matched comps best support the ARV.
Projected returns pro-forma
-3.0% appreciation · 5.45% rent growth · sell at horizon
- IRR
- -7.7%
- Equity multiple
- 0.71×
- Total profit
- $-16,211
- Equity at exit
- $29,821
- IRR
- 4.8%
- Equity multiple
- 1.39×
- Total profit
- $21,899
- Equity at exit
- $17,292
Cash invested: $56,000 (down + closing). Projections, not guarantees.
Landlord ↔ Tenant lean methodology
- Overall (STATE)
- 90 Strongly Landlord-Friendly
- State Georgia
- 90 Strongly Landlord-Friendly · R+3
- County
- — inherits STATE
- City
- — inherits STATE
ZIP-level market 30354
- Home prices YoY
- -17.5%
- Rents YoY
- 5.5%
- Active inventory
- 175
- Price-to-rent
- 8.5×
Monthly cashflow live
- Estimated rent
- $1,972 high interval (Pro) →
- Mortgage (P&I)
- −$1,049
- Tax est. 1.5%
- −$250 /mo · $3,000/yr
- Insurance
- −$83
- HOA
- −$0
- Vacancy / Maint / Mgmt
- −$414
- Net cashflow
- $176
Break-even live
UW: 25.0% down · 7.5% · 30yr · 1.5% tax · 5.0% vac · 8.0% maint · 8.0% mgmt
Financing live
Cash to close
- Down payment
- $50,000
- Closing costs
- $6,000
- Reserves months
- —
- Total cash needed
- —
Loan-product check · same deal, 3 products live
Conventional
25% down · 7.5% · 30yr
- Down + closing
- —
- Monthly P&I
- —
- Monthly cashflow
- —
- DSCR
- —
- Eligible?
- —
Personal DTI + credit; lowest rate.
DSCR
20% down · 8.5% · 30yr
- Down + closing
- —
- Monthly P&I
- —
- Monthly cashflow
- —
- DSCR
- —
- Eligible?
- —
No personal income docs; deal must DSCR.
Hard money
10% down · 12.0% · 12mo
- Down + closing
- —
- Monthly P&I
- —
- Monthly cashflow
- —
- DSCR
- —
- Eligible?
- —
Short-term bridge; refi at stabilization.
Rent comps 21 comps
| Address | Beds | Baths | Sqft | Rent | $/sqft | DOM | Units | Dist |
|---|---|---|---|---|---|---|---|---|
| 500 Hutchens Rd SE Atlanta, GA | 4.0 | 2.0 | 1248 | $2,400 | $1.92 | 16d | 1 | 0.23mi |
| 633 Sandys Ln SE Atlanta, GA | 3.0 | 2.0 | 1314 | $1,950 | $1.48 | 5d | 1 | 0.31mi |
| 445 Cleveland Ave SE Atlanta, GA | 2.0–3.0 | 1.0–2.0 | 1014 | $1,591 | $1.57 | 1d | 13 | 0.48mi |
| 837 Forrest Cir SE Atlanta, GA | 3.0 | 2.0 | 1500 | $1,845 | $1.23 | 24d | 1 | 0.69mi |
| 2694 Fairlane Dr SE Atlanta, GA | 4.0 | 2.0 | 1372 | $2,800 | $2.04 | 24d | 1 | 0.72mi |
| 324 Macedonia Rd SE Atlanta, GA | 3.0 | 1.0 | 1000 | $1,295 | $1.29 | 7d | 1 | 0.90mi |
| 167 Alyson Ct SE Atlanta, GA | 4.0 | 2.0 | 1344 | $1,825 | $1.36 | 24d | 1 | 0.92mi |
| 585 McWilliams Rd SE #104 Atlanta, GA | 2.0 | 3.0 | 1500 | $2,078 | $1.39 | 19d | 1 | 0.93mi |
| 871 Hargis St SE Atlanta, GA | 2.0 | 2.0 | 1040 | $1,800 | $1.73 | 24d | 1 | 0.98mi |
| 1006 Hutchens Rd SE Atlanta, GA | 3.0 | 2.0 | 881 | $2,800 | $3.18 | 24d | 1 | 1.00mi |
| 331 Simca St SE Atlanta, GA | 3.0 | 1.0 | 1000 | $1,700 | $1.70 | 2d | 1 | 1.05mi |
| 210 Oak Dr SE Atlanta, GA | 3.0 | 2.0 | 1330 | $1,400 | $1.05 | 24d | 1 | 1.05mi |
| 3188 Ward Dr SW Atlanta, GA | 3.0 | 1.5 | 1025 | $1,800 | $1.76 | 11d | 1 | 1.07mi |
| 1037 Rebel Forest Dr SE Atlanta, GA | 3.0 | 2.0 | 1075 | $1,750 | $1.63 | 24d | 1 | 1.10mi |
| 1317 Redford Dr SE Atlanta, GA | 3.0 | 2.0 | 1137 | $2,100 | $1.85 | 24d | 1 | 1.24mi |
| 136 Hillsdale Dr SE Atlanta, GA | 3.0 | 2.0 | 1075 | $1,995 | $1.86 | 24d | 1 | 1.30mi |
| 2786 Old Hapeville Rd SW Atlanta, GA | 2.0 | 1.5 | 1050 | $1,150 | $1.10 | 24d | 1 | 1.33mi |
| 3450 Forrest Park Rd SE Atlanta, GA | 1.0–3.0 | 1.0–2.0 | 1002 | $1,537 | $1.53 | 24d | 11 | 1.35mi |
| 2745 Old Hapeville Rd SW Atlanta, GA | 2.0–3.0 | 2.0 | 1007 | $1,375 | $1.36 | 15d | 1 | 1.40mi |
| 386 Lindsey Dr SE Atlanta, GA | 3.0 | 1.0 | 1040 | $1,808 | $1.74 | 14d | 1 | 1.42mi |
| 2332 Baywood Dr SE Atlanta, GA | 3.0 | 2.0 | 1100 | $1,400 | $1.27 | 17d | 1 | 1.49mi |
Listing history 22 events
-
2026-06-18days on market $200,000 Active 43 DOM
-
2026-06-17days on market $200,000 Active 42 DOM
-
2026-06-16days on market $200,000 Active 41 DOM
-
2026-06-15days on market $200,000 Active 40 DOM
-
2026-06-13days on market $200,000 Active 38 DOM
-
2026-06-13days on market $200,000 Active 37 DOM
-
2026-06-09days on market $200,000 Active 34 DOM
-
2026-06-08days on market $200,000 Active 33 DOM
-
2026-06-07days on market $200,000 Active 32 DOM
-
2026-06-04days on market $200,000 Active 29 DOM
-
2026-06-03days on market $200,000 Active 28 DOM
-
2026-06-02days on market $200,000 Active 27 DOM
-
2026-06-01days on market $200,000 Active 26 DOM
-
2026-05-31days on market $200,000 Active 25 DOM
-
2026-05-06$200,000 Active 473-char remark
Show marketing remark (467 chars)
This magnificent home is conveniently located near Hartfield Jackson airport and major popular highways. It is priced to sell quickly and move in ready. The owner is extremely motivated and plan to retire so don't hesitate on this amazing bargain. Since the seller is still occupying the property and works from home, please notify 24 hours to view the listing. No signs or lockbox required. This property will not be available for long because of the popular demand.
-
2026-05-06$200,000 New 467-char remark
Show marketing remark (467 chars)
This magnificent home is conveniently located near Hartfield Jackson airport and major popular highways. It is priced to sell quickly and move in ready. The owner is extremely motivated and plan to retire so don't hesitate on this amazing bargain. Since the seller is still occupying the property and works from home, please notify 24 hours to view the listing. No signs or lockbox required. This property will not be available for long because of the popular demand.
-
2025-08-11historical
-
2025-08-11historical
-
2025-07-29$205,000 Active
-
2025-07-29$205,000 New
-
1986-04-16soldstatus $40,300
-
1979-09-24soldstatus $30,000
ⓘ Source: listings_history table (triggers on properties + properties_extension) + one-shot
backfill from property_details.listing_events for pre-trigger history.
Climate risk First Street
- Flood 1/10 Low FEMA zone X (unshaded) · 0% chance over 30 yrs
- Wildfire 3/10 Moderate
- Heat 5/10 Major 7 d/yr ≥104°F today · 18 d/yr by 30 yrs out
- Wind 5/10 Major 26% chance of damaging wind over 30 yrs
- Air quality 4/10 Moderate 4 unhealthy d/yr today · 6 by 30 yrs out
Nearby sold comps map
Loading sold comps map…
Walkable amenities ~0.75 mi
Loading nearby amenities…
Taxation est. · year 1
- Rental income
- $23,663
- − Mortgage interest
- −$11,203
- − Property taxes
- −$3,000
- − Insurance
- −$1,000
- − Repairs & maintenance
- −$1,893
- − Management
- −$1,893
- − Depreciation
- −$5,818
- Taxable loss
- −$1,144
- Est. tax savings @ 24.0%
- +$275
- After-tax cash flow
- $2,383/yr
For passive investors: Depreciation is non-cash, so a rental often shows a tax loss while cash-flowing — sheltering income. Rental losses are passive: they offset passive income freely, and up to $25,000/yr can offset ordinary (W-2) income if you actively participate and your MAGI is under $100k (phasing out to $0 by $150k); unused losses carry forward. On sale, claimed depreciation is recaptured at up to 25%, and gains may owe capital-gains tax (a 1031 exchange can defer both). Figures are a year-1 estimate at your 24.0% rate — not tax advice; consult a CPA.
Schools (NCES district)
- District
- Atlanta Public Schools
- NCES district ID
- 1300120
- Math proficiency
- 28% ▼ -6.00%
- Reading proficiency
- 35% ▼ -2.00%
- Median HH income
- $48,306
- Composite
- 27.27/100
- National rank
- #7006
- State rank
- #80 of 174 in GA
Livability — Atlanta
- Score
- 83/100
- State rank
- #6
- US rank
- #919
Category grades
Schools grade is shown separately in the Schools card above.
Census & demographics
- Census place
- Atlanta, GA
- County
- Fulton County · 1,094,430 people
- Metro
- Atlanta-Sandy Springs-Alpharetta, GA
- Population (ZIP)
- 16,182
- Household income
- $63,189
- Rent vs Own
- Severe rent burden
- 930.0
Population outlook (Fulton County) Hauer SSP2
- Today (2025)
- 1,203,707 people
- By 2030
- 1,299,706 · +8.0%
- By 2040
- 1,488,256 · +23.6%
- By 2050
- 1,664,580 · +38.3%
- By 2075
- 2,036,072 · +69.2%
- By 2100
- 2,222,402 · +84.6%
Race, ethnicity, and origin ACS 2023
- Neighborhood character
- Predominantly Black (68%)
- Race & ethnicity
- Black 68% Hispanic / Latino 16% White 10% Two or more races 9% Native American 2% Asian 1%
- Hispanic origin (detail)
- Mexican 13%
- Common ancestry
- Italian 2% Romanian 1% Swedish 1%
- Foreign-born
- 11% · Canada, Vietnam, Guatemala
- Languages at home
- 81% English-only · Spanish 15% German/W. Germanic 1% Vietnamese 1%
Political lean MEDSL · Fulton
- 2024 margin
- Solid D (+44.9) · D 71.9% · R 27.0% · Other 1.1%
- 2008→2024 swing
- +9.8pp toward D · 2008: 35.0pp · 2024: 44.9pp
- All cycles
- 2024: D+44.9 2020: D+46.4 2016: D+42.1 2012: D+29.6 2008: D+35.0
Not yet ingested
- Civics
- —
Market trends
- HPI YoY
- ▼ -67.78%
- Current HPI
- 320.1111
- Rent YoY
- ▲ 5.45%
- Metro
- Atlanta-Sandy Springs-Alpharetta, GA
- State GDP YoY
- ▲ 2.66%
- F500 in state
- 28
Industry mix (Fortune 500 HQ in GA)
| Industry | F500 HQs | Revenue |
|---|---|---|
| Paper / Packaging | 2 | $29B |
|
||
| Retail | 1 | $160B |
|
||
| Transportation / Logistics | 1 | $91B |
|
||
| Airlines | 1 | $62B |
|
||
| Consumer Goods | 1 | $47B |
|
||
| Utilities | 1 | $25B |
|
||
Price history
+566.7% since first listed8 events — show timeline
- 2026-05-06 Listed $200,000 FMLS
- 2026-05-06 Listed $200,000 GAMLS
- 2025-08-11 Listing Removed — GAMLS
- 2025-08-11 Listing Removed — FMLS
- 2025-07-29 Listed $205,000 GAMLS
- 2025-07-29 Listed $205,000 FMLS
- 1986-04-16 Sold (Public Records) $40,300 Public Records
- 1979-09-24 Sold (Public Records) $30,000 Public Records
Property tax history
-7.4%/yrLatest (2025): $295 · -16.6% YoY. Source: county tax records.
Cash-flow waterfall
monthlySold comps — $/sqft
last 12 mo · ≤1 miLoading sold comps…