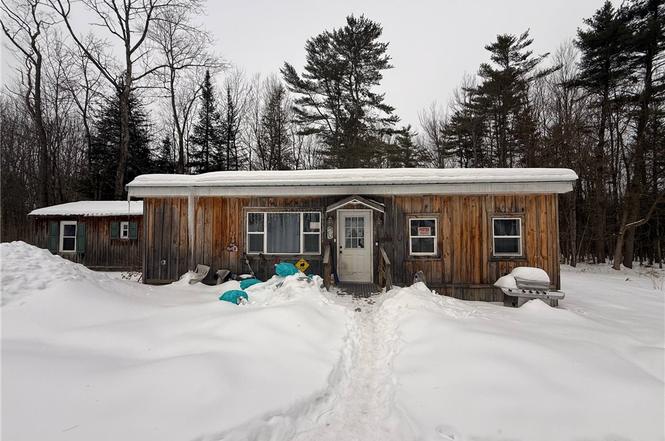
374 State Highway 29a · Mayfield, NY
Flood risk 1/10 · Minimal
- FEMA flood zone
- X
- Chance of flooding over 30 yrs
- 0.0%
- Est. flood insurance / yr
- $473 – $860
Fire risk 1/10 · Minimal
- Est. fire insurance / yr
- $691 – $1,283
Heat risk 2/10 · Minimal
- Hot days now (above 94°F)
- 7 days/yr
- Hot days in 30 yrs
- 16 days/yr
Wind risk 2/10 · Minimal
- Chance of severe wind over 30 yrs
- 3.0%
Air-quality risk 1/10 · Minimal
- Unhealthy air days now
- 0 days/yr
- Unhealthy air days in 30 yrs
- 0 days/yr
Risk factors via First Street. Map © Google.
Why this score? — see what drove the B+ grade
The composite is a weighted blend of 9 inputs, each scored 0–100. Each bar is that input's sub-score; the figure is the points it added to the 100-point composite (weight × sub-score).
- Cash flow +29.0/30.0
- DSCR +10.0/10.0
- Appreciation +10.0/10.0
- 1% rule +8.5/10.0
- ARV discount +7.5/15.0
- Schools +4.2/10.0
- Livability +3.3/5.0
- Rent growth +2.5/5.0
- Condition / age +2.5/5.0
$94,777
🖨 Deal sheet (PDF) 📄 Offer letter ✓ Due diligence
Listing remarks MLS
Old trailer on property needs to be removed. 1000 gal. concrete septic tank and leach fields. Drived Well. Electric on property. Nice private area.
Key facts
- Rectangular lot
- 5.9 acres
- 375 feet of frontage
Tags
Neighborhood map
What this means for you Summary
Snapshot
- This is a 2-bed/1.0-bath manufactured listed at $95k.
Deal economics
- At list price, monthly cash flow is $325 ($4k/yr) — positive.
- The deal already cash-flows at list — no discount required.
- Meets the 1% rule at list price ($1k rent vs $95k).
- Recommended offer: $92k (3.0% below list) — sets the bar for market timing.
Location & tenants
- Location reads 66/100 on livability (#634 in NY) — a middle-class / working-renter tenant base. Strengths: housing A+, health & safety A, cost of living A-; Watch: crime F, amenities F, commute F.
- Mayfield Central School District (town): math 42% / reading 56% proficiency, ranked #400 of 590 in NY (top 68%) — families likely to look elsewhere, expect single-tenant / working-renter base with shorter leases.
- Zoned schools: Mayfield Elementary School (math 36% / reading 62%, grade D, #1,177 of 2,108 statewide, top 56%, 430 students, 0% FRL); Mayfield Jr/Sr High School (math 52% / reading 42%, grade D-, #1,007 of 1,100 statewide, top 93%, 400 students, 48% FRL).
- Market conditions: 173 active listings in the ZIP; 112 units permitted in Fulton County in 2024 (50 in 5+ unit buildings).
Forward outlook
- In year one you build about $10k of equity ($656 loan paydown + $9k appreciation (10.0% local appreciation)).
- Fulton County population projected at -23% by 2050 — secular population decline; favor cash flow + early exit over multi-decade hold.
- At projected returns (10.0% appreciation + 3.0% rent growth), your $27k cash investment doubles in ~2 years — after that, you're playing with house money.
- By year 4, paydown + projected appreciation supports a ~$36k cash-out refi (75% LTV) — recoverable capital for the next deal without selling this one.
Negotiation context
- It's been on market 41 days — a 3% lower offer ($92k) is reasonable based on typical stale-listing flexibility.
- 2 sale attempts since 16y ago with the ask held roughly flat each time — persistent listings suggest the price (not the market) is what's stuck; bring a comps-based counter.
- Current owner paid $35k; list at $95k implies a 171% gain — meaningful room to come down on a strong offer.
Questions for the listing agent
- It's been on market 41 days. Have you received any prior offers? Is the seller open to a 3% concession, seller financing, or rate buy-down credit?
- Is there a deadline driving the sale (1031 exchange, divorce, estate, relocation)? That informs how much negotiation room exists.
- Crime grade is F in this area — have there been break-ins, vandalism, or insurance claims at this property in the last 3 years? What carrier currently insures it and at what premium?
- What's the average days-on-market for RENTAL listings here right now (not sales)? A rising rental-DOM trend means longer vacancies and softer asking-rent achievability than the comps imply.
- What's the recent tenant-quality profile in this submarket — average credit score on applications, eviction rate, late-payment / NSF rate, and stable-employment percentage? A property-management company in the area should have these aggregated.
- How much new for-sale + rental construction is in the pipeline within 1–3 miles? Heavy new supply typically softens prices + rents 12–24 months out; constrained supply supports both.
Investment metrics
- 1% rule
- 1.35% ✓
- Cap rate
- 10.41%
- Cash-on-cash
- 14.72%
- DSCR
- 1.65
- GRM
- 6.2
CMA / ARV
No comps found within radius.
Projected returns pro-forma
10.0% appreciation · 3.0% rent growth · sell at horizon
- IRR
- 35.2%
- Equity multiple
- 3.73×
- Total profit
- $72,385
- Equity at exit
- $85,383
- IRR
- 30.3%
- Equity multiple
- 8.42×
- Total profit
- $196,937
- Equity at exit
- $184,131
Cash invested: $26,538 (down + closing). Projections, not guarantees.
Landlord ↔ Tenant lean methodology
- Overall (STATE)
- 15 Strongly Tenant-Friendly
- State New York
- 15 Strongly Tenant-Friendly · D+10
- County
- — inherits STATE
- City
- — inherits STATE
ZIP-level market 12078
- Home prices YoY
- 12.2%
- Active inventory
- 173
- Price-to-rent
- 6.2×
Monthly cashflow live
- Estimated rent
- $1,279 medium interval (Pro) →
- Mortgage (P&I)
- −$497
- Tax from tax record
- −$149 /mo · $1,784/yr
- Insurance
- −$39
- HOA
- −$0
- Vacancy / Maint / Mgmt
- −$269
- Net cashflow
- $325
Break-even live
Sensitivity live
| Price | -10% $379 | -5% $352 | +0% $325 | +5% $299 | +10% $272 |
|---|---|---|---|---|---|
| Rent | -10% $224 | -5% $275 | +0% $325 | +5% $376 | +10% $427 |
| Rate | -1.0pp $373 | -0.5pp $350 | base $325 | +0.5pp $301 | +1.0pp $276 |
UW: 25.0% down · 7.5% · 30yr · 1.5% tax · 5.0% vac · 8.0% maint · 8.0% mgmt
Financing live
Cash to close
- Down payment
- $23,694
- Closing costs
- $2,843
- Reserves months
- —
- Total cash needed
- —
Loan-product check · same deal, 3 products live
Conventional
25% down · 7.5% · 30yr
- Down + closing
- —
- Monthly P&I
- —
- Monthly cashflow
- —
- DSCR
- —
- Eligible?
- —
Personal DTI + credit; lowest rate.
DSCR
20% down · 8.5% · 30yr
- Down + closing
- —
- Monthly P&I
- —
- Monthly cashflow
- —
- DSCR
- —
- Eligible?
- —
No personal income docs; deal must DSCR.
Hard money
10% down · 12.0% · 12mo
- Down + closing
- —
- Monthly P&I
- —
- Monthly cashflow
- —
- DSCR
- —
- Eligible?
- —
Short-term bridge; refi at stabilization.
Listing history 7 events
-
2026-03-25status Pending
-
2026-02-22historical Active Under Contract
-
2026-02-12$94,777 Active
-
2011-03-29soldstatus $35,000 147-char remark
Show marketing remark (147 chars)
Old trailer on property needs to be removed. 1000 gal. concrete septic tank and leach fields. Drived Well. Electric on property. Nice private area.
-
2011-03-29soldstatus $35,000
Show marketing remark (147 chars)
Old trailer on property needs to be removed. 1000 gal. concrete septic tank and leach fields. Drived Well. Electric on property. Nice private area.
-
2011-03-01historical 147-char remark
Show marketing remark (147 chars)
Old trailer on property needs to be removed. 1000 gal. concrete septic tank and leach fields. Drived Well. Electric on property. Nice private area.
-
2010-09-28$45,000 147-char remark
Show marketing remark (147 chars)
Old trailer on property needs to be removed. 1000 gal. concrete septic tank and leach fields. Drived Well. Electric on property. Nice private area.
ⓘ Source: listings_history table (triggers on properties + properties_extension) + one-shot
backfill from property_details.listing_events for pre-trigger history.
Tax reassessment forecast NY · Partial reset (capped growth)
- Current annual tax
- $1,784 · $149/mo
- Projected year-2 tax
- $1,784 · $149/mo
- Expected delta
- $0/yr ($0/mo · 0.0%)
ⓘ Screening estimate from a state-policy table — verify with the county assessor before closing.
Climate risk First Street
- Flood 1/10 Low FEMA zone X · 0% chance over 30 yrs
- Wildfire 1/10 Low
- Heat 2/10 Low 7 d/yr ≥94°F today · 16 d/yr by 30 yrs out
- Wind 2/10 Low 3% chance of damaging wind over 30 yrs
- Air quality 1/10 Low 0 unhealthy d/yr today · 0 by 30 yrs out
Nearby sold comps map
Loading sold comps map…
Walkable amenities ~0.75 mi
Loading nearby amenities…
Taxation est. · year 1
- Rental income
- $15,351
- − Mortgage interest
- −$5,309
- − Property taxes
- −$1,784
- − Insurance
- −$474
- − Repairs & maintenance
- −$1,228
- − Management
- −$1,228
- − Depreciation
- −$2,757
- Taxable income
- $2,571
- Est. tax owed @ 24.0%
- −$617
- After-tax cash flow
- $3,289/yr
For passive investors: Depreciation is non-cash, so a rental often shows a tax loss while cash-flowing — sheltering income. Rental losses are passive: they offset passive income freely, and up to $25,000/yr can offset ordinary (W-2) income if you actively participate and your MAGI is under $100k (phasing out to $0 by $150k); unused losses carry forward. On sale, claimed depreciation is recaptured at up to 25%, and gains may owe capital-gains tax (a 1031 exchange can defer both). Figures are a year-1 estimate at your 24.0% rate — not tax advice; consult a CPA.
Schools (NCES district)
- District
- Mayfield Central School District
- NCES district ID
- 3618750
- Math proficiency
- 42% ▼ -11.00%
- Reading proficiency
- 56% ▲ 5.00%
- Median HH income
- $51,922
- Composite
- 42.08/100
- National rank
- #3322
- State rank
- #400 of 590 in NY
Livability — Mayfield
- Score
- 66/100
- State rank
- #634
- US rank
- #11697
Category grades
Schools grade is shown separately in the Schools card above.
Census & demographics
- Population (ZIP)
- 23,087
Population outlook (Fulton County) Hauer SSP2
- Today (2025)
- 51,132 people
- By 2030
- 49,114 · -3.9%
- By 2040
- 44,373 · -13.2%
- By 2050
- 39,321 · -23.1%
- By 2075
- 28,503 · -44.3%
- By 2100
- 19,268 · -62.3%
Race, ethnicity, and origin ACS 2023
- Neighborhood character
- Predominantly White (86%)
- Race & ethnicity
- White 86% Two or more races 8% Hispanic / Latino 5% Black 2% Asian 1%
- Hispanic origin (detail)
- Puerto Rican 3%
- Common ancestry
- Lithuanian 5% Romanian 4% Iranian 4%
- Foreign-born
- 2% · Canada, China
- Languages at home
- 97% English-only · Spanish 2%
Political lean MEDSL · Fulton
- 2024 margin
- Solid R (+35.9) · D 32.1% · R 67.9%
- 2008→2024 swing
- -26.6pp toward R · 2008: -9.2pp · 2024: -35.9pp
- All cycles
- 2024: R+35.9 2020: R+31.4 2016: R+35.5 2012: R+10.5 2008: R+9.2
Not yet ingested
- Civics
- —
Market trends
- HPI YoY
- ▲ 34.22%
- Current HPI
- 315.1368
- Rent YoY
- —
- Metro
- —
- State GDP YoY
- ▲ 2.60%
- F500 in state
- 92
Industry mix (Fortune 500 HQ in NY)
| Industry | F500 HQs | Revenue |
|---|---|---|
| Financial Services | 10 | $950B |
|
||
| Consumer Goods | 9 | $162B |
|
||
| Insurance | 4 | $225B |
|
||
| Telecommunications | 2 | $144B |
|
||
| Pharmaceuticals | 2 | $112B |
|
||
| Media / Entertainment | 2 | $69B |
|
||
Price history
+110.6% since first listed7 events — show timeline
- 2026-03-25 Pending — UNYREIS
- 2026-02-22 Contingent — UNYREIS
- 2026-02-12 Listed $94,777 UNYREIS
- 2011-03-29 Sold (Public Records) $35,000 Public Records
- 2011-03-29 Sold (MLS) $35,000 Global MLS
- 2011-03-01 Listing Removed — Global MLS
- 2010-09-28 Listed $45,000 Global MLS
Property tax history
+2.0%/yrLatest (2025): $1,784 · +4.8% YoY. Source: county tax records.
Cash-flow waterfall
monthlySold comps — $/sqft
last 12 mo · ≤1 miLoading sold comps…