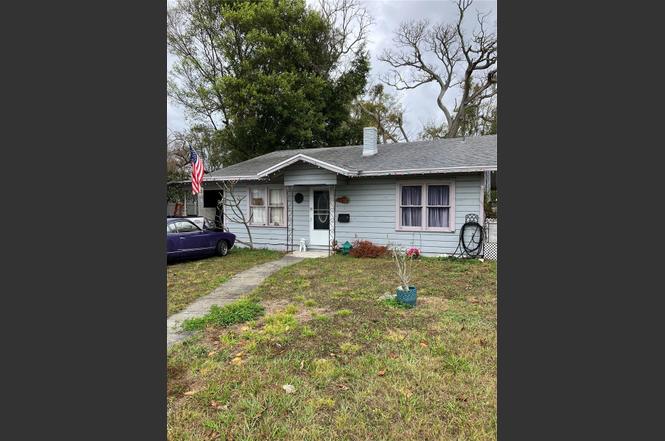
3012 16th Ave W · Bradenton, FL
Flood risk 4/10 · Minor
- FEMA flood zone
- X (unshaded)
- Chance of flooding over 30 yrs
- 0.22%
- Est. flood insurance / yr
- $507 – $1,088
Fire risk 1/10 · Minimal
- Est. fire insurance / yr
- $947 – $1,759
Heat risk 10/10 · Severe
- Hot days now (above 107°F)
- 7 days/yr
- Hot days in 30 yrs
- 30 days/yr
Wind risk 10/10 · Severe
- Chance of severe wind over 30 yrs
- 99.0%
Air-quality risk 3/10 · Minor
- Unhealthy air days now
- 2 days/yr
- Unhealthy air days in 30 yrs
- 2 days/yr
Risk factors via First Street. Map © Google.
Why this score? — see what drove the D+ grade
The composite is a weighted blend of 9 inputs, each scored 0–100. Each bar is that input's sub-score; the figure is the points it added to the 100-point composite (weight × sub-score).
- ARV discount +15.0/15.0
- Cash flow +13.1/30.0
- Schools +4.4/10.0
- Livability +4.0/5.0
- DSCR +3.9/10.0
- 1% rule +3.8/10.0
- Condition / age +2.5/5.0
- Rent growth +1.9/5.0
- Appreciation +0.0/10.0
$219,900
🖨 Deal sheet 📄 Offer letter ✓ Due diligence
Listing remarks MLS
GOOD LOCATION FOR THIS TWO BEDROOM COTTAGE WITH LOTS OF POTENTIAL. ENCLOSED LANAI IS BLOCK CONSTRUCTION AND INTERIOR HAS FRAMING FOR A QUICK FINISH FOR EXTRA LIVING SPACE. BATH HAS PEDASTAL SINK AND LOTS OF TILE FOR EASY CARE. GOOD SIZE KITCHEN WITH PLENTY OF ROOM TO ADD CABINETRY. ATTACHED CARPORT WITH STORAGE AND LARGE REAR YARD WITH MATURE SHADE TREES.
Key facts
- 9,165 sq ft lot
- Parking
- Built 1953
Property features AI
Exterior
- Parking: Carport with 1 space
- Utilities: Public water; Public sewer; Cable connected; Electricity connected; Water connected
- Home design: Single-family residence; One story; Faces south
- Construction: Frame construction; Shingle roof; Slab foundation; Built on a 0.21-acre lot
- Exterior features: Paved roads; Lot of about 0.21 acres
Interior
- Kitchen: Range; Refrigerator
- Bedrooms: 2 bedrooms
- Flooring: Carpet; Vinyl
- Bathrooms: 1 full bathroom
- Heating & cooling: Electric heating; Central air conditioning
- Interior features: Ceiling fans
- Laundry & utility: Outdoor laundry area
Neighborhood map
What this means for you Summary
Snapshot
- This is a 2-bed/1.0-bath single-family listed at $220k.
Deal economics
- At list price, monthly cash flow is $-8 ($-97/yr) — negative.
- To cash-flow at today's rent, offer at most $218k (0.7% below list).
- To meet the 1% rule (rent ≥ 1% of price), the offer needs to be $193k (12.1% below list).
- Recommended offer: $193k (12.1% below list) — sets the bar for 1% rule.
- Cap rate 6.2% vs local median 3.6% in Bradenton — top-decile yield for the area; either an underpriced asset or a hidden risk that comps aren't pricing in. Stress-test before assuming the spread holds.
Location & tenants
- Location reads 81/100 on livability (#101 in FL, #1,528 nationally) — a professional / high-income tenant draw. Strengths: commute A+, cost of living A+, housing A+; Watch: employment D+, crime D, amenities F.
- Manatee (suburban): math 54% / reading 50% proficiency, ranked #26 of 73 in FL (top 36%) — acceptable for families but not a draw, mixed tenant base, ~2y average lease.
- Market conditions: Rents soft (-2.4%/yr); 319 active listings in the ZIP; 40 comparable units currently listed for rent nearby; rentals at typical pace (median 24d on market — plan ~3-4 weeks tenant-placement turnaround); 7,472 units permitted in Manatee County in 2024 (1,782 in 5+ unit buildings).
- This rent runs 44% of the median local income ($53k/yr) — at the standard rent-burdened threshold; future hikes will face affordability resistance.
Forward outlook
- Local home prices are declining (-3.0%/yr); year-one equity from $2k of loan paydown is wiped out by about $7k of value loss. Plan a longer hold.
- Manatee County population projected at +43% by 2050 — long-run rental-demand tailwind backs the buy-and-hold thesis.
Negotiation context
- It's been on market 114 days — a 9% lower offer ($200k) is reasonable based on typical stale-listing flexibility.
- 3 sale attempts since 22y ago with the ask held roughly flat each time — persistent listings suggest the price (not the market) is what's stuck; bring a comps-based counter.
- Current owner paid $68k; list at $220k implies a 223% gain — meaningful room to come down on a strong offer.
Risks & watch-outs
- Watch-outs: built in 1953 — expect roof / HVAC / electrical / plumbing capex.
- Climate carrying-cost: severe wind risk, 99% chance of damaging wind over 30y; extreme-heat days projected 7→30/yr by 2055 (HVAC capex compounding) — expect insurance premiums to compound above CPI over the hold.
Questions for the listing agent
- What do current leases actually rent for vs. the listed asking? Can we see a recent rent roll and the last 12 months of T-12 income?
- It's been on market 114 days. Have you received any prior offers? Is the seller open to a 12% concession, seller financing, or rate buy-down credit?
- Built in 1953 — when were the roof, HVAC, electrical panel, plumbing, and water heater last replaced?
- Why hasn't it sold? Are there any deal-killer items the seller is aware of (foundation, flood, title, zoning, code violations)?
- Is there a deadline driving the sale (1031 exchange, divorce, estate, relocation)? That informs how much negotiation room exists.
- Crime grade is D in this area — have there been break-ins, vandalism, or insurance claims at this property in the last 3 years? What carrier currently insures it and at what premium?
- The area grade is low — what's the realistic commute time and amenity access for the typical tenant pool here? Any planned neighborhood developments (good or bad) we should know about?
- What's the average days-on-market for RENTAL listings here right now (not sales)? A rising rental-DOM trend means longer vacancies and softer asking-rent achievability than the comps imply.
- What's the recent tenant-quality profile in this submarket — average credit score on applications, eviction rate, late-payment / NSF rate, and stable-employment percentage? A property-management company in the area should have these aggregated.
- How much new for-sale + rental construction is in the pipeline within 1–3 miles? Heavy new supply typically softens prices + rents 12–24 months out; constrained supply supports both.
Investment metrics
- 1% rule
- 0.88% ✗
- Cap rate
- 6.25%
- Cash-on-cash
- -0.16%
- DSCR
- 0.99
- GRM
- 9.5
CMA / ARV
- ARV (on-the-fly)
- $322,620
- Comps found
- 12
Show comp detail 12 sales within ~0.75 mi
| Address | Dist | Beds/Ba | Sqft | Sold | Price | $/sf | Match |
|---|---|---|---|---|---|---|---|
| 1406 28th St W | 0.17mi | 3/1.0 (+1) | 1,114 (-2%) | 2mo | $315,000 | $283 | 81 |
| 3102 16th Ave W | 0.04mi | 3/1.0 (+1) | 1,038 (-9%) | 2mo | $299,999 | $289 | 77 |
| 2713 11th Ave W | 0.35mi | 3/2.0 (+1) | 1,134 (-0%) | 0mo | $320,000 | $282 | 74 |
| 3210 21st Avenue Dr W | 0.33mi | 3/2.0 (+1) | 1,184 (+4%) | 2mo | $335,000 | $283 | 67 |
| 1909 27th St W | 0.34mi | 3/1.0 (+1) | 1,042 (-9%) | 1mo | $308,000 | $296 | 64 |
| 2330 7th Ave W | 0.71mi | 2/1.0 | 1,122 (-2%) | 0mo | $310,000 | $276 | 64 |
| 3106 Oxford Dr W | 0.59mi | 3/2.0 (+1) | 1,136 (-0%) | 1mo | $390,000 | $343 | 62 |
| 1302 22nd St W | 0.54mi | 2/1.0 | 1,298 (+14%) | 1mo | $205,000 | $158 | 51 |
| 1908 22nd St W | 0.57mi | 3/1.0 (+1) | 1,025 (-10%) | 2mo | $267,000 | $260 | 50 |
| 2601 39th St W | 0.74mi | 3/2.0 (+1) | 1,188 (+4%) | 2mo | $370,000 | $311 | 48 |
| 2017 17th Ave W | 0.63mi | 3/2.0 (+1) | 1,264 (+11%) | 2mo | $334,750 | $265 | 42 |
| 2806 Oxford Dr W | 0.56mi | 3/2.0 (+1) | 1,284 (+13%) | 2mo | $349,000 | $272 | 42 |
Match score weights: distance 35% · size 25% · config 20% · recency 20%. Top-matched comps best support the ARV.
Projected returns pro-forma
-3.0% appreciation · 0.0% rent growth · sell at horizon
- IRR
- -20.0%
- Equity multiple
- 0.32×
- Total profit
- $-41,778
- Equity at exit
- $32,788
- IRR
- -21.4%
- Equity multiple
- 0.05×
- Total profit
- $-58,787
- Equity at exit
- $19,013
Cash invested: $61,572 (down + closing). Projections, not guarantees.
Landlord ↔ Tenant lean methodology
- Overall (STATE)
- 87 Strongly Landlord-Friendly
- State Florida
- 87 Strongly Landlord-Friendly · R+3
- County
- — inherits STATE
- City
- — inherits STATE
ZIP-level market 34205
- Rents YoY
- -2.4%
- Active inventory
- 319
- Price-to-rent
- 9.5×
Monthly cashflow live
- Estimated rent
- $1,934 high interval (Pro) →
- Mortgage (P&I)
- −$1,153
- Tax from tax record
- −$291 /mo · $3,492/yr
- Insurance
- −$92
- HOA
- −$0
- Vacancy / Maint / Mgmt
- −$406
- Net cashflow
- $-8
Break-even live
UW: 25.0% down · 7.5% · 30yr · 1.5% tax · 5.0% vac · 8.0% maint · 8.0% mgmt
Financing live
Cash to close
- Down payment
- $54,975
- Closing costs
- $6,597
- Reserves months
- —
- Total cash needed
- —
Loan-product check · same deal, 3 products live
Conventional
25% down · 7.5% · 30yr
- Down + closing
- —
- Monthly P&I
- —
- Monthly cashflow
- —
- DSCR
- —
- Eligible?
- —
Personal DTI + credit; lowest rate.
DSCR
20% down · 8.5% · 30yr
- Down + closing
- —
- Monthly P&I
- —
- Monthly cashflow
- —
- DSCR
- —
- Eligible?
- —
No personal income docs; deal must DSCR.
Hard money
10% down · 12.0% · 12mo
- Down + closing
- —
- Monthly P&I
- —
- Monthly cashflow
- —
- DSCR
- —
- Eligible?
- —
Short-term bridge; refi at stabilization.
Rent comps 40 comps
| Address | Beds | Baths | Sqft | Rent | $/sqft | DOM | Units | Dist |
|---|---|---|---|---|---|---|---|---|
| 1503 32nd St W Bradenton, FL | 3.0 | 2.0 | 1148 | $2,400 | $2.09 | 23d | 1 | 0.09mi |
| 1613 28th St W Bradenton, FL | 2.0 | 2.0 | 1200 | $1,850 | $1.54 | 23d | 1 | 0.17mi |
| 1408 37th Street Ct W Bradenton, FL | 3.0 | 2.0 | 1188 | $2,500 | $2.10 | 3d | 1 | 0.43mi |
| 2321 18th Ave W Bradenton, FL | 2.0 | 2.0 | 1168 | $3,600 | $3.08 | 23d | 1 | 0.45mi |
| 3807 16th Ave W Bradenton, FL | 3.0 | 2.0 | 1491 | $2,100 | $1.41 | 23d | 1 | 0.45mi |
| 914 23rd St W Unit B Bradenton, FL | 1.0 | 1.0 | 800 | $1,345 | $1.68 | 3d | 1 | 0.57mi |
| 617 26th St W Bradenton, FL | 2.0 | 2.0 | 1127 | $3,000 | $2.66 | 19d | 1 | 0.64mi |
| 602 26th St W Unit A Bradenton, FL | 1.0 | 1.0 | 1200 | $850 | $0.71 | 23d | 1 | 0.65mi |
| 602 26th St W Unit A Bradenton, FL | 2.0 | 1.0 | 1200 | $1,250 | $1.04 | 3d | 1 | 0.65mi |
| 3805 7th Ave W Bradenton, FL | 3.0 | 1.0 | 1000 | $2,200 | $2.20 | 23d | 1 | 0.68mi |
| 1912 19th Ave W Unit 1912 Bradenton, FL | 2.0 | 1.0 | 800 | $1,395 | $1.74 | 23d | 1 | 0.71mi |
| 2201 24th Ave W Bradenton, FL | 2.0 | 2.0 | 1115 | $1,950 | $1.75 | 23d | 1 | 0.74mi |
| 2309 Manatee Ave W Bradenton, FL | 2.0 | 1.0 | 900 | $1,535 | $1.71 | 3d | 4 | 0.80mi |
| 2205 20th St W Bradenton, FL | 2.0 | 1.0 | 810 | $1,850 | $2.28 | 11d | 1 | 0.81mi |
| 3603 Oxford Dr W Bradenton, FL | 2.0 | 2.0 | 1400 | $2,400 | $1.71 | 23d | 1 | 0.83mi |
| 1306 17th St W Unit 4 Bradenton, FL | 2.0 | 1.0 | 1000 | $1,100 | $1.10 | 15d | 1 | 0.83mi |
| 2901 26th St W #807 Bradenton, FL | 2.0 | 2.0 | 940 | $1,525 | $1.62 | 2d | 1 | 0.84mi |
| 2017 6th Ave W Unit 6 Bradenton, FL | 1.0 | 1.0 | 800 | $975 | $1.22 | 11d | 1 | 0.84mi |
| 2001 25th Ave W Bradenton, FL | 3.0 | 2.0 | 1370 | $3,000 | $2.19 | 19d | 1 | 0.88mi |
| 3806 Southern Pkwy W Bradenton, FL | 3.0 | 2.0 | 1296 | $2,176 | $1.68 | 11d | 1 | 0.91mi |
| 1505 18th Avenue Dr W Bradenton, FL | 3.0 | 1.0 | 886 | $1,875 | $2.12 | 15d | 1 | 0.94mi |
| 2306 30th Ave W Bradenton, FL | 3.0 | 2.0 | 945 | $1,700 | $1.80 | 23d | 1 | 0.95mi |
| 1515 15th St W Bradenton, FL | 1.0 | 1.0 | 900 | $1,300 | $1.44 | 23d | 1 | 0.98mi |
| 1418 18th Avenue Dr W Unit 1418 Bradenton, FL | 3.0 | 2.0 | 1000 | $1,900 | $1.90 | 23d | 1 | 1.03mi |
| 1402 13th St W Apt 1406 Bradenton, FL | 1.0 | 1.0 | 629 | $1,577 | $2.51 | 1d | 15 | 1.04mi |
| 4607 7th Ave W Bradenton, FL | 3.0 | 1.0 | 1296 | $1,950 | $1.50 | 23d | 1 | 1.07mi |
| 1319 18th Ave W Bradenton, FL | 3.0 | 2.0 | 1185 | $1,795 | $1.51 | 23d | 1 | 1.07mi |
| 1501 13th St W Bradenton, FL | 1.0 | 1.0 | 1050 | $1,199 | $1.14 | 23d | 1 | 1.12mi |
| 1701 13th St W Apt A Bradenton, FL | 2.0 | 1.0 | 850 | $1,395 | $1.64 | 2d | 1 | 1.13mi |
| 2127 13th St W Unit B Bradenton, FL | 1.0 | 1.0 | 700 | $1,149 | $1.64 | 23d | 1 | 1.17mi |
| 3512 32nd St W Bradenton, FL | 2.0 | 1.0 | 1200 | $2,100 | $1.75 | 3d | 1 | 1.19mi |
| 2017 12th St W Bradenton, FL | 1.0 | 1.0 | 720 | $1,300 | $1.81 | 23d | 1 | 1.19mi |
| 2409 13th St W Apt 2 Bradenton, FL | 2.0 | 1.0 | 770 | $1,175 | $1.53 | 23d | 1 | 1.21mi |
| 2117 11th St W Bradenton, FL | 1.0 | 1.0 | 850 | $1,295 | $1.52 | 23d | 1 | 1.26mi |
| 2422 11th St W Bradenton, FL | 2.0 | 1.0 | 900 | $1,445 | $1.61 | 23d | 1 | 1.29mi |
| 1650 1st Ave W Unit 507B Bradenton, FL | 2.0 | 2.0 | 1269 | $2,300 | $1.81 | 23d | 1 | 1.29mi |
| 202 46th St W Unit 207 Bradenton, FL | 2.0 | 2.0 | 951 | $1,800 | $1.89 | 15d | 1 | 1.30mi |
| 1600 1st Ave W Unit 206A Bradenton, FL | 2.0 | 2.0 | 1221 | $2,000 | $1.64 | 14d | 1 | 1.32mi |
| 4109 Lake Bayshore Dr Bradenton, FL | 1.0 | 1.0 | 768 | $1,250 | $1.63 | 23d | 1 | 1.33mi |
| 3737 Lake Bayshore Dr Unit 213 Bradenton, FL | 2.0 | 1.0 | 912 | $1,150 | $1.26 | 21d | 1 | 1.33mi |
Listing history 23 events
-
2026-06-18days on market $219,900 Active 114 DOM
-
2026-06-17days on market $219,900 Active 113 DOM
-
2026-06-16days on market $219,900 Active 112 DOM
-
2026-06-15days on market $219,900 Active 111 DOM
-
2026-06-13days on market $219,900 Active 109 DOM
-
2026-06-13days on market $219,900 Active 108 DOM
-
2026-06-10days on market $219,900 Active 106 DOM
-
2026-06-09days on market $219,900 Active 105 DOM
-
2026-06-08days on market $219,900 Active 104 DOM
-
2026-06-08days on market $219,900 Active 103 DOM
-
2026-06-03days on market $219,900 Active 99 DOM
-
2026-06-02days on market $219,900 Active 98 DOM
-
2026-06-01days on market $219,900 Active 97 DOM
-
2026-05-31days on market $219,900 Active 96 DOM
-
2026-02-24$219,900 Active
-
2013-02-28soldstatus $68,000 357-char remark
Show marketing remark (357 chars)
GOOD LOCATION FOR THIS TWO BEDROOM COTTAGE WITH LOTS OF POTENTIAL. ENCLOSED LANAI IS BLOCK CONSTRUCTION AND INTERIOR HAS FRAMING FOR A QUICK FINISH FOR EXTRA LIVING SPACE. BATH HAS PEDASTAL SINK AND LOTS OF TILE FOR EASY CARE. GOOD SIZE KITCHEN WITH PLENTY OF ROOM TO ADD CABINETRY. ATTACHED CARPORT WITH STORAGE AND LARGE REAR YARD WITH MATURE SHADE TREES.
-
2013-01-25$69,900 357-char remark
Show marketing remark (357 chars)
GOOD LOCATION FOR THIS TWO BEDROOM COTTAGE WITH LOTS OF POTENTIAL. ENCLOSED LANAI IS BLOCK CONSTRUCTION AND INTERIOR HAS FRAMING FOR A QUICK FINISH FOR EXTRA LIVING SPACE. BATH HAS PEDASTAL SINK AND LOTS OF TILE FOR EASY CARE. GOOD SIZE KITCHEN WITH PLENTY OF ROOM TO ADD CABINETRY. ATTACHED CARPORT WITH STORAGE AND LARGE REAR YARD WITH MATURE SHADE TREES.
-
2005-02-01soldstatus $125,000
-
2005-01-31soldstatus $125,000 82-char remark
Show marketing remark (82 chars)
House does need some work. Perfect For The First Time Homebuyer. Being Sold As Is.
-
2004-12-16historical 82-char remark
Show marketing remark (82 chars)
House does need some work. Perfect For The First Time Homebuyer. Being Sold As Is.
-
2004-07-30$134,900 82-char remark
Show marketing remark (82 chars)
House does need some work. Perfect For The First Time Homebuyer. Being Sold As Is.
-
2001-09-18soldstatus $74,200
-
1988-12-13soldstatus $45,500
ⓘ Source: listings_history table (triggers on properties + properties_extension) + one-shot
backfill from property_details.listing_events for pre-trigger history.
Tax reassessment forecast FL · Resets to sale price
- Current annual tax
- $3,492 · $291/mo
- Projected year-2 tax
- $3,492 · $291/mo
- Expected delta
- $0/yr ($0/mo · -0.0%)
ⓘ Screening estimate from a state-policy table — verify with the county assessor before closing.
Climate risk First Street
- Flood 4/10 Moderate FEMA zone X (unshaded) · 22% chance over 30 yrs
- Wildfire 1/10 Low
- Heat 10/10 Extreme 7 d/yr ≥107°F today · 30 d/yr by 30 yrs out
- Wind 10/10 Extreme 99% chance of damaging wind over 30 yrs
- Air quality 3/10 Moderate 2 unhealthy d/yr today · 2 by 30 yrs out
Nearby sold comps map
Loading sold comps map…
Walkable amenities ~0.75 mi
Loading nearby amenities…
Taxation est. · year 1
- Rental income
- $23,205
- − Mortgage interest
- −$12,318
- − Property taxes
- −$3,492
- − Insurance
- −$1,100
- − Repairs & maintenance
- −$1,856
- − Management
- −$1,856
- − Depreciation
- −$6,397
- Taxable loss
- −$3,814
- Est. tax savings @ 24.0%
- +$915
- After-tax cash flow
- $818/yr
For passive investors: Depreciation is non-cash, so a rental often shows a tax loss while cash-flowing — sheltering income. Rental losses are passive: they offset passive income freely, and up to $25,000/yr can offset ordinary (W-2) income if you actively participate and your MAGI is under $100k (phasing out to $0 by $150k); unused losses carry forward. On sale, claimed depreciation is recaptured at up to 25%, and gains may owe capital-gains tax (a 1031 exchange can defer both). Figures are a year-1 estimate at your 24.0% rate — not tax advice; consult a CPA.
Schools (NCES district)
- District
- Manatee
- NCES district ID
- 1201230
- Math proficiency
- 54% ▼ -6.00%
- Reading proficiency
- 50% ▼ -2.00%
- Median HH income
- $49,607
- Composite
- 44.43/100
- National rank
- #2806
- State rank
- #26 of 73 in FL
Livability — Bradenton
- Score
- 81/100
- State rank
- #101
- US rank
- #1528
Category grades
Schools grade is shown separately in the Schools card above.
Census & demographics
- Census place
- Bradenton, FL
- County
- Manatee County · 416,364 people
- City population
- 227,091
- Metro
- North Port-Sarasota-Bradenton, FL
- Population (ZIP)
- 31,946
- Household income
- $52,525
- Rent vs Own
- Severe rent burden
- 1736.0
Population outlook (Manatee County) Hauer SSP2
- Today (2025)
- 447,342 people
- By 2030
- 488,911 · +9.3%
- By 2040
- 567,934 · +27.0%
- By 2050
- 637,995 · +42.6%
- By 2075
- 781,970 · +74.8%
- By 2100
- 848,272 · +89.6%
Race, ethnicity, and origin ACS 2023
- Neighborhood character
- Predominantly White (65%)
- Race & ethnicity
- White 65% Hispanic / Latino 18% Black 10% Two or more races 9% Asian 2% Native American 1%
- Hispanic origin (detail)
- Mexican 7% Puerto Rican 4% Cuban 1%
- Common ancestry
- Hispanic 2% Romanian 2% Lithuanian 2%
- Foreign-born
- 15% · Canada, Vietnam
- Languages at home
- 78% English-only · Spanish 14% French/Haitian/Cajun 2% German/W. Germanic 1%
Political lean MEDSL · Manatee
- 2024 margin
- Strong R (+23.5) · D 37.9% · R 61.4%
- 2008→2024 swing
- -16.5pp toward R · 2008: -7.0pp · 2024: -23.5pp
- All cycles
- 2024: R+23.5 2020: R+16.1 2016: R+17.1 2012: R+12.5 2008: R+7.0
Not yet ingested
- Civics
- —
Market trends
- HPI YoY
- ▼ -310.18%
- Current HPI
- 369.8239
- Rent YoY
- ▼ -2.43%
- Metro
- North Port-Sarasota-Bradenton, FL
- State GDP YoY
- ▲ 3.28%
- F500 in state
- 36
Industry mix (Fortune 500 HQ in FL)
| Industry | F500 HQs | Revenue |
|---|---|---|
| Industrial Technology | 2 | $29B |
|
||
| Insurance | 2 | $17B |
|
||
| Retail | 1 | $60B |
|
||
| Technology Distribution | 1 | $58B |
|
||
| Homebuilding | 1 | $35B |
|
||
| Technology Manufacturing | 1 | $35B |
|
||
Price history
+383.3% since first listed9 events — show timeline
- 2026-02-24 Listed $219,900 Stellar MLS as Distributed by MLS Grid
- 2013-02-28 Sold (MLS) $68,000 Stellar MLS as Distributed by MLS Grid
- 2013-01-25 Listed $69,900 Stellar MLS as Distributed by MLS Grid
- 2005-02-01 Sold (Public Records) $125,000 Public Records
- 2005-01-31 Sold (MLS) $125,000 Stellar MLS as Distributed by MLS Grid
- 2004-12-16 Listing Removed — Stellar MLS as Distributed by MLS Grid
- 2004-07-30 Listed $134,900 Stellar MLS as Distributed by MLS Grid
- 2001-09-18 Sold (Public Records) $74,200 Public Records
- 1988-12-13 Sold (Public Records) $45,500 Public Records
Property tax history
+8.8%/yrLatest (2025): $3,492 · +5.5% YoY. Source: county tax records.
Cash-flow waterfall
monthlySold comps — $/sqft
last 12 mo · ≤1 miLoading sold comps…