 Multi-family
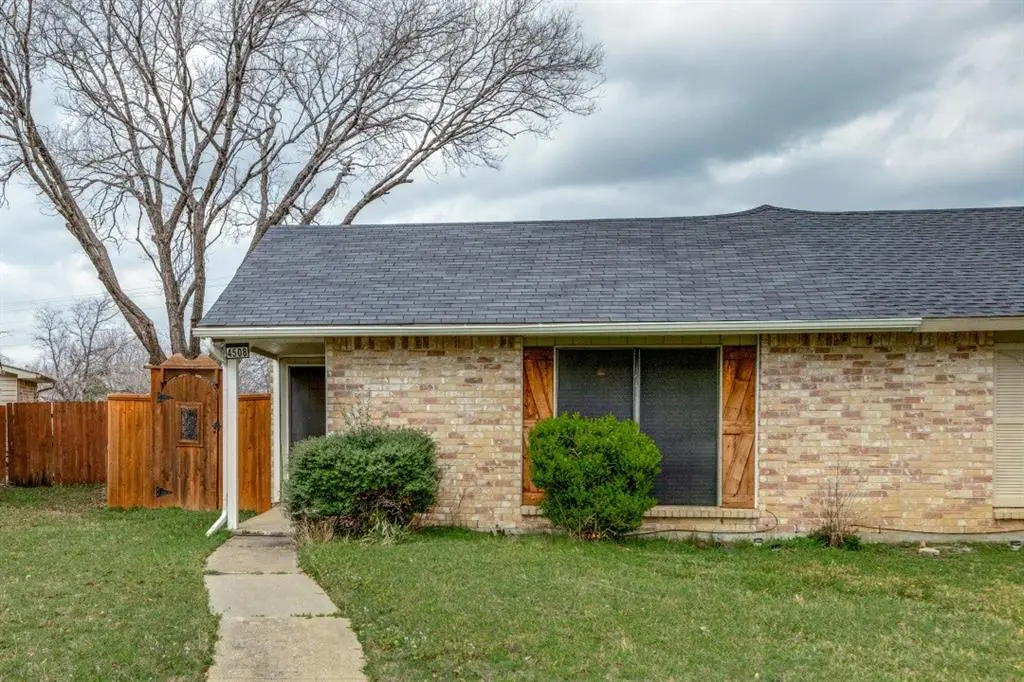
4508 Carr St · The Colony, TX
Flood risk 1/10 · Minimal
- FEMA flood zone
- X (unshaded)
- Chance of flooding over 30 yrs
- 0.0%
- Est. flood insurance / yr
- $507 – $1,088
Fire risk 3/10 · Minor
- Est. fire insurance / yr
- $1,222 – $2,270
Heat risk 7/10 · Major
- Hot days now (above 110°F)
- 7 days/yr
- Hot days in 30 yrs
- 22 days/yr
Wind risk 5/10 · Moderate
- Chance of severe wind over 30 yrs
- 26.0%
Air-quality risk 4/10 · Minor
- Unhealthy air days now
- 4 days/yr
- Unhealthy air days in 30 yrs
- 5 days/yr
Risk factors via First Street. Map © Google.
Why this score? — see what drove the C grade
The composite is a weighted blend of 9 inputs, each scored 0–100. Each bar is that input's sub-score; the figure is the points it added to the 100-point composite (weight × sub-score).
- Cash flow +24.0/30.0
- DSCR +7.7/10.0
- 1% rule +6.8/10.0
- Schools +4.7/10.0
- ARV discount +4.2/15.0
- Livability +3.4/5.0
- Condition / age +2.5/5.0
- Rent growth +2.2/5.0
- Appreciation +0.0/10.0
$247,900
🖨 Deal sheet 📄 Offer letter ✓ Due diligence
Multi-family units
County records classify this as Multi-Family (2-4 Unit). Listing-text estimate: 1 unit. estimate disagrees with records
Listing remarks MLS
Great place to call home in the heart of The Colony Texas! Excellent location with easy access to North Dallas Tollway, SRT 121, not to mention the multitude of shopping and eateries! Unwind in the evening and weekends at the nearby parks, hike access via trailheads, play golf at the affordable and beautiful 9-hole course located on Lake Lewisville with incredible views! So, if you are looking for a place to hang your hat or invest, this property has it all.
Key facts
- North texas location
- Scenic trails
- Nearby parks
Tags
Neighborhood map
What this means for you Summary
Snapshot
- This is a 2-bed/1.0-bath multifamily listed at $248k.
Deal economics
- At list price, monthly cash flow is $483 ($6k/yr) — positive.
- The deal already cash-flows at list — no discount required.
- Meets the 1% rule at list price ($3k rent vs $248k).
- Cap rate 8.6% vs local median 2.9% in The Colony — top-decile yield for the area; either an underpriced asset or a hidden risk that comps aren't pricing in. Stress-test before assuming the spread holds.
Location & tenants
- Location reads 68/100 on livability (#464 in TX) — a middle-class / working-renter tenant base. Strengths: employment A+, housing A+, crime B+; Watch: amenities F, commute F.
- Lewisville ISD (suburban): math 49% / reading 54% proficiency, ranked #109 of 826 in TX (top 13%) — acceptable for families but not a draw, mixed tenant base, ~2y average lease.
- Market conditions: Rents soft (-1.0%/yr); 427 active listings in the ZIP; 11 comparable units currently listed for rent nearby; rentals leasing fast (median 13d on market — plan ~1-2 weeks tenant-placement turnaround); high-income renter base; 10,531 units permitted in Denton County in 2024 (2,713 in 5+ unit buildings).
Forward outlook
- Local home prices are declining (-3.0%/yr); year-one equity from $2k of loan paydown is wiped out by about $7k of value loss. Plan a longer hold.
- Denton County population projected at +66% by 2050 — long-run rental-demand tailwind backs the buy-and-hold thesis.
Negotiation context
- Only 3 days on market — expect competitive offers; lowballing is unlikely to land.
- 10 sale attempts since 19y ago; this cycle's ask has dropped $19k (7%) from the opening price — seller is motivated, your offer sets the floor, not the list.
- Current owner paid $74k; list at $248k implies a 237% gain — meaningful room to come down on a strong offer.
Risks & watch-outs
- Climate carrying-cost: moderate wind risk, 26% chance of damaging wind over 30y; extreme-heat days projected 7→22/yr by 2055 (HVAC capex compounding) — expect insurance premiums to compound above CPI over the hold.
Questions for the listing agent
- Is there a deadline driving the sale (1031 exchange, divorce, estate, relocation)? That informs how much negotiation room exists.
- Schools are B-rated — typically a magnet for longer-tenancy family renters. What's the average tenant stay here, and is there a school-zone premium baked into asking?
- What's the average days-on-market for RENTAL listings here right now (not sales)? A rising rental-DOM trend means longer vacancies and softer asking-rent achievability than the comps imply.
- What's the recent tenant-quality profile in this submarket — average credit score on applications, eviction rate, late-payment / NSF rate, and stable-employment percentage? A property-management company in the area should have these aggregated.
- How much new apartment / multifamily construction is in the pipeline within 1–3 miles? Heavy new supply (>2% of stock underway) typically softens rents 12–24 months out; light construction supports rent growth.
Investment metrics
- 1% rule
- 1.18% ✓
- Cap rate
- 8.63%
- Cash-on-cash
- 8.35%
- DSCR
- 1.37
- GRM
- 7.1
CMA / ARV
- ARV (median comp)
- $230,762
- List price
- $247,900
- Delta
- 7.43%
- Verdict
- FAIR
- Comps
- 8 within 1.0 mi
Projected returns pro-forma
-3.0% appreciation · 0.0% rent growth · sell at horizon
- IRR
- -7.2%
- Equity multiple
- 0.74×
- Total profit
- $-17,827
- Equity at exit
- $36,963
- IRR
- -2.1%
- Equity multiple
- 0.88×
- Total profit
- $-8,469
- Equity at exit
- $21,434
Cash invested: $69,412 (down + closing). Projections, not guarantees.
Landlord ↔ Tenant lean methodology
- Overall (STATE)
- 87 Strongly Landlord-Friendly
- State Texas
- 87 Strongly Landlord-Friendly · R+5
- County
- — inherits STATE
- City
- — inherits STATE
ZIP-level market 75056
- Rents YoY
- -1.0%
- Active inventory
- 427
- Price-to-rent
- 14.2×
Monthly cashflow live
- Estimated rent
- $2,916 medium interval (Pro) →
- Mortgage (P&I)
- −$1,300
- Tax from tax record
- −$417 /mo · $5,005/yr
- Insurance
- −$103
- HOA
- −$0
- Vacancy / Maint / Mgmt
- −$612
- Net cashflow
- $483
Break-even live
2-unit breakdown (identical units grouped — click to expand)
| Units | Beds | Baths | Est. rent |
|---|---|---|---|
| 2× units | 2 | 1 | $2,916 |
| #1 | 2 | 1 | $1,458 |
| #2 | 2 | 1 | $1,458 |
| Total (2 units) | $2,916 | ||
UW: 25.0% down · 7.5% · 30yr · 1.5% tax · 5.0% vac · 8.0% maint · 8.0% mgmt
Financing live
Cash to close
- Down payment
- $61,975
- Closing costs
- $7,437
- Reserves months
- —
- Total cash needed
- —
Loan-product check · same deal, 3 products live
Conventional
25% down · 7.5% · 30yr
- Down + closing
- —
- Monthly P&I
- —
- Monthly cashflow
- —
- DSCR
- —
- Eligible?
- —
Personal DTI + credit; lowest rate.
DSCR
20% down · 8.5% · 30yr
- Down + closing
- —
- Monthly P&I
- —
- Monthly cashflow
- —
- DSCR
- —
- Eligible?
- —
No personal income docs; deal must DSCR.
Hard money
10% down · 12.0% · 12mo
- Down + closing
- —
- Monthly P&I
- —
- Monthly cashflow
- —
- DSCR
- —
- Eligible?
- —
Short-term bridge; refi at stabilization.
Rent comps 11 comps
| Address | Beds | Baths | Sqft | Rent | $/sqft | DOM | Units | Dist |
|---|---|---|---|---|---|---|---|---|
| 4456 Chapman St The Colony, TX | 2.0 | 1.0 | 949 | $1,395 | $1.47 | 15d | 1 | 0.04mi |
| 4646 Carr St The Colony, TX | 2.0 | 1.0 | 1008 | $1,600 | $1.59 | 12d | 1 | 0.23mi |
| 4632 Jenkins Cir The Colony, TX | 2.0 | 1.0 | 1035 | $1,450 | $1.40 | 24d | 1 | 0.27mi |
| 4632 Jenkins Cir The Colony, TX | 2.0 | 1.0 | 1035 | $1,450 | $1.40 | 43d | 1 | 0.27mi |
| 4628 Nervin St The Colony, TX | 3.0 | 1.0 | 1112 | $1,790 | $1.61 | 43d | 1 | 0.30mi |
| 5050 Farm to Market Road 423 Unit 5087 Frisco, TX | 2.0 | 2.0 | 1103 | $1,456 | $1.32 | 15d | 1 | 1.26mi |
| 5050 Farm To Market RD Frisco, TX | 1.0–3.0 | 1.0–2.0 | 1121 | $1,767 | $1.58 | 1d | 30 | 1.28mi |
| 5050 Farm to Market Road 423 Unit 5065 Frisco, TX | 1.0 | 1.0 | 966 | $1,578 | $1.63 | 12d | 1 | 1.32mi |
| 5050 Farm to Market Road 423 Unit 5107 Frisco, TX | 2.0 | 2.0 | 1103 | $1,481 | $1.34 | 12d | 1 | 1.32mi |
| 5050 Farm to Market Road 423 Unit 5124 Frisco, TX | 1.0 | 1.0 | 660 | $1,169 | $1.77 | 2d | 1 | 1.32mi |
| 5050 FM 423 Frisco, TX | 2.0 | 2.0 | 1103 | $2,302 | $2.09 | 3d | 1 | 1.35mi |
Listing history 45 events
-
2026-06-18days on market $247,900 Active 3 DOM
-
2026-06-17days on market $247,900 Active 2 DOM
-
2026-06-15remarks 699-char remark
-
2026-06-15days on market $247,900 Active 1 DOM
-
2026-06-04days on market $247,900 Active 90 DOM
-
2026-06-03days on market $247,900 Active 89 DOM
-
2026-06-02days on market $247,900 Active 88 DOM
-
2026-06-01days on market $247,900 Active 87 DOM
-
2026-05-31days on market $247,900 Active 86 DOM
-
2026-03-19price $249,000 464-char remark
Show marketing remark (464 chars)
Great place to call home in the heart of The Colony Texas! Excellent location with easy access to North Dallas Tollway, SRT 121, not to mention the multitude of shopping and eateries! Unwind in the evening and weekends at the nearby parks, hike access via trailheads, play golf at the affordable and beautiful 9-hole course located on Lake Lewisville with incredible views! So, if you are looking for a place to hang your hat or invest, this property has it all.
-
2026-03-05$267,000 Active 464-char remark
Show marketing remark (464 chars)
Great place to call home in the heart of The Colony Texas! Excellent location with easy access to North Dallas Tollway, SRT 121, not to mention the multitude of shopping and eateries! Unwind in the evening and weekends at the nearby parks, hike access via trailheads, play golf at the affordable and beautiful 9-hole course located on Lake Lewisville with incredible views! So, if you are looking for a place to hang your hat or invest, this property has it all.
-
2023-09-01soldstatus
-
2023-08-31soldstatus Closed 113-char remark
Show marketing remark (113 chars)
Beautifully home on a huge lot, rear parking, stainless steel with a park view. Fresh paint and brand new carpet.
-
2023-08-18status Pending 113-char remark
Show marketing remark (113 chars)
Beautifully home on a huge lot, rear parking, stainless steel with a park view. Fresh paint and brand new carpet.
-
2023-08-13historical Active Option Contract 113-char remark
Show marketing remark (113 chars)
Beautifully home on a huge lot, rear parking, stainless steel with a park view. Fresh paint and brand new carpet.
-
2023-08-04$253,900 Active 113-char remark
Show marketing remark (113 chars)
Beautifully home on a huge lot, rear parking, stainless steel with a park view. Fresh paint and brand new carpet.
-
2019-03-05soldstatus
-
2019-03-01soldstatus Sold
-
2019-01-30status Pending
-
2019-01-27historical Active Option Contract
-
2019-01-15$172,000 Active
-
2018-11-19soldstatus
-
2018-11-15soldstatus Sold
-
2018-11-14status Pending
-
2018-10-26$164,999 Active
-
2018-09-12historical
-
2018-08-18price $169,999
-
2018-08-18status Active
-
2018-08-09status Pending
-
2018-06-27soldstatus
-
2018-05-11$165,000 Active
-
2013-04-30soldstatus
-
2013-04-23soldstatus
-
2013-04-19soldstatus Closed
-
2013-04-18status Pending
-
2013-04-16$77,500 Active
-
2011-07-01historical
-
2011-02-11$79,900 Active
-
2011-02-01historical
-
2010-08-27$79,900 Active
-
2007-04-04soldstatus $73,500
-
2007-03-30soldstatus
-
2007-03-01historical
-
2007-01-04$73,500
-
1986-03-31soldstatus
ⓘ Source: listings_history table (triggers on properties + properties_extension) + one-shot
backfill from property_details.listing_events for pre-trigger history.
Tax reassessment forecast TX · Resets to sale price
- Current annual tax
- $5,005 · $417/mo
- Projected year-2 tax
- $5,005 · $417/mo
- Expected delta
- $0/yr ($0/mo · 0.0%)
ⓘ Screening estimate from a state-policy table — verify with the county assessor before closing.
Climate risk First Street
- Flood 1/10 Low FEMA zone X (unshaded) · 0% chance over 30 yrs
- Wildfire 3/10 Moderate
- Heat 7/10 Severe 7 d/yr ≥110°F today · 22 d/yr by 30 yrs out
- Wind 5/10 Major 26% chance of damaging wind over 30 yrs
- Air quality 4/10 Moderate 4 unhealthy d/yr today · 5 by 30 yrs out
Nearby sold comps map
Loading sold comps map…
Walkable amenities ~0.75 mi
Loading nearby amenities…
Taxation est. · year 1
- Rental income
- $34,992
- − Mortgage interest
- −$13,886
- − Property taxes
- −$5,005
- − Insurance
- −$1,240
- − Repairs & maintenance
- −$2,799
- − Management
- −$2,799
- − Depreciation
- −$7,212
- Taxable income
- $2,051
- Est. tax owed @ 24.0%
- −$492
- After-tax cash flow
- $5,307/yr
For passive investors: Depreciation is non-cash, so a rental often shows a tax loss while cash-flowing — sheltering income. Rental losses are passive: they offset passive income freely, and up to $25,000/yr can offset ordinary (W-2) income if you actively participate and your MAGI is under $100k (phasing out to $0 by $150k); unused losses carry forward. On sale, claimed depreciation is recaptured at up to 25%, and gains may owe capital-gains tax (a 1031 exchange can defer both). Figures are a year-1 estimate at your 24.0% rate — not tax advice; consult a CPA.
Schools (NCES district)
- District
- Lewisville ISD
- NCES district ID
- 4827300
- Math proficiency
- 49% ▼ -10.00%
- Reading proficiency
- 54% ▼ -4.00%
- Median HH income
- $82,351
- Composite
- 47.1/100
- National rank
- #2333
- State rank
- #109 of 826 in TX
Livability — The Colony
- Score
- 68/100
- State rank
- #464
- US rank
- #9336
Category grades
Schools grade is shown separately in the Schools card above.
Census & demographics
- Census place
- The Colony, TX
- County
- Denton County · 901,654 people
- City population
- 69,628
- Metro
- Dallas-Fort Worth-Arlington, TX
- Population (ZIP)
- 69,628
- Household income
- $119,682
- Rent vs Own
- Severe rent burden
- 1704.0
Population outlook (Denton County) Hauer SSP2
- Today (2025)
- 1,053,010 people
- By 2030
- 1,192,269 · +13.2%
- By 2040
- 1,472,920 · +39.9%
- By 2050
- 1,746,506 · +65.9%
- By 2075
- 2,358,497 · +124.0%
- By 2100
- 2,779,183 · +163.9%
Race, ethnicity, and origin ACS 2023
- Neighborhood character
- Diverse neighborhood (Simpson 0.69)
- Race & ethnicity
- White 49% Hispanic / Latino 18% Asian 17% Two or more races 13% Black 10%
- Hispanic origin (detail)
- Mexican 12% Cuban 1%
- Common ancestry
- Slovak 2% Italian 1% Lithuanian 1%
- Foreign-born
- 19% · Canada, South Korea, China
- Languages at home
- 73% English-only · Spanish 11% Other Indo-European 5% Other Asian/Pacific 4%
Political lean MEDSL · Denton
- 2024 margin
- R (+13.2) · D 42.7% · R 55.8% · Other 1.5%
- 2008→2024 swing
- +11.0pp toward D · 2008: -24.2pp · 2024: -13.2pp
- All cycles
- 2024: R+13.2 2020: R+8.1 2016: R+20.2 2012: R+31.7 2008: R+24.2
Not yet ingested
- Civics
- —
Market trends
- HPI YoY
- ▼ -235.14%
- Current HPI
- 288.9388
- Rent YoY
- ▼ -1.02%
- Metro
- Dallas-Fort Worth-Arlington, TX
- State GDP YoY
- ▲ 3.95%
- F500 in state
- 110
Industry mix (Fortune 500 HQ in TX)
| Industry | F500 HQs | Revenue |
|---|---|---|
| Energy | 16 | $1,198B |
|
||
| Technology | 5 | $198B |
|
||
| Engineering / Construction | 4 | $72B |
|
||
| Energy Services | 3 | $60B |
|
||
| Utilities | 3 | $41B |
|
||
| Healthcare | 2 | $330B |
|
||
Price history
+238.8% since first listed36 events — show timeline
- 2026-03-19 Price Changed $249,000 NTREIS
- 2026-03-05 Listed $267,000 NTREIS
- 2023-09-01 Sold (Public Records) — Public Records
- 2023-08-31 Sold (MLS) — NTREIS
- 2023-08-18 Pending — NTREIS
- 2023-08-13 Contingent — NTREIS
- 2023-08-04 Listed $253,900 NTREIS
- 2019-03-05 Sold (Public Records) — Public Records
- 2019-03-01 Sold (MLS) — NTREIS
- 2019-01-30 Pending — NTREIS
- 2019-01-27 Contingent — NTREIS
- 2019-01-15 Listed $172,000 NTREIS
- 2018-11-19 Sold (Public Records) — Public Records
- 2018-11-15 Sold (MLS) — NTREIS
- 2018-11-14 Pending — NTREIS
- 2018-10-26 Listed $164,999 NTREIS
- 2018-09-12 Listing Removed — NTREIS
- 2018-08-18 Price Changed $169,999 NTREIS
- 2018-08-18 Relisted — NTREIS
- 2018-08-09 Pending — NTREIS
- 2018-06-27 Sold (Public Records) — Public Records
- 2018-05-11 Listed $165,000 NTREIS
- 2013-04-30 Sold (Public Records) — Public Records
- 2013-04-23 Sold (Public Records) — Public Records
- 2013-04-19 Sold (MLS) — NTREIS
- 2013-04-18 Pending — NTREIS
- 2013-04-16 Listed $77,500 NTREIS
- 2011-07-01 Listing Removed — NTREIS
- 2011-02-11 Listed $79,900 NTREIS
- 2011-02-01 Listing Removed — NTREIS
- 2010-08-27 Listed $79,900 NTREIS
- 2007-04-04 Sold (Public Records) $73,500 Public Records
- 2007-03-30 Sold (MLS) — NTREIS
- 2007-03-01 Listing Removed — NTREIS
- 2007-01-04 Listed $73,500 NTREIS
- 1986-03-31 Sold (Public Records) — Public Records
Property tax history
+7.2%/yrLatest (2025): $5,005 · -4.3% YoY. Source: county tax records.
Cash-flow waterfall
monthlySold comps — $/sqft
last 12 mo · ≤1 miLoading sold comps…