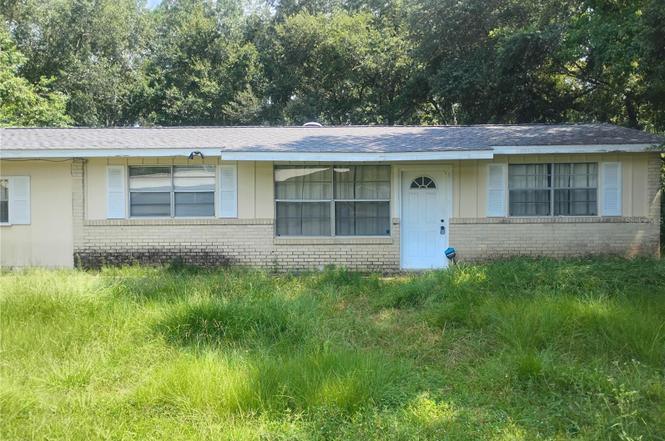
3212 Glade Dr · Avalon, FL
Flood risk 6/10 · Moderate
- FEMA flood zone
- X (shaded)
- Chance of flooding over 30 yrs
- 0.54%
- Est. flood insurance / yr
- $507 – $1,088
Fire risk 5/10 · Moderate
- Est. fire insurance / yr
- $947 – $1,759
Heat risk 10/10 · Severe
- Hot days now (above 105°F)
- 7 days/yr
- Hot days in 30 yrs
- 22 days/yr
Wind risk 9/10 · Severe
- Chance of severe wind over 30 yrs
- 99.0%
Air-quality risk 1/10 · Minimal
- Unhealthy air days now
- 0 days/yr
- Unhealthy air days in 30 yrs
- 0 days/yr
Risk factors via First Street. Map © Google.
Why this score? — see what drove the B grade
The composite is a weighted blend of 9 inputs, each scored 0–100. Each bar is that input's sub-score; the figure is the points it added to the 100-point composite (weight × sub-score).
- Cash flow +30.0/30.0
- 1% rule +10.0/10.0
- DSCR +10.0/10.0
- ARV discount +7.5/15.0
- Schools +5.3/10.0
- Rent growth +3.6/5.0
- Livability +3.2/5.0
- Condition / age +2.5/5.0
- Appreciation +0.0/10.0
$110,000
🖨 Deal sheet 📄 Offer letter ✓ Due diligence
Listing remarks MLS
NO DAMAGE FROM HURRICANE ~ Located just minutes from I-10 ~ 3 bedrooms ~ 2 baths ~ Fenced in yard ~ Kitchen complete with Stove, Microwave, and REFRIGERATOR ~ Inside Laundry ~ Large deck out back ~ Call today for your personal tour!
Key facts
- Shopping
- Quiet neighborhood
- Schools
Tags
Neighborhood map
What this means for you Summary
Snapshot
- This is a 3-bed/2.0-bath single-family listed at $110k.
Deal economics
- At list price, monthly cash flow is $1k ($13k/yr) — positive.
- The deal already cash-flows at list — no discount required.
- Meets the 1% rule at list price ($2k rent vs $110k).
- Recommended offer: $100k (9.0% below list) — sets the bar for market timing.
- Cap rate 17.9% vs local median 4.5% in Avalon — top-decile yield for the area; either an underpriced asset or a hidden risk that comps aren't pricing in. Stress-test before assuming the spread holds.
Location & tenants
- Location reads 65/100 on livability (#648 in FL) — a middle-class / working-renter tenant base. Strengths: crime A+, housing A+, cost of living A; Watch: schools F, amenities F, commute F.
- Santa Rosa (suburban): math 63% / reading 60% proficiency, ranked #8 of 73 in FL (top 11%) — acceptable for families but not a draw, mixed tenant base, ~2y average lease.
- Market conditions: Rents rising fast (+4.5%/yr); 806 active listings in the ZIP; 3 comparable units currently listed for rent nearby; rentals at typical pace (median 24d on market — plan ~3-4 weeks tenant-placement turnaround); solid renter incomes; 1,983 units permitted in Santa Rosa County in 2024 (128 in 5+ unit buildings).
- This rent runs 32% of the median local income ($85k/yr) — at the standard rent-burdened threshold; future hikes will face affordability resistance.
Forward outlook
- Local home prices are declining (-3.0%/yr); year-one equity from $761 of loan paydown is wiped out by about $3k of value loss. Plan a longer hold.
- Santa Rosa County population projected at +31% by 2050 — long-run rental-demand tailwind backs the buy-and-hold thesis.
- At projected returns (-3.0% appreciation + 4.5% rent growth), your $31k cash investment doubles in ~3 years — after that, you're playing with house money.
Negotiation context
- It's been on market 104 days — a 9% lower offer ($100k) is reasonable based on typical stale-listing flexibility.
- 3 sale attempts since 15y ago with the ask held roughly flat each time — persistent listings suggest the price (not the market) is what's stuck; bring a comps-based counter.
Risks & watch-outs
- Climate carrying-cost: major flood risk; severe wind risk, 99% chance of damaging wind over 30y; moderate wildfire risk; extreme-heat days projected 7→22/yr by 2055 (HVAC capex compounding) — expect insurance premiums to compound above CPI over the hold.
Questions for the listing agent
- It's been on market 104 days. Have you received any prior offers? Is the seller open to a 9% concession, seller financing, or rate buy-down credit?
- Built in 1962 — when were the roof, HVAC, electrical panel, plumbing, and water heater last replaced?
- Why hasn't it sold? Are there any deal-killer items the seller is aware of (foundation, flood, title, zoning, code violations)?
- Is there a deadline driving the sale (1031 exchange, divorce, estate, relocation)? That informs how much negotiation room exists.
- Schools are F-rated, which usually means shorter tenancies and higher turnover. Who's the typical renter profile here, and what's been the actual vacancy rate?
- What's the average days-on-market for RENTAL listings here right now (not sales)? A rising rental-DOM trend means longer vacancies and softer asking-rent achievability than the comps imply.
- What's the recent tenant-quality profile in this submarket — average credit score on applications, eviction rate, late-payment / NSF rate, and stable-employment percentage? A property-management company in the area should have these aggregated.
- How much new for-sale + rental construction is in the pipeline within 1–3 miles? Heavy new supply typically softens prices + rents 12–24 months out; constrained supply supports both.
Investment metrics
- 1% rule
- 2.05% ✓
- Cap rate
- 17.87%
- Cash-on-cash
- 41.33%
- DSCR
- 2.84
- GRM
- 4.1
CMA / ARV
- ARV (on-the-fly)
- $258,000
- Comps found
- 12
Show comp detail 12 sales within ~0.75 mi
| Address | Dist | Beds/Ba | Sqft | Sold | Price | $/sf | Match |
|---|---|---|---|---|---|---|---|
| 3288 Damon Dr | 0.27mi | 3/2.0 | 1,250 (+4%) | 4mo | $255,000 | $204 | 77 |
| 3324 Bonfire Dr | 0.44mi | 3/2.0 | 1,200 (0%) | 3mo | $200,000 | $167 | 77 |
| 3286 Damon Dr | 0.28mi | 3/2.0 | 1,250 (+4%) | 7mo | $249,900 | $200 | 74 |
| 5259 Sonoma Ct | 0.45mi | 3/2.0 | 1,312 (+9%) | 1mo | $408,500 | $311 | 62 |
| 3007 N 21st Ave | 0.51mi | 3/2.0 | 1,316 (+10%) | 2mo | $270,000 | $205 | 59 |
| 2944 N 25th Ave | 0.68mi | 3/2.0 | 1,152 (-4%) | 6mo | $235,000 | $204 | 57 |
| 3029 N 21st Ave | 0.45mi | 3/2.0 | 1,357 (+13%) | 1mo | $210,000 | $155 | 56 |
| 5263 Sonoma Ct | 0.45mi | 2/2.0 (-1) | 1,302 (+8%) | 5mo | $390,500 | $300 | 56 |
| 5318 Tuscaloosa St | 0.36mi | 2/2.0 (-1) | 1,053 (-12%) | 6mo | $234,900 | $223 | 53 |
| 5209 San Miguel St | 0.68mi | 3/2.5 | 1,269 (+6%) | 5mo | $349,000 | $275 | 53 |
| 2952 N 17th Ave | 0.67mi | 3/2.0 | 1,305 (+9%) | 7mo | $280,000 | $215 | 48 |
| 2887 N 24th Ave | 0.71mi | 3/2.0 | 1,020 (-15%) | 6mo | $220,000 | $216 | 37 |
Match score weights: distance 35% · size 25% · config 20% · recency 20%. Top-matched comps best support the ARV.
Projected returns pro-forma
-3.0% appreciation · 4.53% rent growth · sell at horizon
- IRR
- 39.6%
- Equity multiple
- 2.73×
- Total profit
- $53,272
- Equity at exit
- $16,401
- IRR
- 46.7%
- Equity multiple
- 5.82×
- Total profit
- $148,340
- Equity at exit
- $9,511
Cash invested: $30,800 (down + closing). Projections, not guarantees.
Landlord ↔ Tenant lean methodology
- Overall (STATE)
- 87 Strongly Landlord-Friendly
- State Florida
- 87 Strongly Landlord-Friendly · R+3
- County
- — inherits STATE
- City
- — inherits STATE
ZIP-level market 32583
- Home prices YoY
- -11.3%
- Rents YoY
- 4.5%
- Active inventory
- 806
- Price-to-rent
- 4.1×
Monthly cashflow live
- Estimated rent
- $2,254 medium interval (Pro) →
- Mortgage (P&I)
- −$577
- Tax from tax record
- −$97 /mo · $1,167/yr
- Insurance
- −$46
- HOA
- −$0
- Vacancy / Maint / Mgmt
- −$473
- Net cashflow
- $1,061
Break-even live
UW: 25.0% down · 7.5% · 30yr · 1.5% tax · 5.0% vac · 8.0% maint · 8.0% mgmt
Financing live
Cash to close
- Down payment
- $27,500
- Closing costs
- $3,300
- Reserves months
- —
- Total cash needed
- —
Loan-product check · same deal, 3 products live
Conventional
25% down · 7.5% · 30yr
- Down + closing
- —
- Monthly P&I
- —
- Monthly cashflow
- —
- DSCR
- —
- Eligible?
- —
Personal DTI + credit; lowest rate.
DSCR
20% down · 8.5% · 30yr
- Down + closing
- —
- Monthly P&I
- —
- Monthly cashflow
- —
- DSCR
- —
- Eligible?
- —
No personal income docs; deal must DSCR.
Hard money
10% down · 12.0% · 12mo
- Down + closing
- —
- Monthly P&I
- —
- Monthly cashflow
- —
- DSCR
- —
- Eligible?
- —
Short-term bridge; refi at stabilization.
Rent comps 3 comps
| Address | Beds | Baths | Sqft | Rent | $/sqft | DOM | Units | Dist |
|---|---|---|---|---|---|---|---|---|
| 3015 N 33rd Ave Milton, FL | 3.0 | 2.0 | 1373 | $1,950 | $1.42 | 23d | 1 | 0.96mi |
| 2989 N 5th Ave Milton, FL | 3.0 | 2.0 | 1144 | $2,400 | $2.10 | 23d | 1 | 1.18mi |
| 5604 Shooting Star Ct Milton, FL | 3.0 | 2.0 | 1324 | $2,300 | $1.74 | 14d | 1 | 1.49mi |
Listing history 14 events
-
2025-11-20status Pending
-
2025-10-23price $110,000
-
2025-08-08$115,000 Active
-
2020-12-02soldstatus $110,000
-
2020-11-30soldstatus $110,000 232-char remark
Show marketing remark (232 chars)
NO DAMAGE FROM HURRICANE ~ Located just minutes from I-10 ~ 3 bedrooms ~ 2 baths ~ Fenced in yard ~ Kitchen complete with Stove, Microwave, and REFRIGERATOR ~ Inside Laundry ~ Large deck out back ~ Call today for your personal tour!
-
2020-09-21$99,900 232-char remark
Show marketing remark (232 chars)
NO DAMAGE FROM HURRICANE ~ Located just minutes from I-10 ~ 3 bedrooms ~ 2 baths ~ Fenced in yard ~ Kitchen complete with Stove, Microwave, and REFRIGERATOR ~ Inside Laundry ~ Large deck out back ~ Call today for your personal tour!
-
2011-10-03soldstatus $63,000
-
2011-09-27soldstatus $63,000 684-char remark
Show marketing remark (684 chars)
Great getaway location for boating enthusiasts ~ Only 1 minute from the Mulat Bayou Boat Ramp and just another 5 minutes to the Archie Glover Park Boat Ramp, access to Escambia Bay ~ Nearly a full 1/3 acre ~ Home is Clean inside and out ~ Seller in the process of converting the office into the 3rd bedroom and will be done within a few weeks ~ Fenced backyard with access from the long driveway giving you plenty of room to park your boat ~ Cute Kitchen ~ Door from the kitchen leads out to the backyard and the large 14 x 26 foot wooden deck giving you plenty of room to entertain and enjoy the catch of the day ~ Located just a few minutes from Interstate-10 and the Avalon exit...
-
2011-04-14$69,900 684-char remark
Show marketing remark (684 chars)
Great getaway location for boating enthusiasts ~ Only 1 minute from the Mulat Bayou Boat Ramp and just another 5 minutes to the Archie Glover Park Boat Ramp, access to Escambia Bay ~ Nearly a full 1/3 acre ~ Home is Clean inside and out ~ Seller in the process of converting the office into the 3rd bedroom and will be done within a few weeks ~ Fenced backyard with access from the long driveway giving you plenty of room to park your boat ~ Cute Kitchen ~ Door from the kitchen leads out to the backyard and the large 14 x 26 foot wooden deck giving you plenty of room to entertain and enjoy the catch of the day ~ Located just a few minutes from Interstate-10 and the Avalon exit...
-
1998-05-05soldstatus $38,000
-
1987-03-01soldstatus $30,500
-
1983-11-01soldstatus $22,000
-
1977-04-01soldstatus $9,000
-
1975-12-01soldstatus $9,000
ⓘ Source: listings_history table (triggers on properties + properties_extension) + one-shot
backfill from property_details.listing_events for pre-trigger history.
Tax reassessment forecast FL · Resets to sale price
- Current annual tax
- $1,167 · $97/mo
- Projected year-2 tax
- $1,167 · $97/mo
- Expected delta
- $0/yr ($0/mo · 0.0%)
ⓘ Screening estimate from a state-policy table — verify with the county assessor before closing.
Climate risk First Street
- Flood 6/10 Major FEMA zone X (shaded) · 54% chance over 30 yrs
- Wildfire 5/10 Major
- Heat 10/10 Extreme 7 d/yr ≥105°F today · 22 d/yr by 30 yrs out
- Wind 9/10 Extreme 99% chance of damaging wind over 30 yrs
- Air quality 1/10 Low 0 unhealthy d/yr today · 0 by 30 yrs out
Nearby sold comps map
Loading sold comps map…
Walkable amenities ~0.75 mi
Loading nearby amenities…
Taxation est. · year 1
- Rental income
- $27,049
- − Mortgage interest
- −$6,162
- − Property taxes
- −$1,167
- − Insurance
- −$550
- − Repairs & maintenance
- −$2,164
- − Management
- −$2,164
- − Depreciation
- −$3,200
- Taxable income
- $11,643
- Est. tax owed @ 24.0%
- −$2,794
- After-tax cash flow
- $9,936/yr
For passive investors: Depreciation is non-cash, so a rental often shows a tax loss while cash-flowing — sheltering income. Rental losses are passive: they offset passive income freely, and up to $25,000/yr can offset ordinary (W-2) income if you actively participate and your MAGI is under $100k (phasing out to $0 by $150k); unused losses carry forward. On sale, claimed depreciation is recaptured at up to 25%, and gains may owe capital-gains tax (a 1031 exchange can defer both). Figures are a year-1 estimate at your 24.0% rate — not tax advice; consult a CPA.
Schools (NCES district)
- District
- Santa Rosa
- NCES district ID
- 1201650
- Math proficiency
- 63% ▼ -6.00%
- Reading proficiency
- 60% ▼ -5.00%
- Median HH income
- $58,161
- Composite
- 53.12/100
- National rank
- #1511
- State rank
- #8 of 73 in FL
Livability — Avalon
- Score
- 65/100
- State rank
- #648
- US rank
- #12530
Category grades
Schools grade is shown separately in the Schools card above.
Census & demographics
- County
- Santa Rosa County · 194,764 people
- Metro
- Pensacola-Ferry Pass-Brent, FL
- Population (ZIP)
- 31,828
- Household income
- $85,440
- Rent vs Own
- Severe rent burden
- 122.0
Population outlook (Santa Rosa County) Hauer SSP2
- Today (2025)
- 195,978 people
- By 2030
- 209,782 · +7.0%
- By 2040
- 235,293 · +20.1%
- By 2050
- 256,408 · +30.8%
- By 2075
- 298,074 · +52.1%
- By 2100
- 303,216 · +54.7%
Race, ethnicity, and origin ACS 2023
- Neighborhood character
- Predominantly White (74%)
- Race & ethnicity
- White 74% Black 11% Two or more races 10% Hispanic / Latino 6% Asian 1%
- Hispanic origin (detail)
- Mexican 3% Puerto Rican 2% Cuban 1%
- Common ancestry
- Italian 3% Slovak 2% Serbian 2%
- Foreign-born
- 3% · Canada
- Languages at home
- 94% English-only · Spanish 3%
Political lean MEDSL · Santa Rosa
- 2024 margin
- Solid R (+51.0) · D 24.1% · R 75.0%
- 2008→2024 swing
- -3.0pp toward R · 2008: -47.9pp · 2024: -51.0pp
- All cycles
- 2024: R+51.0 2020: R+46.5 2016: R+53.5 2012: R+52.6 2008: R+47.9
Not yet ingested
- Civics
- —
Market trends
- HPI YoY
- ▼ -38.35%
- Current HPI
- 301.8819
- Rent YoY
- ▲ 4.53%
- Metro
- Pensacola-Ferry Pass-Brent, FL
- State GDP YoY
- ▲ 3.28%
- F500 in state
- 36
Industry mix (Fortune 500 HQ in FL)
| Industry | F500 HQs | Revenue |
|---|---|---|
| Industrial Technology | 2 | $29B |
|
||
| Insurance | 2 | $17B |
|
||
| Retail | 1 | $60B |
|
||
| Technology Distribution | 1 | $58B |
|
||
| Homebuilding | 1 | $35B |
|
||
| Technology Manufacturing | 1 | $35B |
|
||
Price history
+1122.2% since first listed14 events — show timeline
- 2025-11-20 Pending — Stellar MLS as Distributed by MLS Grid
- 2025-10-23 Price Changed $110,000 Stellar MLS as Distributed by MLS Grid
- 2025-08-08 Listed $115,000 Stellar MLS as Distributed by MLS Grid
- 2020-12-02 Sold (Public Records) $110,000 Public Records
- 2020-11-30 Sold (MLS) $110,000 PARMLS
- 2020-09-21 Listed $99,900 PARMLS
- 2011-10-03 Sold (Public Records) $63,000 Public Records
- 2011-09-27 Sold (MLS) $63,000 PARMLS
- 2011-04-14 Listed $69,900 PARMLS
- 1998-05-05 Sold (Public Records) $38,000 Public Records
- 1987-03-01 Sold (Public Records) $30,500 Public Records
- 1983-11-01 Sold (Public Records) $22,000 Public Records
- 1977-04-01 Sold (Public Records) $9,000 Public Records
- 1975-12-01 Sold (Public Records) $9,000 Public Records
Property tax history
+10.9%/yrLatest (2025): $1,167 · +3.1% YoY. Source: county tax records.
Cash-flow waterfall
monthlySold comps — $/sqft
last 12 mo · ≤1 miLoading sold comps…