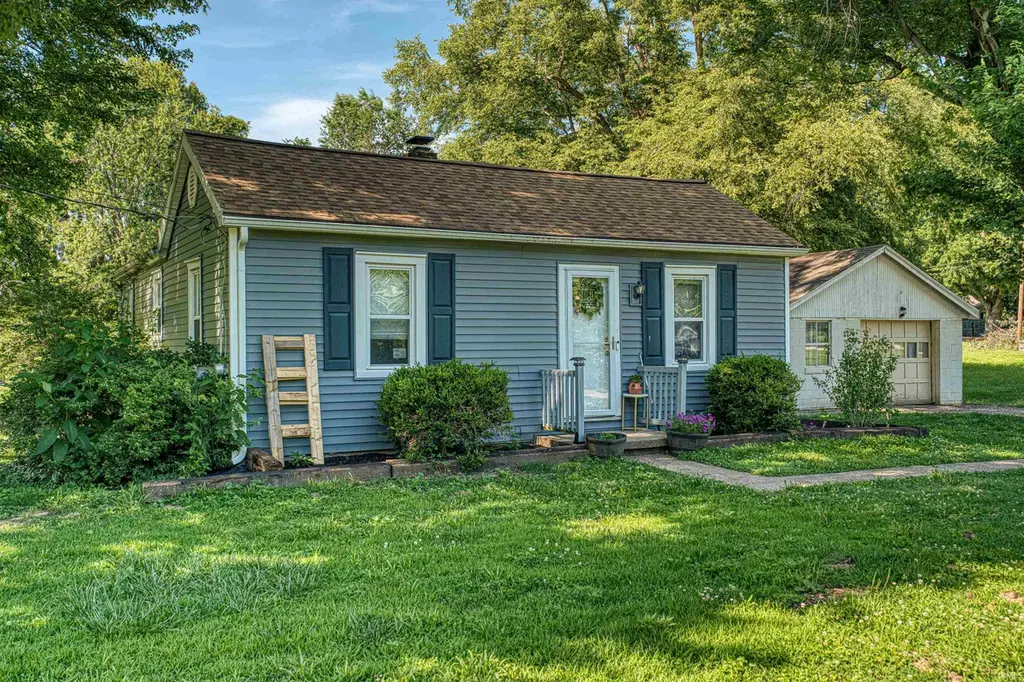
7824 Spry Rd · Evansville, IN
Flood risk 1/10 · Minimal
- FEMA flood zone
- X (unshaded)
- Chance of flooding over 30 yrs
- 0.0%
- Est. flood insurance / yr
- $473 – $860
Fire risk 1/10 · Minimal
- Est. fire insurance / yr
- $717 – $1,331
Heat risk 5/10 · Moderate
- Hot days now (above 106°F)
- 7 days/yr
- Hot days in 30 yrs
- 19 days/yr
Wind risk 2/10 · Minimal
- Chance of severe wind over 30 yrs
- 4.0%
Air-quality risk 3/10 · Minor
- Unhealthy air days now
- 3 days/yr
- Unhealthy air days in 30 yrs
- 4 days/yr
Risk factors via First Street. Map © Google.
Why this score? — see what drove the C- grade
The composite is a weighted blend of 9 inputs, each scored 0–100. Each bar is that input's sub-score; the figure is the points it added to the 100-point composite (weight × sub-score).
- Cash flow +21.4/30.0
- ARV discount +9.3/15.0
- DSCR +6.8/10.0
- 1% rule +4.5/10.0
- Schools +3.3/10.0
- Livability +3.2/5.0
- Rent growth +2.5/5.0
- Condition / age +2.5/5.0
- Appreciation +0.0/10.0
$175,000
🖨 Deal sheet (PDF) 📄 Offer letter ✓ Due diligence
Listing remarks MLS
Welcome to your secluded paradise that perfectly combines tranquility and convenience. Nestled on nearly an acre of land, this charming and updated 2-bedroom, 1-bathroom home offers a harmonious blend of modern comfort and natural beauty. Step inside to discover a refreshed interior that's been enhanced with a new HVAC system to ensure year-round comfort. The exterior boasts brand new vinyl siding that not only enhances the curb appeal but also promises long-lasting durability. The main level laundry adds convenience to your daily routine, while the cellar basement stands ready to provide shelter during storms. The large detached 1.5-car garage not only accommodates your vehicles but also provides ample space for a workshop. Adjacent to the property is a sprawling 2-acre yard, owned by a pipeline company. This means you'll be able to enjoy the feeling of an expansive yard without the upkeep. Don't miss the chance to claim this cozy haven as your own.
Key facts
- New siding
- New landscaping
- New hvac
Tags
Property features AI
Exterior
- Parking: Detached garage (approximately 1.5 car)
- Utilities: Public water; Septic tank
- Home design: Single-family residence, site-built; One story
- Construction: Vinyl siding
- Exterior features: Wooded lot
Interior
- Kitchen: Dishwasher; Electric cooktop
- Bedrooms: 5 total rooms (includes bedroom count within room total)
- Bathrooms: 1 full bathroom (main level)
- Heating & cooling: Central air conditioning; Natural gas heating
- Interior features: Dishwasher; Electric cooktop; Partial basement
- Laundry & utility: Laundry on main level
Neighborhood map
What this means for you Summary
Snapshot
- This is a 2-bed/1.0-bath single-family listed at $175k.
Deal economics
- At list price, monthly cash flow is $260 ($3k/yr) — positive.
- The deal already cash-flows at list — no discount required.
- To meet the 1% rule (rent ≥ 1% of price), the offer needs to be $167k (4.8% below list).
- Recommended offer: $167k (4.8% below list) — sets the bar for 1% rule.
- Cap rate 8.1% vs local median 4.6% in Evansville — top-decile yield for the area; either an underpriced asset or a hidden risk that comps aren't pricing in. Stress-test before assuming the spread holds.
Location & tenants
- Location reads 63/100 on livability (#416 in IN) — a middle-class / working-renter tenant base. Strengths: cost of living A+, housing A+, health & safety A+; Watch: crime F, commute F, employment D-.
- Evansville Vanderburgh School Corporation (urban): math 36% / reading 43% proficiency, ranked #153 of 301 in IN (top 51%) — families likely to look elsewhere, expect single-tenant / working-renter base with shorter leases.
- Zoned schools: Hebron Elementary School (math 37% / reading 35%, grade F, #577 of 994 statewide, top 59%, 758 students, 56% FRL); Plaza Park International Prep Acad (math 27% / reading 37%, grade F, #190 of 330 statewide, top 59%, 650 students, 65% FRL); William Henry Harrison High School (math 29% / reading 54%, grade F, #211 of 369 statewide, top 58%, 1,158 students, 61% FRL).
- Market conditions: 177 active listings in the ZIP; 9 comparable units currently listed for rent nearby; rentals at typical pace (median 22d on market — plan ~3-4 weeks tenant-placement turnaround); 508 units permitted in Vanderburgh County in 2024 (32 in 5+ unit buildings).
- This rent runs 33% of the median local income ($61k/yr) — at the standard rent-burdened threshold; future hikes will face affordability resistance.
Forward outlook
- Local home prices are declining (-3.0%/yr); year-one equity from $1k of loan paydown is wiped out by about $5k of value loss. Plan a longer hold.
Negotiation context
- Only 13 days on market — expect competitive offers; lowballing is unlikely to land.
- 4 sale attempts since 6y ago with the ask held roughly flat each time — persistent listings suggest the price (not the market) is what's stuck; bring a comps-based counter.
- Current owner paid $145k; 21% above their basis — modest negotiation headroom, anchor on the comps not their cost.
Risks & watch-outs
- Watch-outs: built in 1942 — expect roof / HVAC / electrical / plumbing capex.
- Climate carrying-cost: extreme-heat days projected 7→19/yr by 2055 (HVAC capex compounding) — expect insurance premiums to compound above CPI over the hold.
Questions for the listing agent
- Built in 1942 — when were the roof, HVAC, electrical panel, plumbing, and water heater last replaced?
- Is there a deadline driving the sale (1031 exchange, divorce, estate, relocation)? That informs how much negotiation room exists.
- Schools are D-rated, which usually means shorter tenancies and higher turnover. Who's the typical renter profile here, and what's been the actual vacancy rate?
- Crime grade is F in this area — have there been break-ins, vandalism, or insurance claims at this property in the last 3 years? What carrier currently insures it and at what premium?
- What's the average days-on-market for RENTAL listings here right now (not sales)? A rising rental-DOM trend means longer vacancies and softer asking-rent achievability than the comps imply.
- What's the recent tenant-quality profile in this submarket — average credit score on applications, eviction rate, late-payment / NSF rate, and stable-employment percentage? A property-management company in the area should have these aggregated.
- How much new for-sale + rental construction is in the pipeline within 1–3 miles? Heavy new supply typically softens prices + rents 12–24 months out; constrained supply supports both.
Investment metrics
- 1% rule
- 0.95% ✗
- Cap rate
- 8.07%
- Cash-on-cash
- 6.36%
- DSCR
- 1.28
- GRM
- 8.8
CMA / ARV
- ARV (on-the-fly)
- $182,448
- Comps found
- 9
Show comp detail 9 sales within ~0.75 mi
| Address | Dist | Beds/Ba | Sqft | Sold | Price | $/sf | Match |
|---|---|---|---|---|---|---|---|
| 7701 Pendleton Ave | 0.17mi | 2/1.0 | 884 (-12%) | 7mo | $159,900 | $181 | 66 |
| 7118 Pollack Ave | 0.49mi | 3/1.0 (+1) | 962 (-5%) | 2mo | $186,500 | $194 | 63 |
| 1831 Chickasaw Dr | 0.42mi | 3/1.5 (+1) | 1,076 (+7%) | 2mo | $180,000 | $167 | 60 |
| 6066 Indian Dr | 0.60mi | 2/1.0 | 936 (-7%) | 2mo | $176,400 | $188 | 58 |
| 7504 Pendleton Ave | 0.27mi | 3/2.0 (+1) | 1,120 (+11%) | 2mo | $210,250 | $188 | 58 |
| 2014 Audubon Dr | 0.51mi | 3/1.0 (+1) | 988 (-2%) | 13mo | $177,500 | $180 | 58 |
| 7402 Pendleton Ave | 0.33mi | 2/1.0 | 884 (-12%) | 8mo | $168,000 | $190 | 57 |
| 7423 Pendleton Ave | 0.31mi | 3/2.0 (+1) | 1,064 (+6%) | 16mo | $161,000 | $151 | 54 |
| 8201 Spry Rd | 0.22mi | 2/1.0 | 1,143 (+13%) | 19mo | $83,000 | $73 | 51 |
Match score weights: distance 35% · size 25% · config 20% · recency 20%. Top-matched comps best support the ARV.
Projected returns pro-forma
-3.0% appreciation · 3.0% rent growth · sell at horizon
- IRR
- -6.5%
- Equity multiple
- 0.76×
- Total profit
- $-11,886
- Equity at exit
- $26,093
- IRR
- 3.0%
- Equity multiple
- 1.22×
- Total profit
- $10,669
- Equity at exit
- $15,131
Cash invested: $49,000 (down + closing). Projections, not guarantees.
Landlord ↔ Tenant lean methodology
- Overall (STATE)
- 90 Strongly Landlord-Friendly
- State Indiana
- 90 Strongly Landlord-Friendly · R+11
- County
- — inherits STATE
- City
- — inherits STATE
ZIP-level market 47715
- Active inventory
- 177
- Price-to-rent
- 8.8×
Monthly cashflow live
- Estimated rent
- $1,666 high interval (Pro) →
- Mortgage (P&I)
- −$918
- Tax from tax record
- −$66 /mo · $791/yr
- Insurance
- −$73
- HOA
- −$0
- Vacancy / Maint / Mgmt
- −$350
- Net cashflow
- $260
Break-even live
Sensitivity live
| Price | -10% $359 | -5% $309 | +0% $260 | +5% $210 | +10% $161 |
|---|---|---|---|---|---|
| Rent | -10% $128 | -5% $194 | +0% $260 | +5% $326 | +10% $391 |
| Rate | -1.0pp $348 | -0.5pp $304 | base $260 | +0.5pp $214 | +1.0pp $168 |
UW: 25.0% down · 7.5% · 30yr · 1.5% tax · 5.0% vac · 8.0% maint · 8.0% mgmt
Financing live
Cash to close
- Down payment
- $43,750
- Closing costs
- $5,250
- Reserves months
- —
- Total cash needed
- —
Loan-product check · same deal, 3 products live
Conventional
25% down · 7.5% · 30yr
- Down + closing
- —
- Monthly P&I
- —
- Monthly cashflow
- —
- DSCR
- —
- Eligible?
- —
Personal DTI + credit; lowest rate.
DSCR
20% down · 8.5% · 30yr
- Down + closing
- —
- Monthly P&I
- —
- Monthly cashflow
- —
- DSCR
- —
- Eligible?
- —
No personal income docs; deal must DSCR.
Hard money
10% down · 12.0% · 12mo
- Down + closing
- —
- Monthly P&I
- —
- Monthly cashflow
- —
- DSCR
- —
- Eligible?
- —
Short-term bridge; refi at stabilization.
Rent comps 9 comps
| Address | Beds | Baths | Sqft | Rent | $/sqft | DOM | Units | Dist |
|---|---|---|---|---|---|---|---|---|
| 7501 E Powell Ave Evansville, IN | 3.0 | 1.0 | 1100 | $1,650 | $1.50 | 22d | 1 | 0.83mi |
| 4920 Penrose Dr Newburgh, IN | 3.0 | 2.0 | 1250 | $1,900 | $1.52 | 44d | 1 | 0.99mi |
| 4799 Imperial Dr Newburgh, IN | 3.0 | 2.0 | 1370 | $1,975 | $1.44 | 44d | 1 | 1.10mi |
| 10686 Fall Creek Dr Newburgh, IN | 3.0 | 2.0 | 1436 | $1,950 | $1.36 | 14d | 1 | 1.13mi |
| 6166 River Bluff Dr Newburgh, IN | 3.0 | 2.0 | 1282 | $2,500 | $1.95 | 44d | 1 | 1.18mi |
| 8416 Lincoln Ave Evansville, IN | 1.0–2.0 | 1.0 | 941 | $1,375 | $1.46 | 14d | 25 | 1.38mi |
| 410 Fuquay Rd Evansville, IN | 1.0–3.0 | 1.0–2.0 | 955 | $1,294 | $1.36 | 14d | 11 | 1.39mi |
| 5879 Riverwalk Cir Newburgh, IN | 3.0 | 2.0 | 1128 | $1,600 | $1.42 | 22d | 1 | 1.42mi |
| 9895 Cove Point Ct Newburgh, IN | 3.0 | 2.0 | 1307 | $1,950 | $1.49 | 22d | 1 | 1.48mi |
Listing history 11 events
-
2026-06-18days on market $175,000 Active 13 DOM
-
2026-06-17days on market $175,000 Active 12 DOM
-
2026-06-16pricedays on market $175,000 Active 11 DOM
-
2026-06-15days on market $180,000 Active 10 DOM
-
2026-06-14days on market $180,000 Active 8 DOM
-
2026-06-13days on market $180,000 Active 7 DOM
-
2026-06-10days on market $180,000 Active 5 DOM
-
2026-06-09days on market $180,000 Active 4 DOM
-
2026-06-08days on market $180,000 Active 3 DOM
-
2026-06-07remarks 623-char remark
-
2026-06-07$180,000 Active 2 DOM
ⓘ Source: listings_history table (triggers on properties + properties_extension) + one-shot
backfill from property_details.listing_events for pre-trigger history.
Tax reassessment forecast IN · Partial reset (capped growth)
- Current annual tax
- $791 · $66/mo
- Projected year-2 tax
- $1,139 · $95/mo
- Expected delta
- +$348/yr (+$29/mo · 44.1%)
ⓘ Screening estimate from a state-policy table — verify with the county assessor before closing.
Climate risk First Street
- Flood 1/10 Low FEMA zone X (unshaded) · 0% chance over 30 yrs
- Wildfire 1/10 Low
- Heat 5/10 Major 7 d/yr ≥106°F today · 19 d/yr by 30 yrs out
- Wind 2/10 Low 4% chance of damaging wind over 30 yrs
- Air quality 3/10 Moderate 3 unhealthy d/yr today · 4 by 30 yrs out
Nearby sold comps map
Loading sold comps map…
Walkable amenities ~0.75 mi
Loading nearby amenities…
Taxation est. · year 1
- Rental income
- $19,993
- − Mortgage interest
- −$9,803
- − Property taxes
- −$791
- − Insurance
- −$875
- − Repairs & maintenance
- −$1,599
- − Management
- −$1,599
- − Depreciation
- −$5,091
- Taxable income
- $235
- Est. tax owed @ 24.0%
- −$56
- After-tax cash flow
- $3,060/yr
For passive investors: Depreciation is non-cash, so a rental often shows a tax loss while cash-flowing — sheltering income. Rental losses are passive: they offset passive income freely, and up to $25,000/yr can offset ordinary (W-2) income if you actively participate and your MAGI is under $100k (phasing out to $0 by $150k); unused losses carry forward. On sale, claimed depreciation is recaptured at up to 25%, and gains may owe capital-gains tax (a 1031 exchange can defer both). Figures are a year-1 estimate at your 24.0% rate — not tax advice; consult a CPA.
Schools (NCES district)
- District
- Evansville Vanderburgh School Corporation
- NCES district ID
- 1803450
- Math proficiency
- 36% ▼ -7.00%
- Reading proficiency
- 43% ▼ -3.00%
- Median HH income
- $43,270
- Composite
- 33.41/100
- National rank
- #5471
- State rank
- #153 of 301 in IN
Livability — Evansville
- Score
- 63/100
- State rank
- #416
- US rank
- #15047
Category grades
Schools grade is shown separately in the Schools card above.
Census & demographics
- County
- Vanderburgh County · 146,793 people
- City population
- 146,793
- Metro
- Evansville, IN-KY
- Population (ZIP)
- 29,280
- Household income
- $60,897
- Rent vs Own
- Severe rent burden
- 1652.0
Population outlook (Vanderburgh County) Hauer SSP2
- Today (2025)
- 187,038 people
- By 2030
- 188,907 · +1.0%
- By 2040
- 190,272 · +1.7%
- By 2050
- 188,871 · +1.0%
- By 2075
- 180,751 · -3.4%
- By 2100
- 163,015 · -12.8%
Race, ethnicity, and origin ACS 2023
- Neighborhood character
- Predominantly White (74%)
- Race & ethnicity
- White 74% Black 13% Hispanic / Latino 6% Two or more races 4% Asian 2% Native American 1%
- Hispanic origin (detail)
- Mexican 5%
- Common ancestry
- Slovak 3% Romanian 2% Italian 2%
- Foreign-born
- 6% · Canada, China
- Languages at home
- 93% English-only · Spanish 4% Chinese 1%
Political lean MEDSL · Vanderburgh
- 2024 margin
- R (+12.7) · D 43.0% · R 55.6% · Other 1.4%
- 2008→2024 swing
- -15.1pp toward R · 2008: 2.5pp · 2024: -12.7pp
- All cycles
- 2024: R+12.7 2020: R+9.6 2016: R+16.9 2012: R+10.8 2008: D+2.5
Not yet ingested
- Civics
- —
Market trends
- HPI YoY
- ▼ -113.01%
- Current HPI
- 195.7299
- Rent YoY
- —
- Metro
- Evansville, IN-KY
- State GDP YoY
- ▲ 2.90%
- F500 in state
- 18
Industry mix (Fortune 500 HQ in IN)
| Industry | F500 HQs | Revenue |
|---|---|---|
| Industrial Machinery | 2 | $37B |
|
||
| Healthcare | 1 | $177B |
|
||
| Pharmaceuticals | 1 | $45B |
|
||
| Metals / Steel | 1 | $18B |
|
||
| Agriculture | 1 | $17B |
|
||
| Packaging | 1 | $12B |
|
||
Price history
+56.5% since first listed8 events — show timeline
- 2026-06-05 Listed $180,000 IRMLS
- 2023-11-01 Sold (MLS) $145,000 IRMLS
- 2023-10-02 Pending — IRMLS
- 2023-09-24 Relisted — IRMLS
- 2023-09-04 Pending — IRMLS
- 2023-08-29 Listed $145,000 IRMLS
- 2020-08-03 Sold (MLS) $110,000 IRMLS
- 2020-06-18 Listed $115,000 IRMLS
Property tax history
+21.5%/yrLatest (2024): $791 · -15.9% YoY. Source: county tax records.
Cash-flow waterfall
monthlySold comps — $/sqft
last 12 mo · ≤1 miLoading sold comps…